SLO Templates
SLO templates require configuration before creation. They generate dashboards with preconfigured widgets, thresholds, and time windows.- Availability SLO: Tracks service availability, target compliance, remaining error budget, the availability trend, headroom to target, top 5XX endpoints, and recent failing traces.
- Latency SLO: Tracks service percentile latency against a threshold. Supported percentiles are
P50,P90,P95, andP99. - Error Rate SLO: Tracks 5XX error rate against a threshold, including remaining budget, trend, endpoint breakdown, and failing traces.
- Custom Metric SLO: Tracks any MetoroQL query against a fixed threshold using either
<=or>=comparators.
7d and 30d.
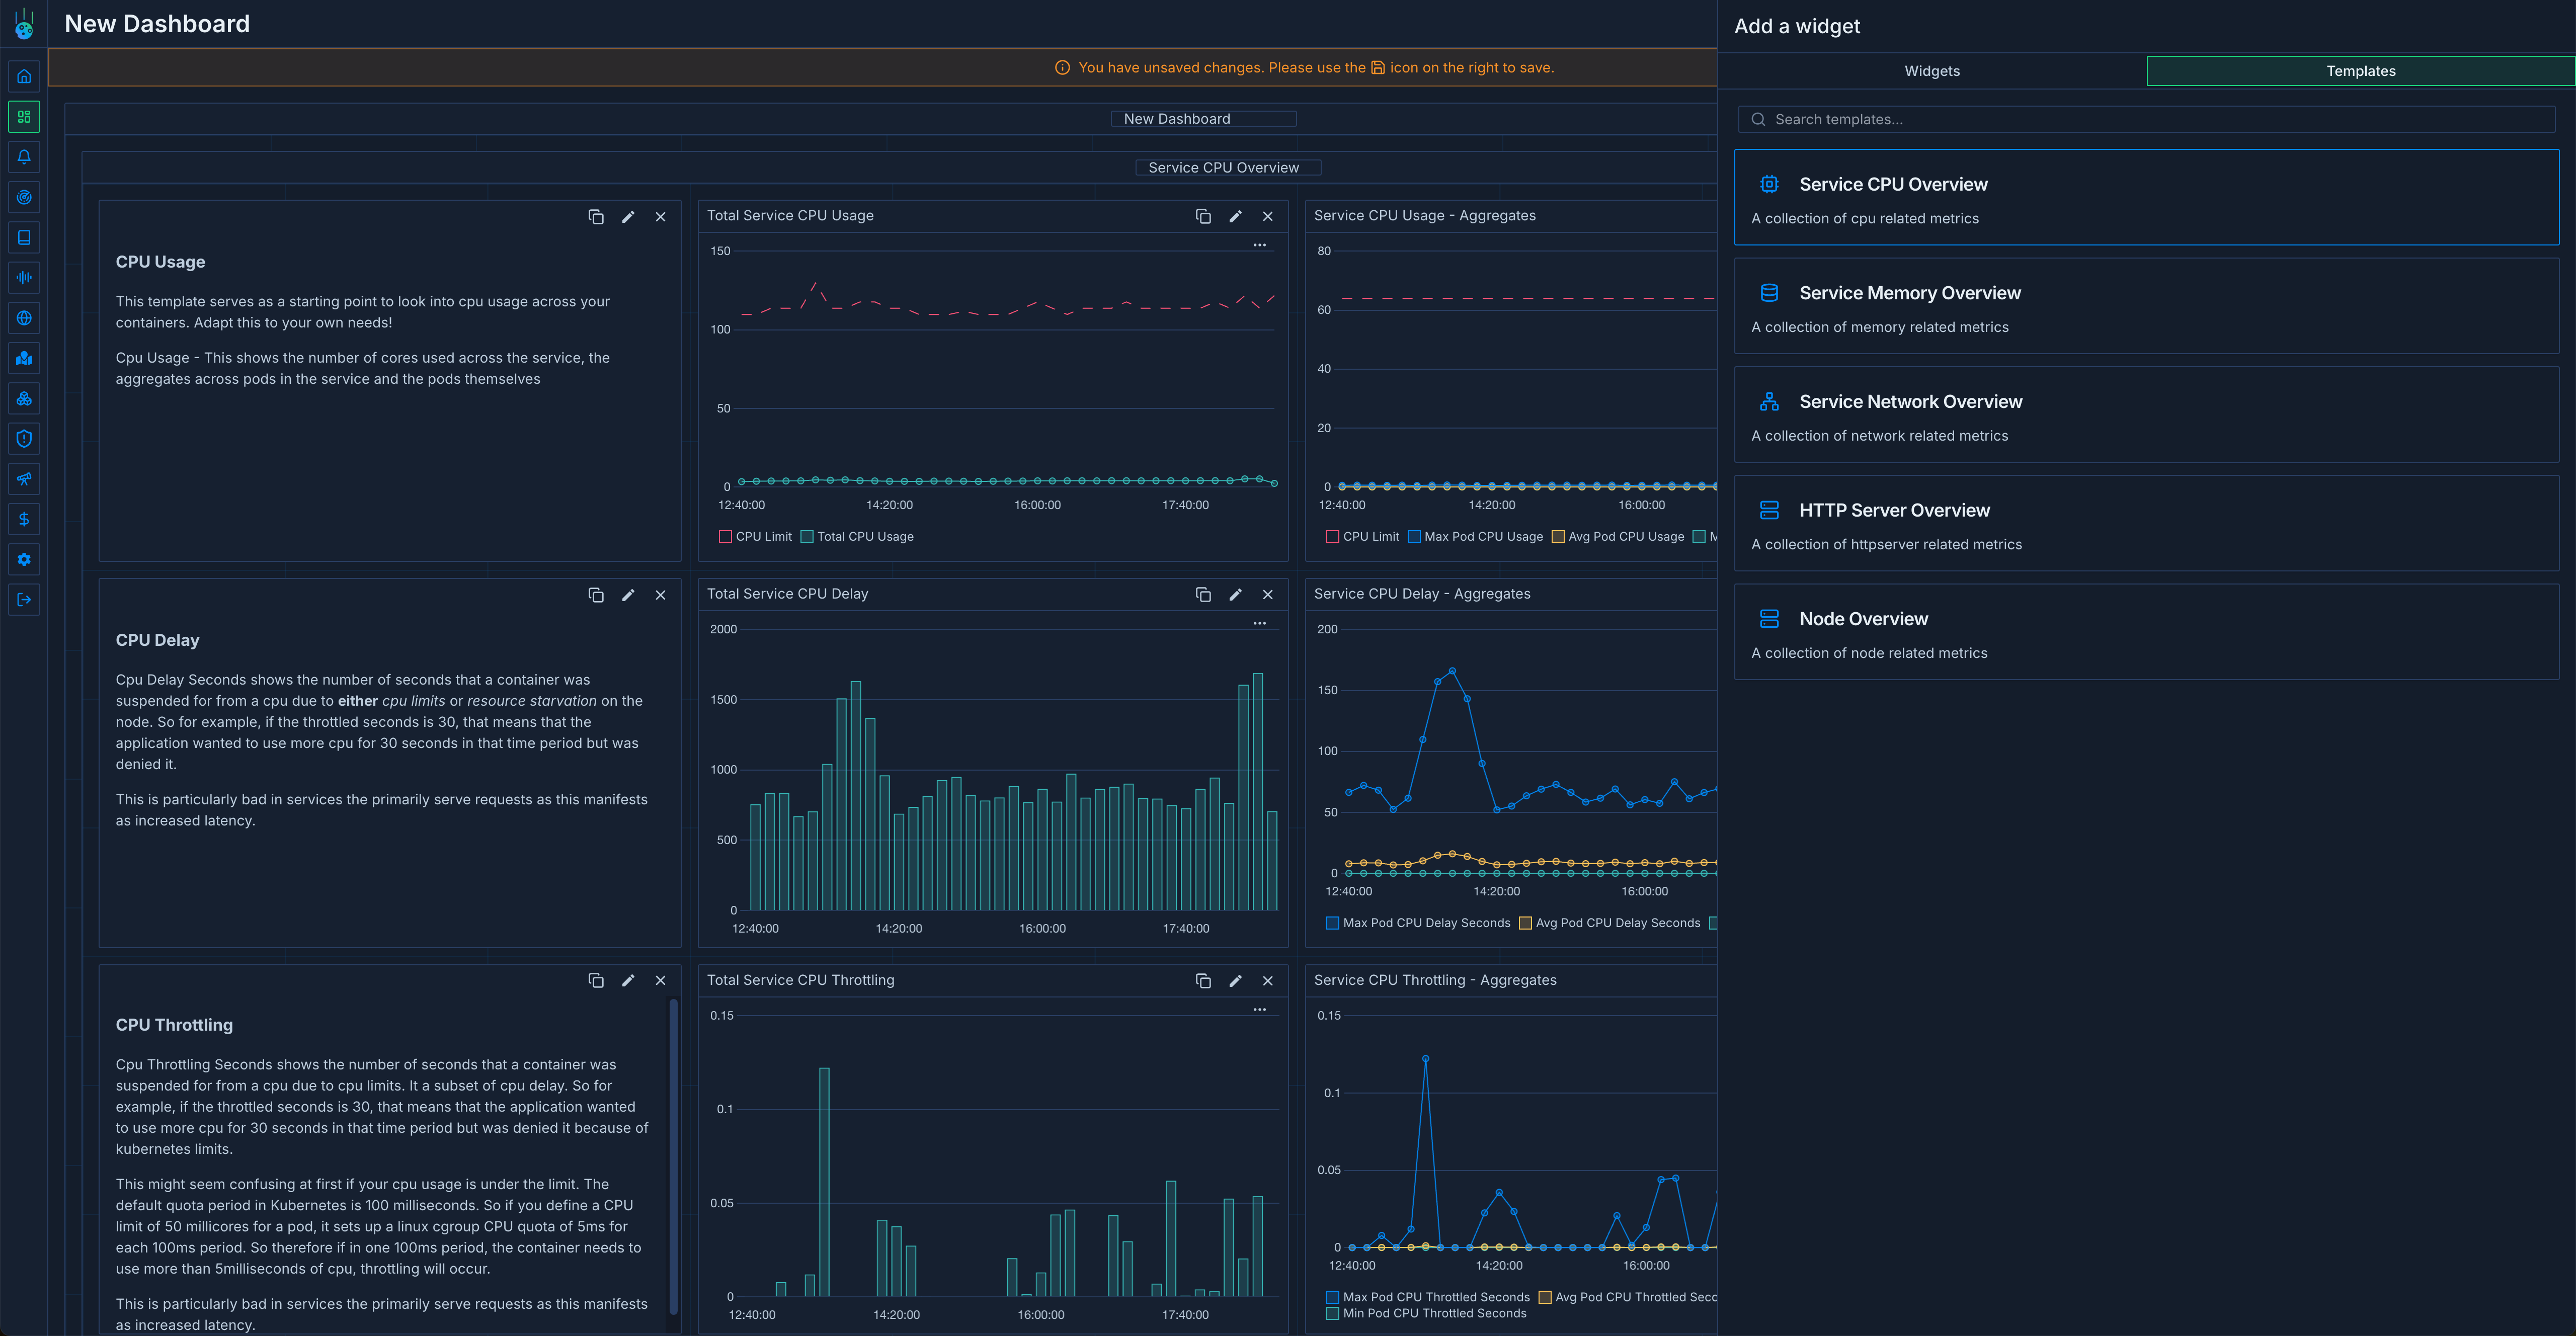
Standard Templates
Standard templates are ready-made and do not require extra configuration before insertion.- Service templates:
Service CPU Overview,Service Memory Overview,Service Network Overview, andHTTP Server Overview. - Infrastructure templates:
NVIDIA GPU Overview,Node Overview, andKarpenter Overview.
Using Templates
- Open Dashboards and click Create Dashboard.
- Select a template instead of starting from a blank dashboard.
- For SLO templates, provide the required configuration and apply the template.
- Save the generated dashboard, or continue editing it by adding widgets, variables, or additional groups.