
Overview
Unlike standard Kubernetes clusters where events are ephemeral and typically expire after an hour, Metoro provides permanent storage and analysis of all Kubernetes events. This allows you to track, analyze, and debug cluster activities over extended periods.Event Storage
Key features of Metoro’s event storage:- Permanent Storage: Events are retained for the full retention period
- Complete History: Records creation, updates, and deletion of events
- Service Association: Events are automatically linked to relevant services
- Cross-Cluster View: View events across all your clusters in one place
Event Attributes
Each event in Metoro contains rich metadata:- Type: Warning or Informational
- Resource Name: The affected resource
- Service Name: Associated service (Metoro-specific enhancement)
- Reason: The event trigger
- Message: Detailed event description
- Namespace: The involved object’s namespace
- Object Kind: The type of resource involved
- Reporting Component: Source component (e.g., Horizontal Pod Autoscaler)
- Count: Number of times the event has occurred
Metoro enhances standard Kubernetes events by automatically associating them with services. For example, if an event
involves a pod within a deployment that’s part of a service, the event will be linked to that service.
Viewing Events
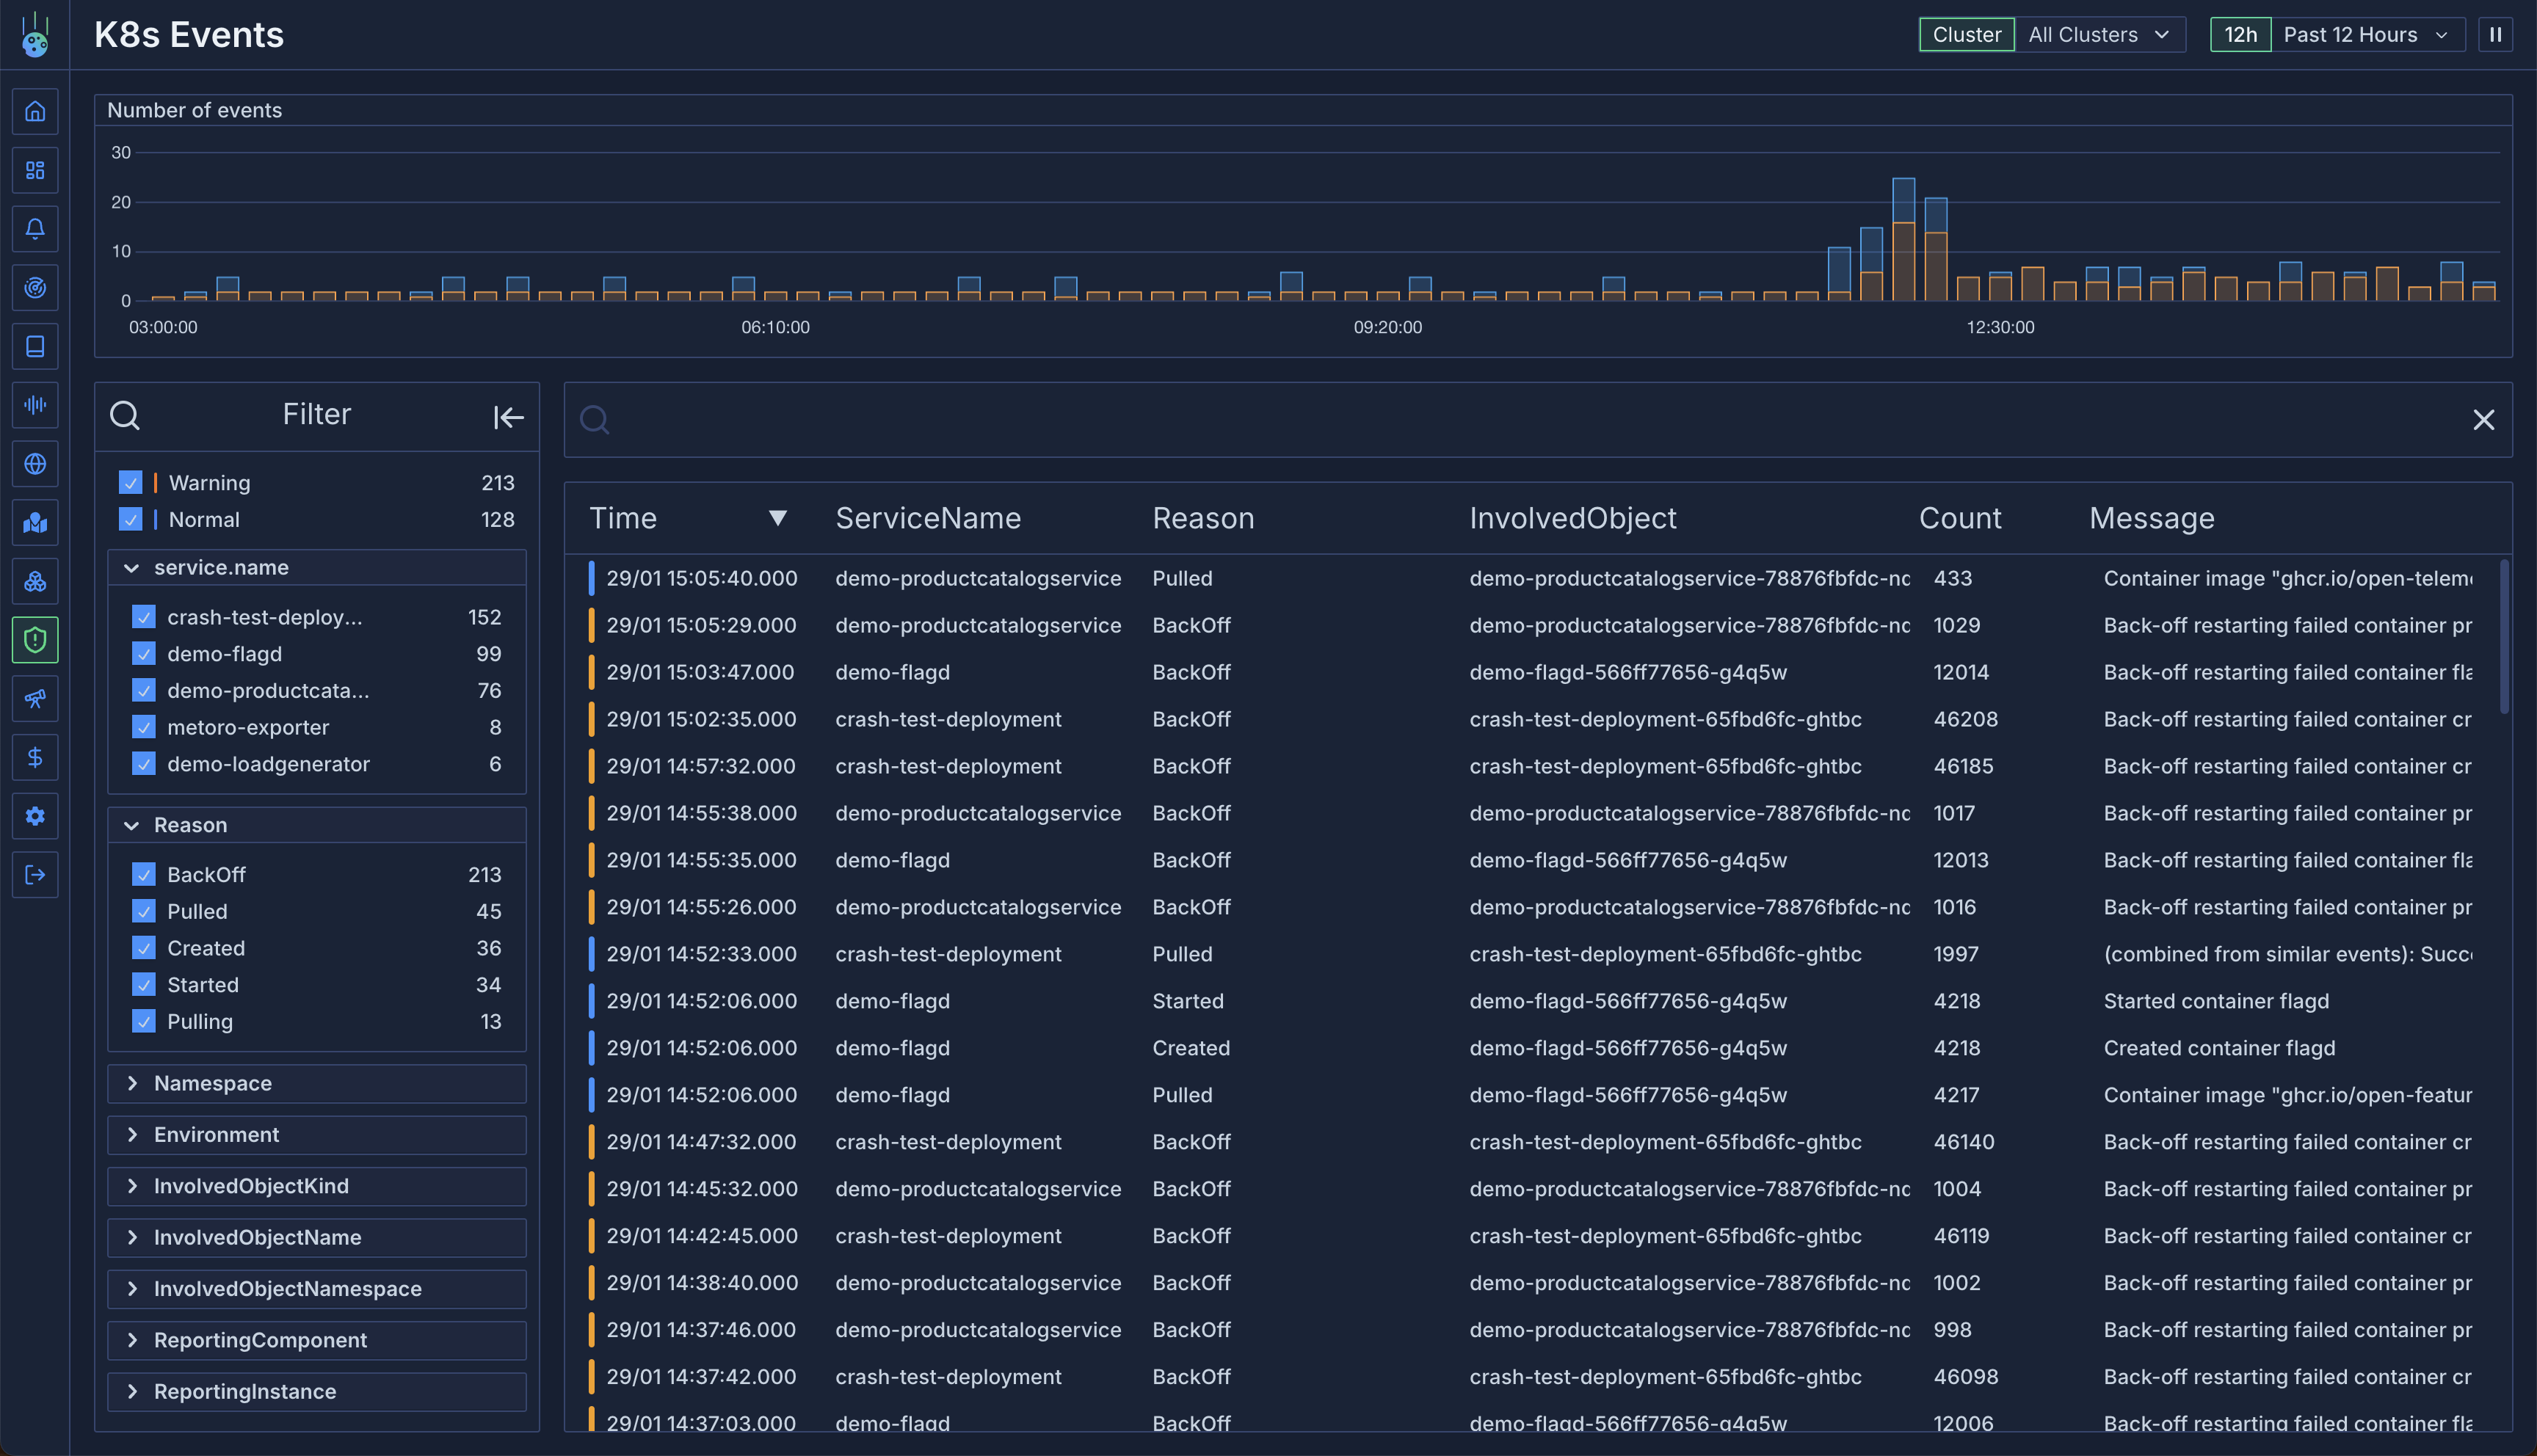
Global Events View
Access the dedicated Kubernetes events view to:- See events across all clusters
- Filter by any event attribute
- Search event messages using regex
- Track event frequency and patterns
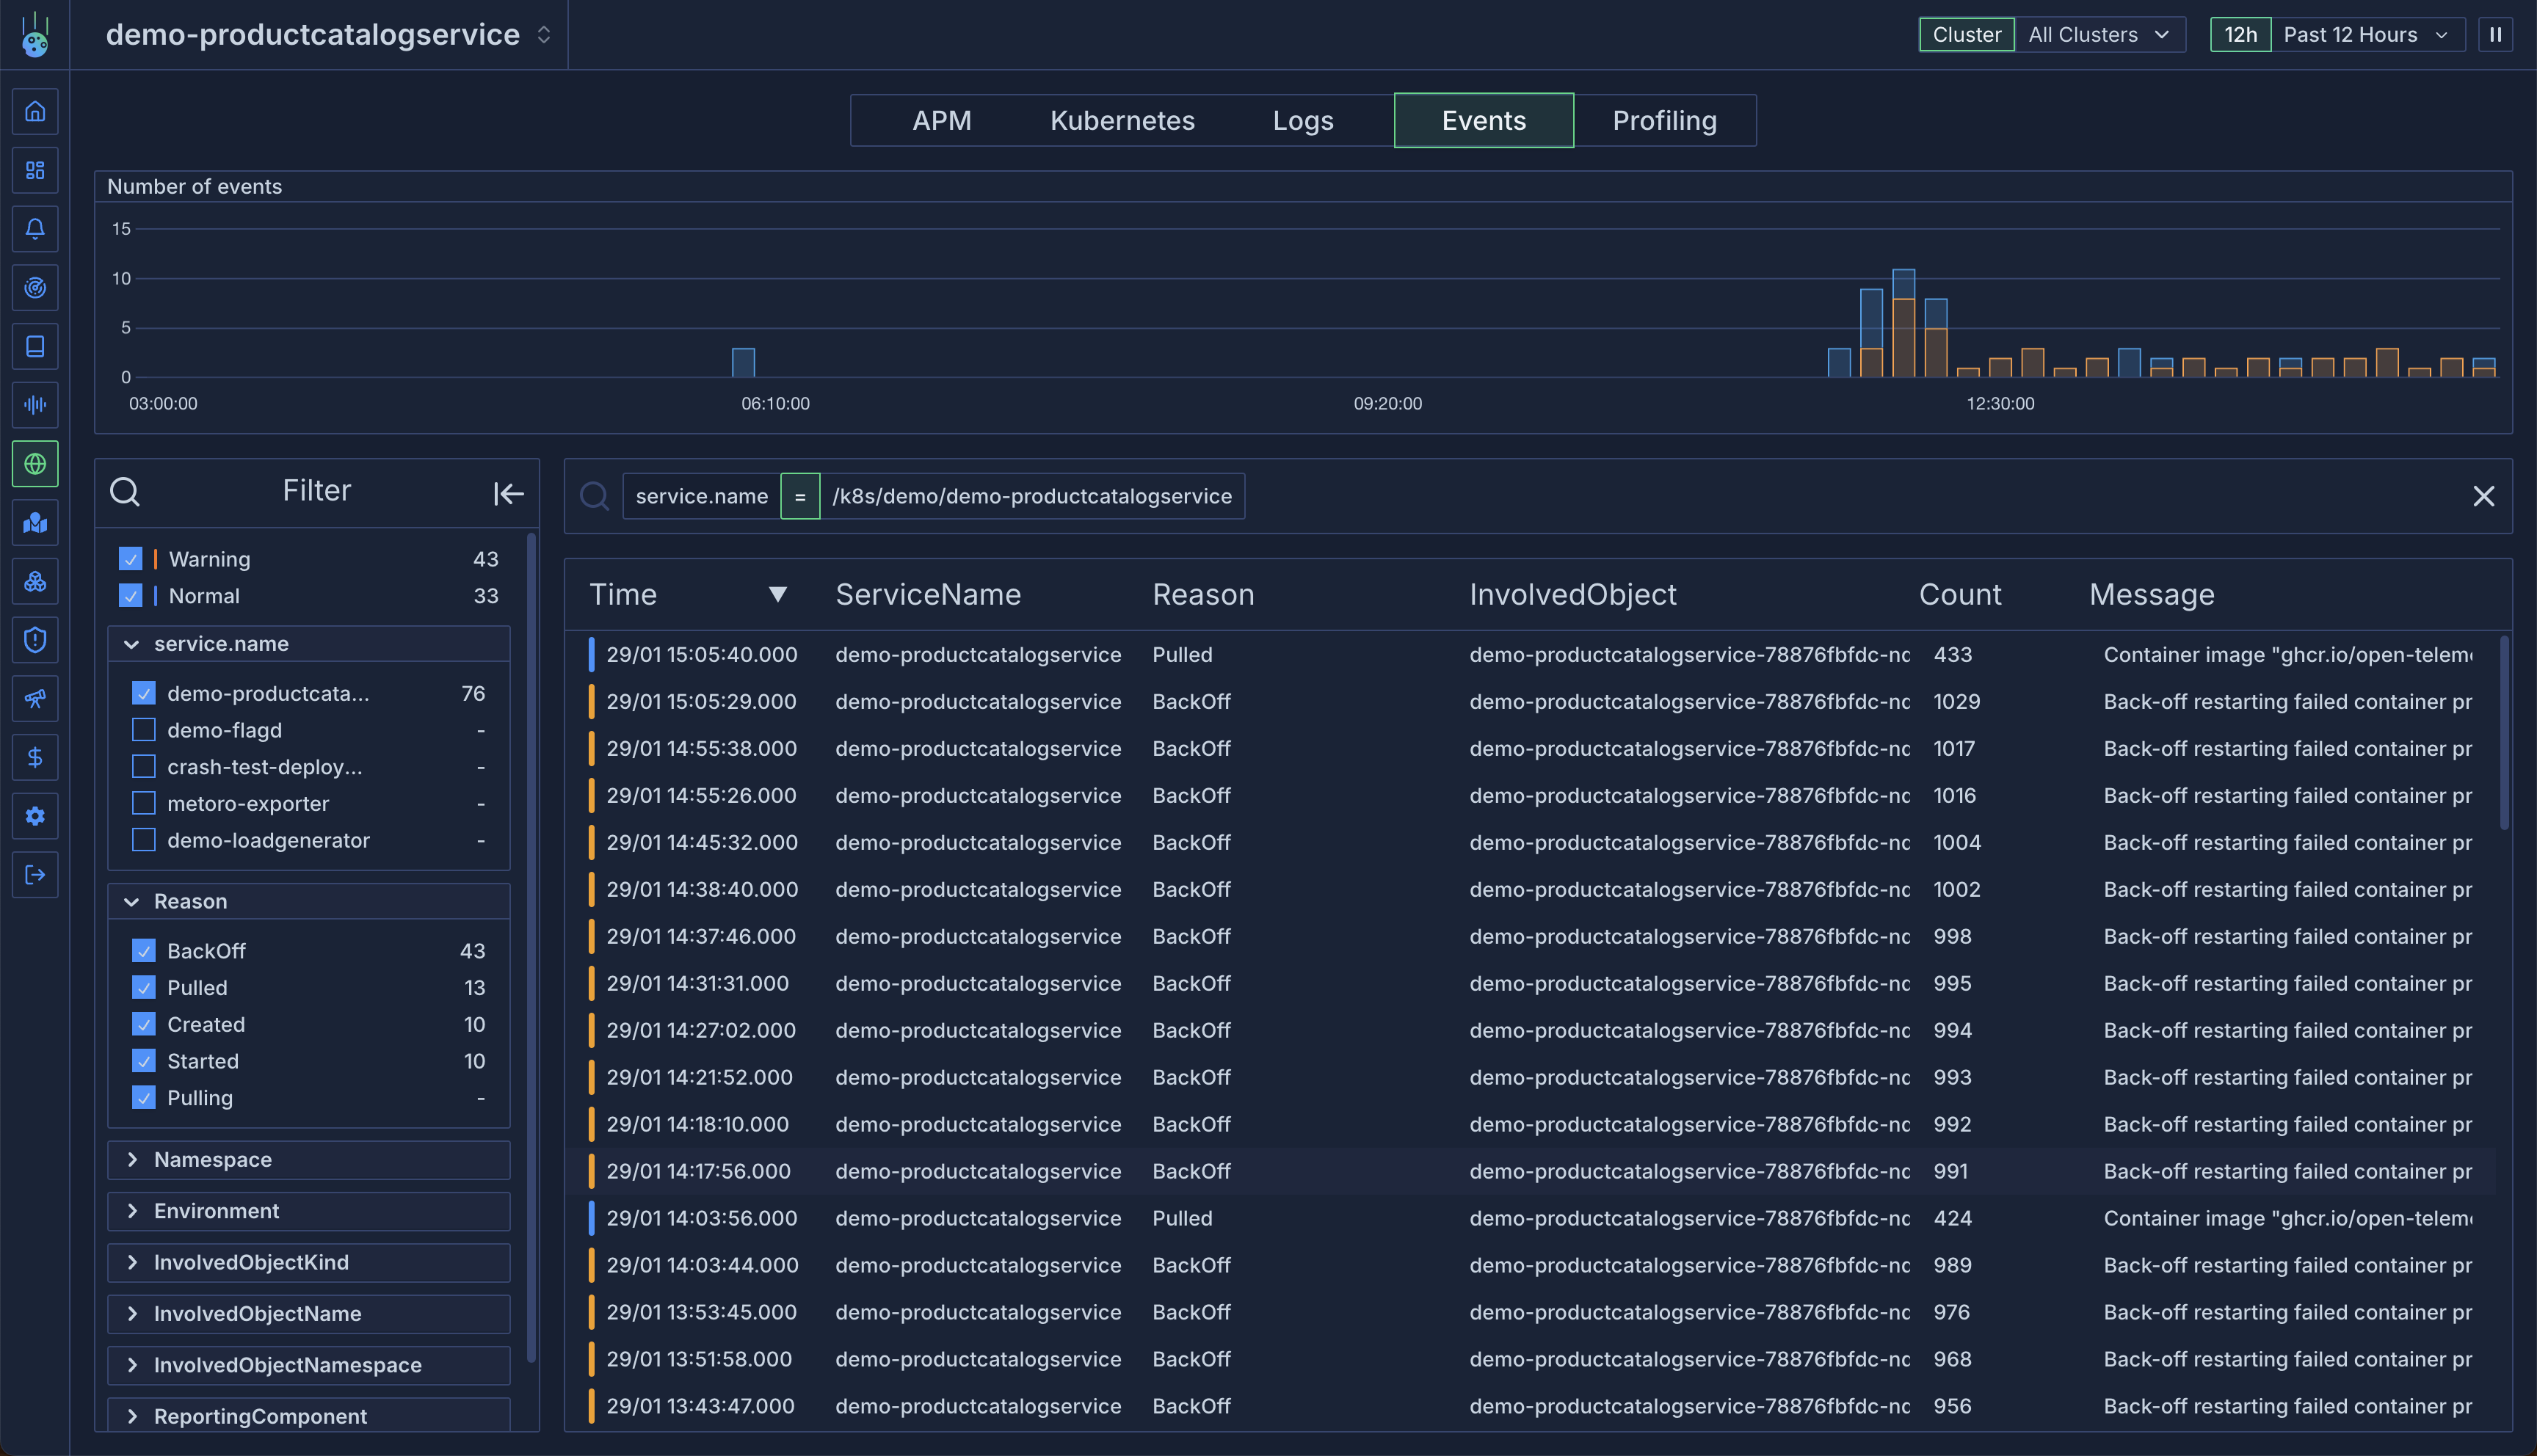
Service-Specific Events
View events for specific services:- Navigate to a service
- Open the Events tab
- View all events associated with the service
Filtering and Search
Attribute Filtering
Filter events by any attribute:- Event type (Warning/Informational)
- Service name
- Namespace
- Resource kind
- Reporting component
Message Search
Use regex search to find specific events:Best Practices
- Regular Monitoring:
- Review warning events daily
- Track event patterns across services
- Monitor high-frequency events
- Troubleshooting:
- Use service association to correlate events
- Combine event data with logs and metrics
- Track event history for recurring issues
- Filtering Strategy:
- Create saved filters for common scenarios
- Use regex for complex pattern matching
- Filter by service for targeted analysis