
Group Widget
The group widget is used to group related widgets together. It is useful for organizing charts and other widgets. Widgets that are grouped can be moved together as a single entity.Chart Widget
The chart widget is used to display any sort of data. After you add a chart widget you can configure it through the Chart Builder.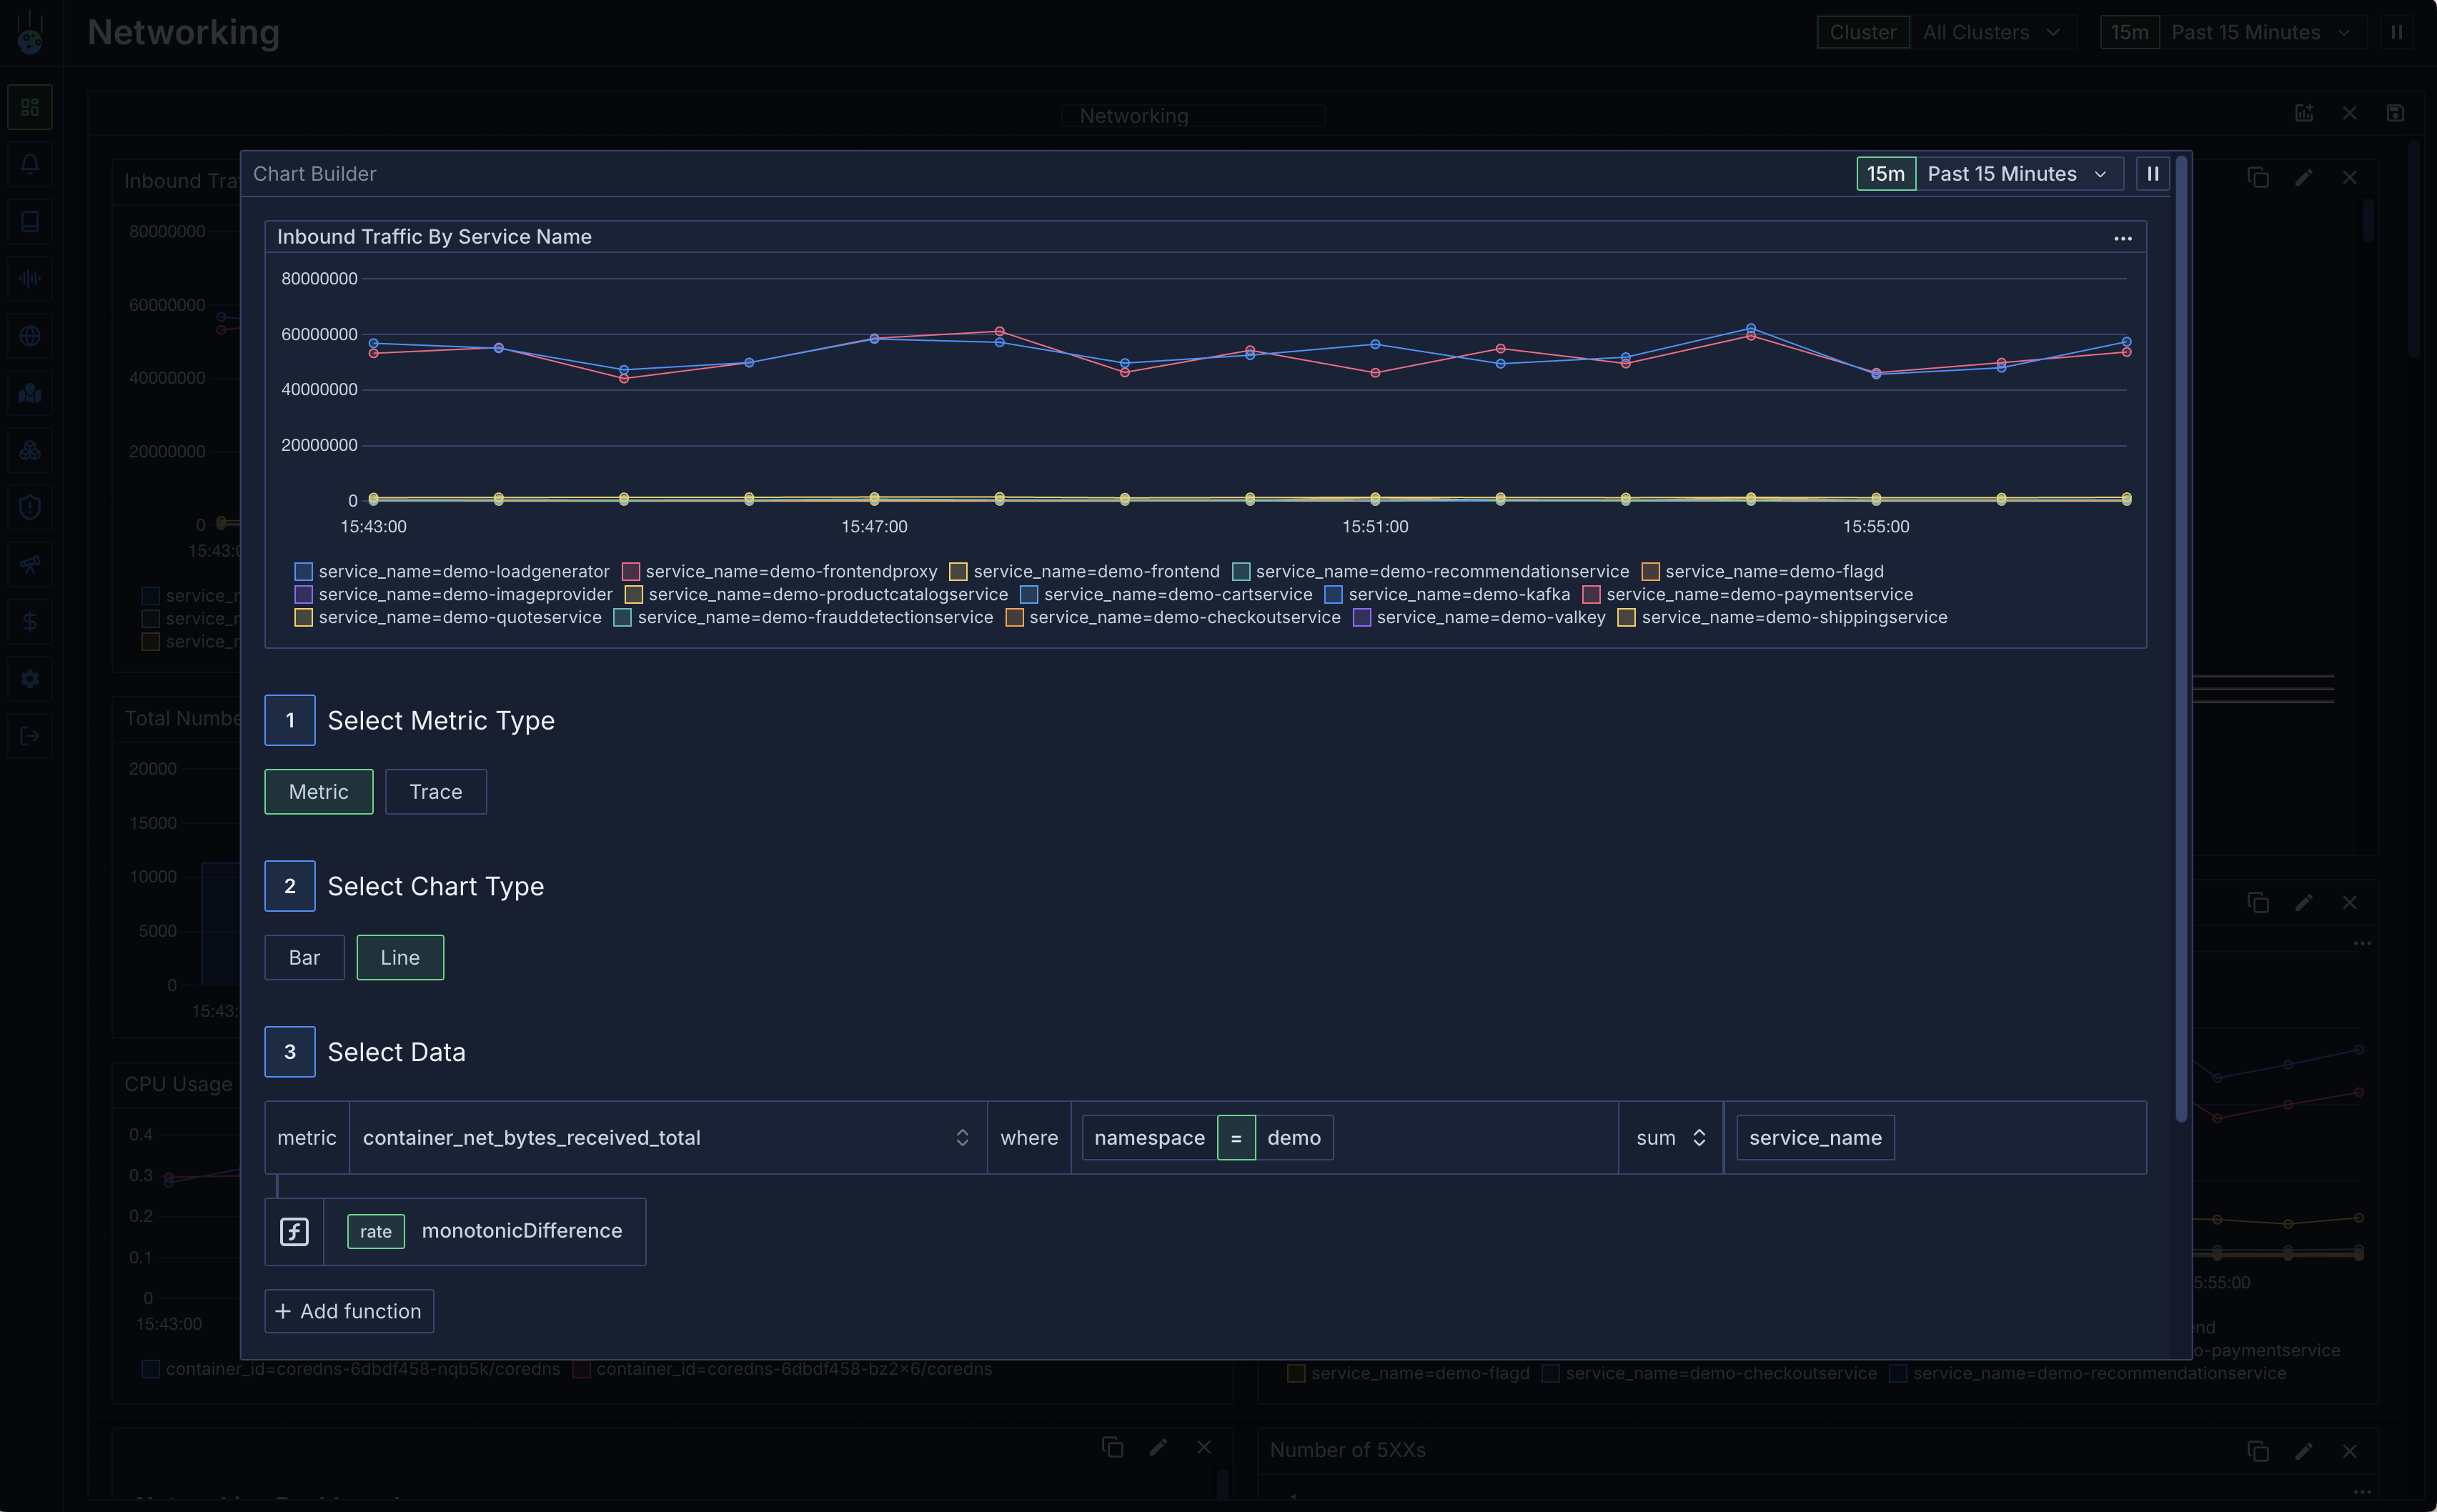
- The metric type. This is the underlying data that will be queried. It is either metric or trace
- The chart type. This defines the visualisation. Either a bar or line chart.
- The metric name. This is the name of the metric that will be displayed. This is only relevant for metric charts.
-
Filters. Filters consist of a number of key value pairs. This will restrict the queried data to only data points matching the filters. Each filter is ANDed with every other filter. Individual filters can be ORed together by inserting
||between each value. -
Aggregation. This is the operation to apply to the data. For example, if you want to sum the data you would select
sum. The available aggregations for metrics are:sumavgminmax
countrequest sizeresponse sizetotal sizep50 latencyp90 latencyp95 latencyp99 latency
- Groups. This is a list of keys that will be used to group the data.
-
Functions. Functions are mathematical operations that can be applied to the data. For example, if you want to calculate the monotonic difference of the data you would select
monotonic_diff. The available functions are:monotonic_diff- The difference between the current value and the previous value in the timeseries. If the difference is negative, it will be clamped at 0.value_diff- The difference between the current value and the previous value in the timeseries.custom_math_expression- An arbitrary math expression applied to the time series. The timeseries is passed as the parameterato the expression. For example, if you want to divide the data by 2 you would selecta / 2.
Value Widgets (Stat, Table, Gauge, Bar Gauge, Pie Chart)
Value widgets display reduced metric query results as single values, tables, gauges, bars, or pie slices. Each of these widgets supports display options in its builder, including:- Precision - the number of decimal places shown for numeric values.
- Unit Override - display values using a specific unit instead of the unit reported by the metric.
- Show Raw Values - by default, values are abbreviated for readability (e.g.
36.2k,36.2 s). Turning this on shows the full unabbreviated value with thousands separators in its original unit (e.g.36,200or36,200 ms). This is useful for exact counts where rounding loses important detail. When left off, hovering over a stat value or table cell shows the exact value in a tooltip.