Variable Components
A variable is made up of these components:- Name - The name of the variable which will be referenced when applying the filter.
- Possible Values - Suggested values for the variable. This is all the values of a particular tag for traces or metrics.
- Default Value - The default value of the variable. This is the value that will be applied when the variable is not edited by the user.
If the value is
*then it is for all values of the key. - Overridable - Whether a user can edit the value of the variable inside the dashboard for their session.
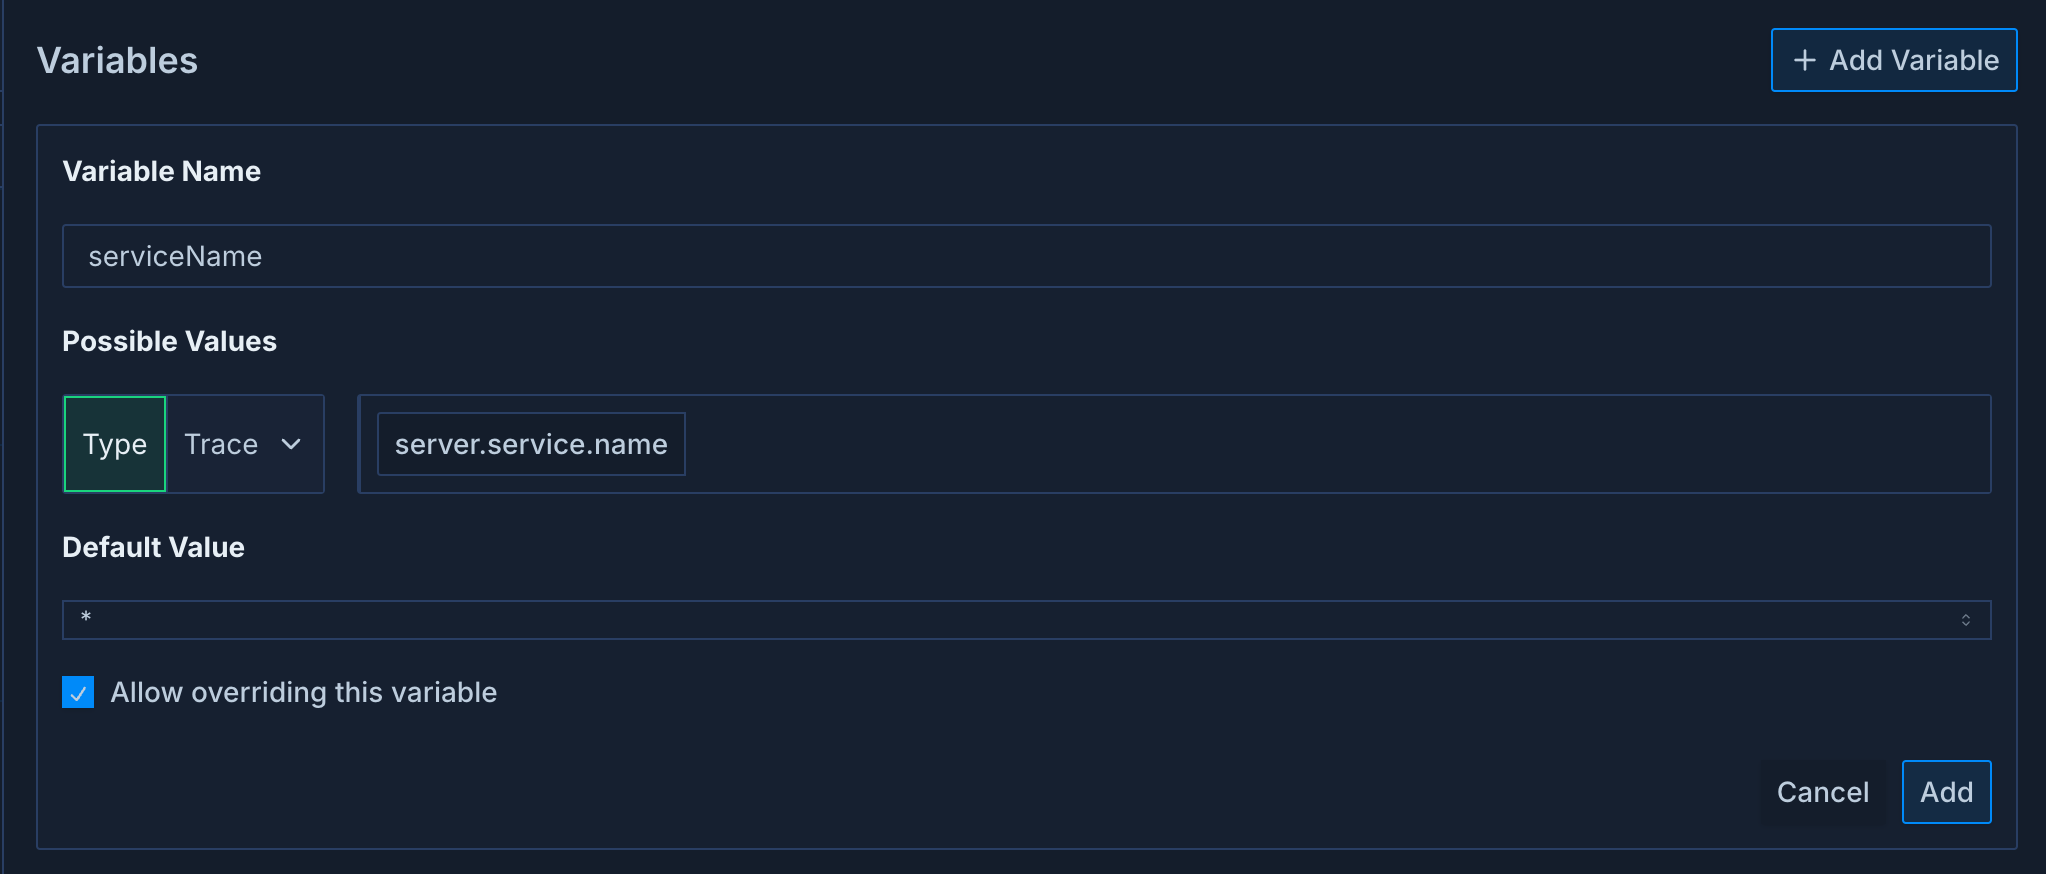
serviceName and a default value of * which means all service names. The possible values are the unique values of the serviceName tag for traces.
Creating Variables
You can create a variable by clicking the variable icon on any group widget in edit mode.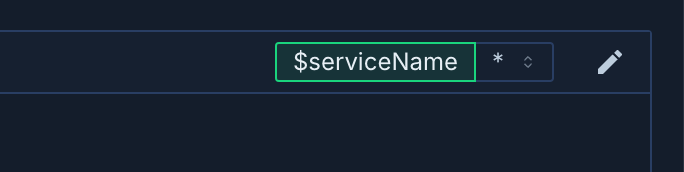
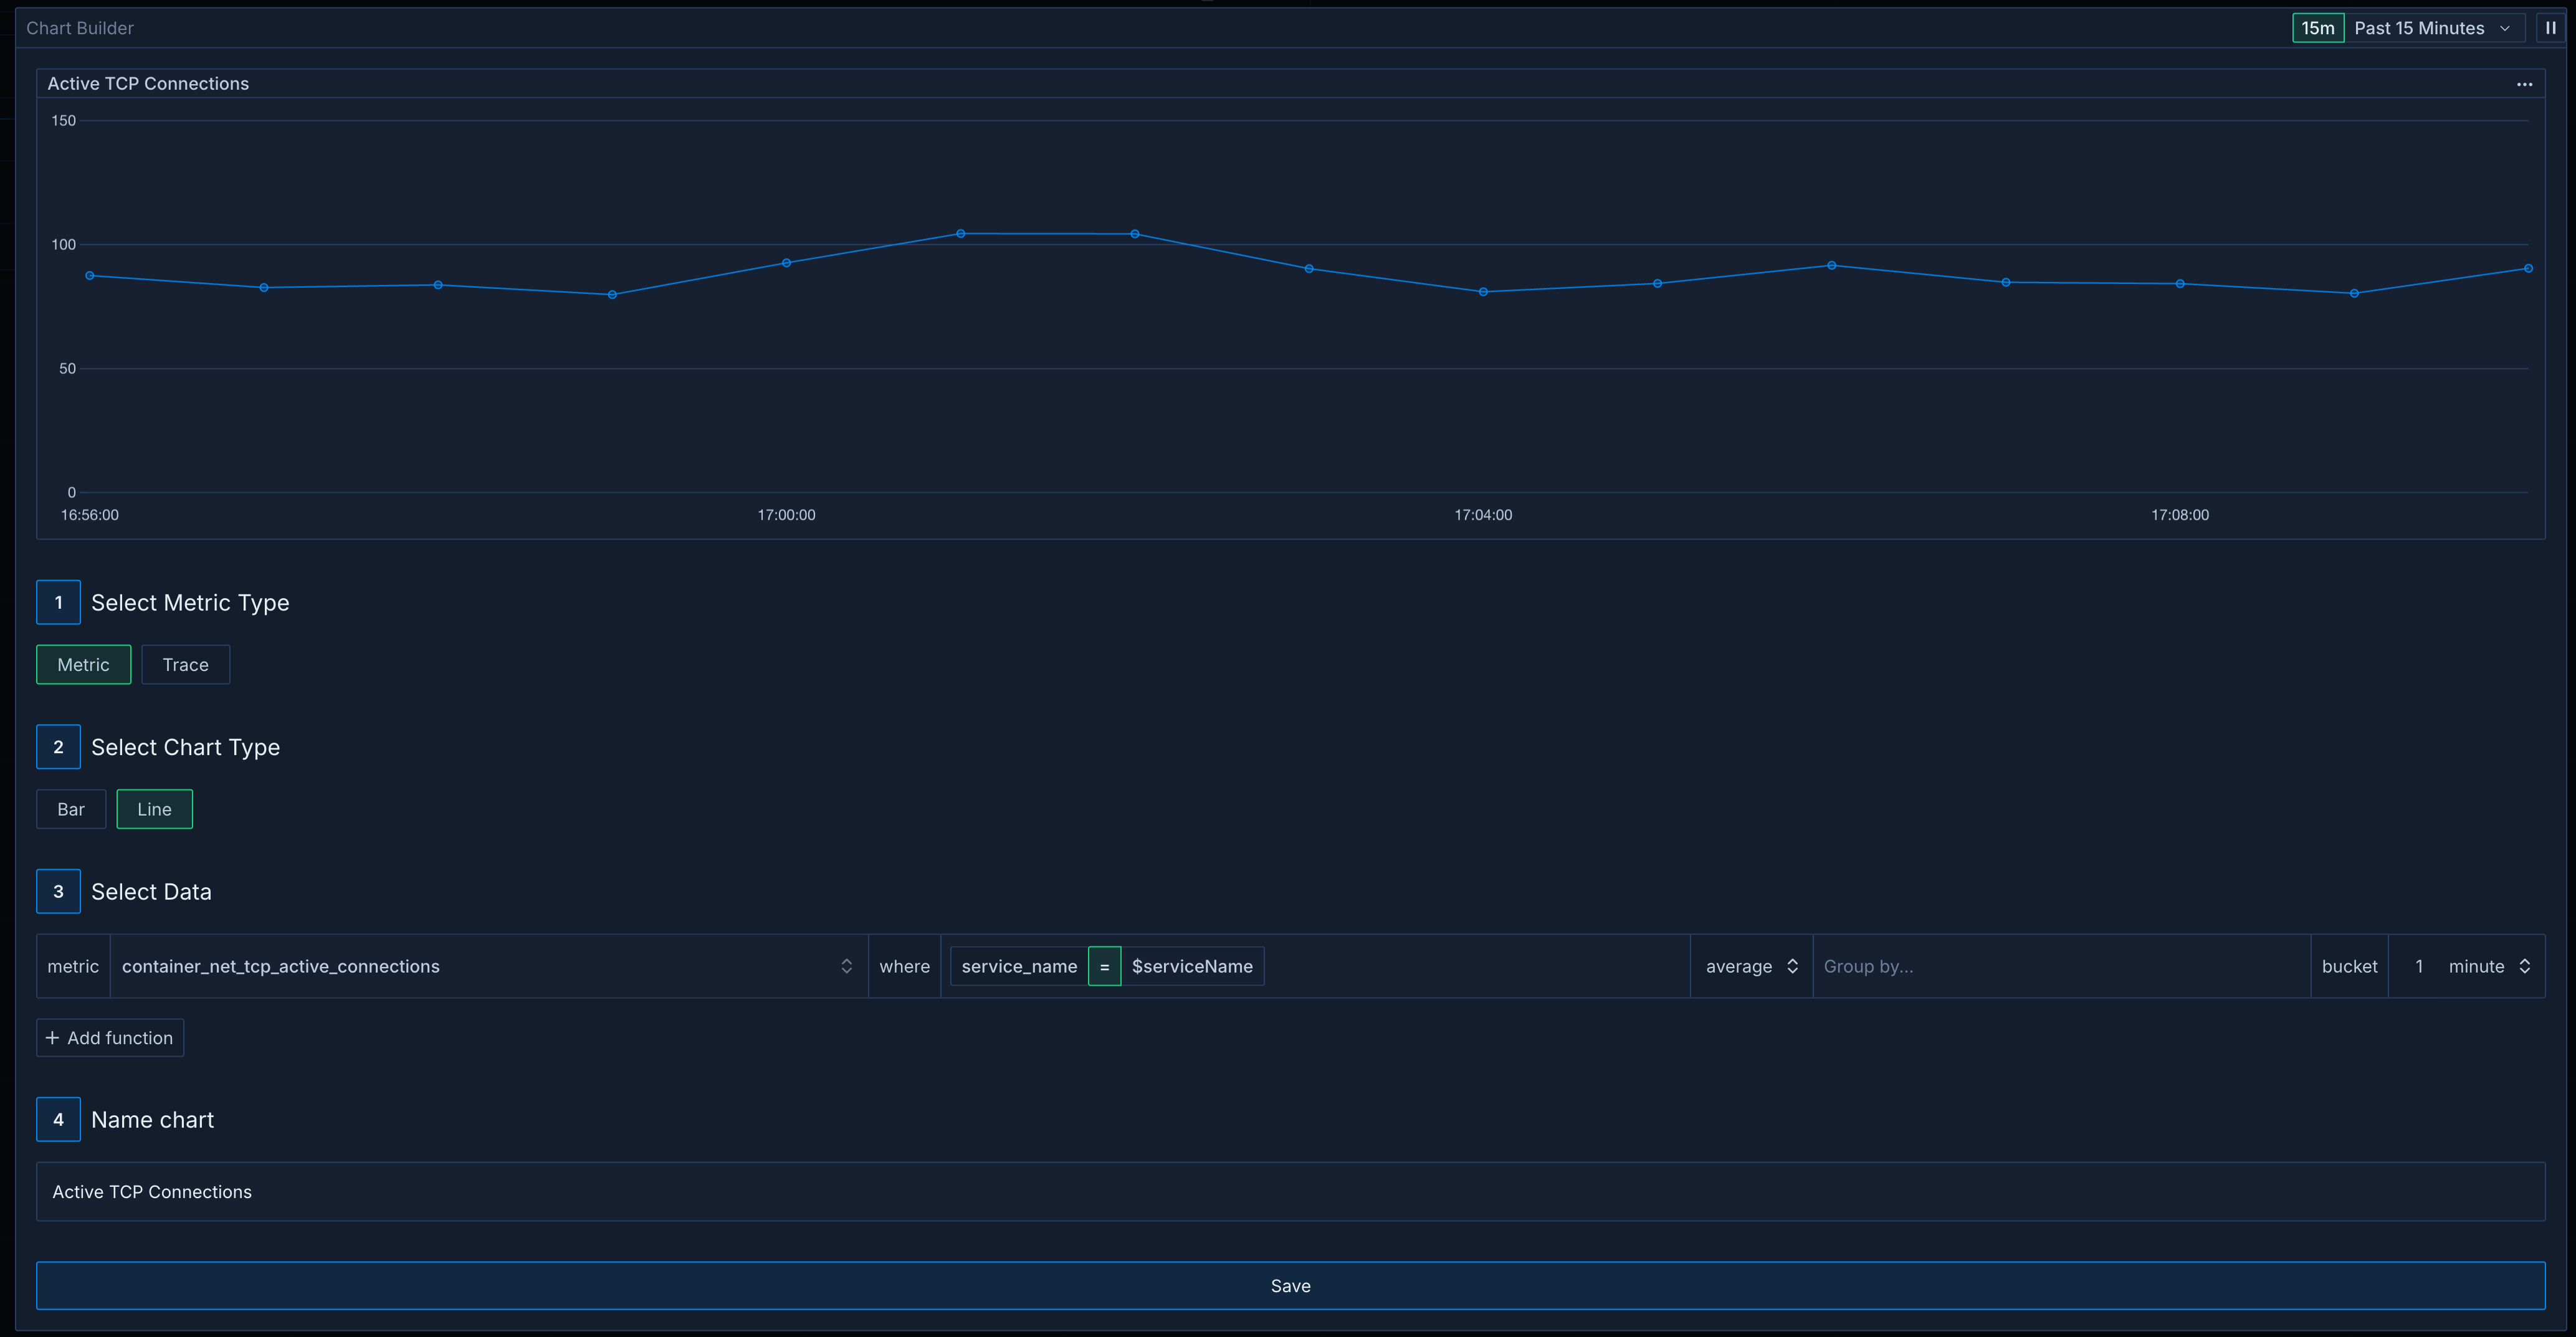
Using Variables
After you have created a variable you can use it in the filters of any chart that is nested below that group. In the chart editor you can set any filter equal to the variable value.