
What are CPU profiles?
A CPU profile is simply a list of stack traces and time spent at each stack trace. Metoro aggregates these lists together to show you exactly which function your program is spending time in.Why are CPU profiles useful?
A CPU profile allows you to understand where that time is being spent down to the function level. This means that you can investigate performance issues much more easily than by just observing that the program is using a lot of CPU, you can see where that CPU time is being spent. In practice profiling is mainly used to understand performance regressions after something has changed: new code releases, a change in usage patterns or a new environment.Where can you view CPU profiles in Metoro?
You can view CPU profiles for each service in its respective service page under the Profiling tab. This view provides an aggregated view of all profiles taken across all pods associated with the service in the time period you have selected. You can filter by the specific container in the pod or by the cluster that the service is in.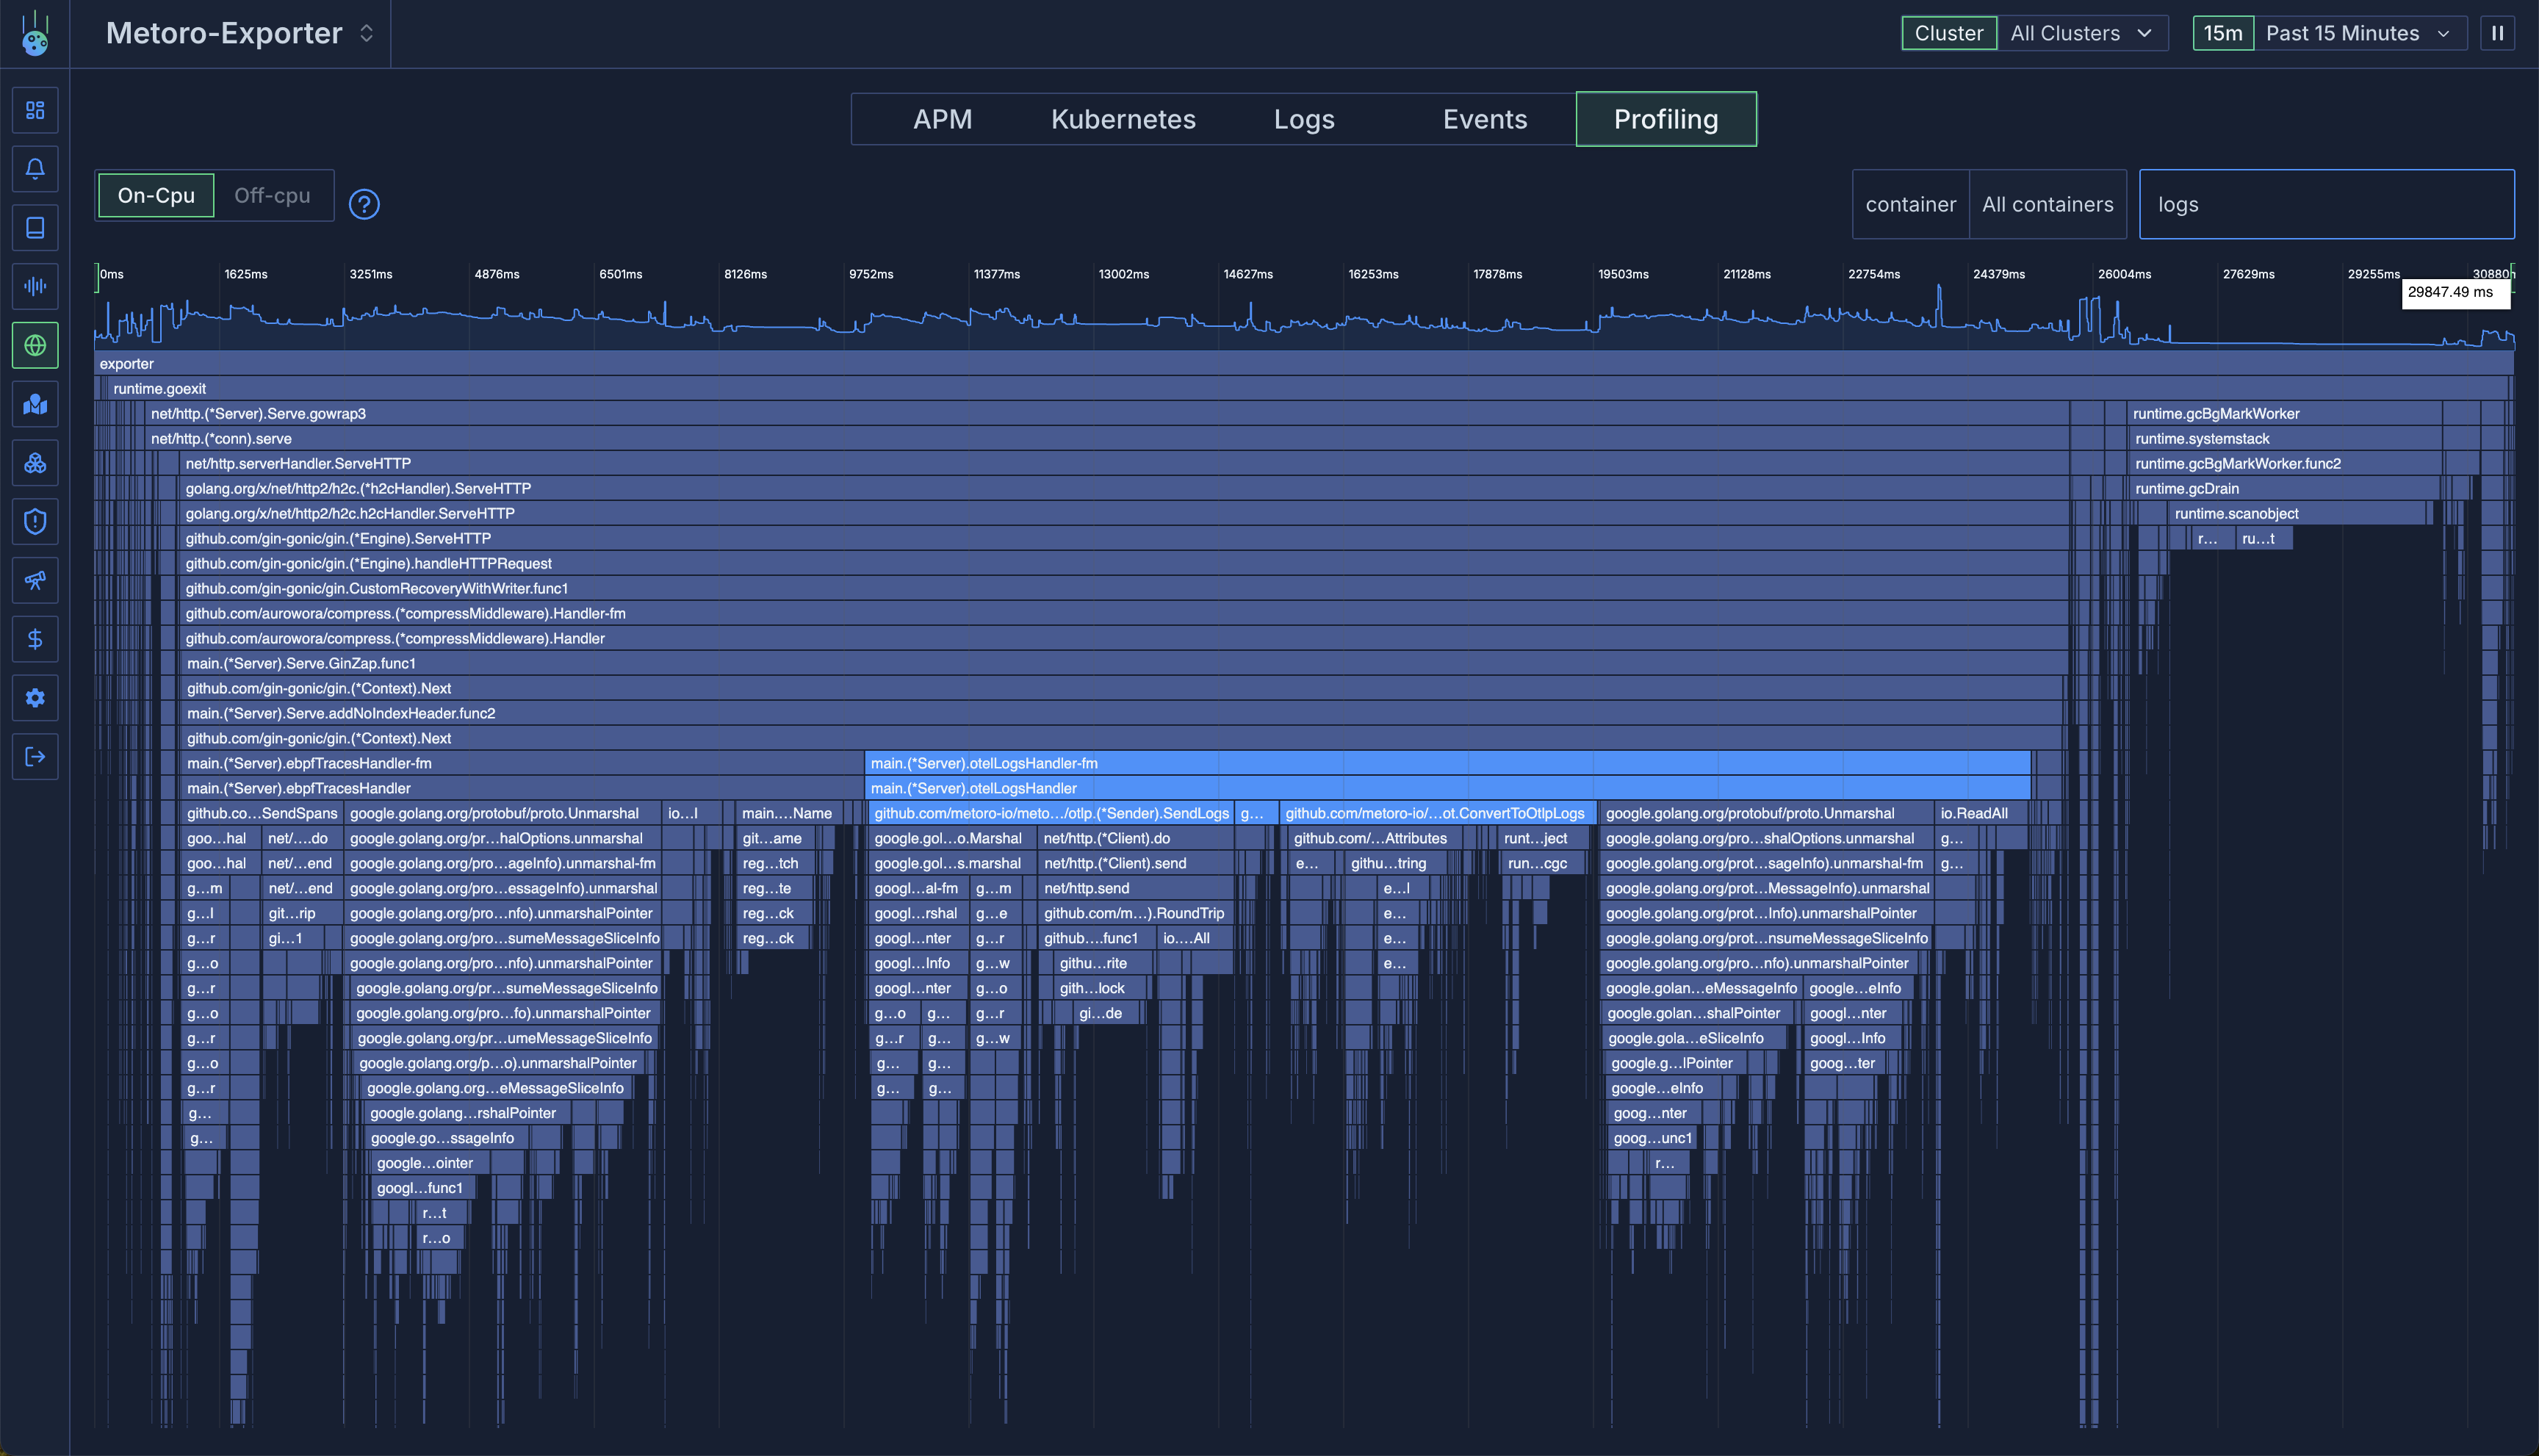
How does Metoro collect CPU profiles?
Metoro runs a sampling profiler to understand exactly which container is running on each CPU on a host. The sampler runs at 97Hz to get the stack traces of any program which is currently on the CPU.Profiling overhead
Running the sampling profiler has a small overhead of typically < 0.5% of total CPU usage.Supported languages
CPU profiling currently supports:- C
- C++
- Rust
- Golang
- Python