Metoro generally defined things in terms of Kubernetes constructs. If you are familiar with Kubernetes, you should be able to understand the majority of what Metoro is showing you.

The one exception to that is the concept of services.

Services

Services are the core abstraction in Metoro. They are the entities that represent the persistent components of your microservice application and are the main way you will interact with the data in Metoro. Services are automatically detected by Metoro and do not require any configuration from you.

How does Metoro detect a service?

Metoro makes a service out of each of the following Kubernetes resources:

  • Deployments
  • StatefulSets
  • DaemonSets
  • ReplicaSets

For example if we have the following architecture in our Kubernetes cluster:

Metoro will automatically detect 2 services:

  • Currency
  • Checkout

All of the data around the underlying pods, containers, and the Kubernetes resources themselves are associated with the service they belong to and will be tracked over time by Metoro.

Metoro extracts APM, traces, logs, metrics and profiling data from the pods and containers associated with the service and associates them with the service as well as tracking changes to the kubernetes metadata.

This allows you do do things like see if a new deployment caused a spike in errors or if a new pod is causing a memory leak.

How do you interact with services?

Service Catalog

The best place to get started with services is at the service catalog page. Check it out here.

The service catalog page shows you all the services that Metoro has detected in your cluster and allows you to drill down into each service to see the data associated with it.
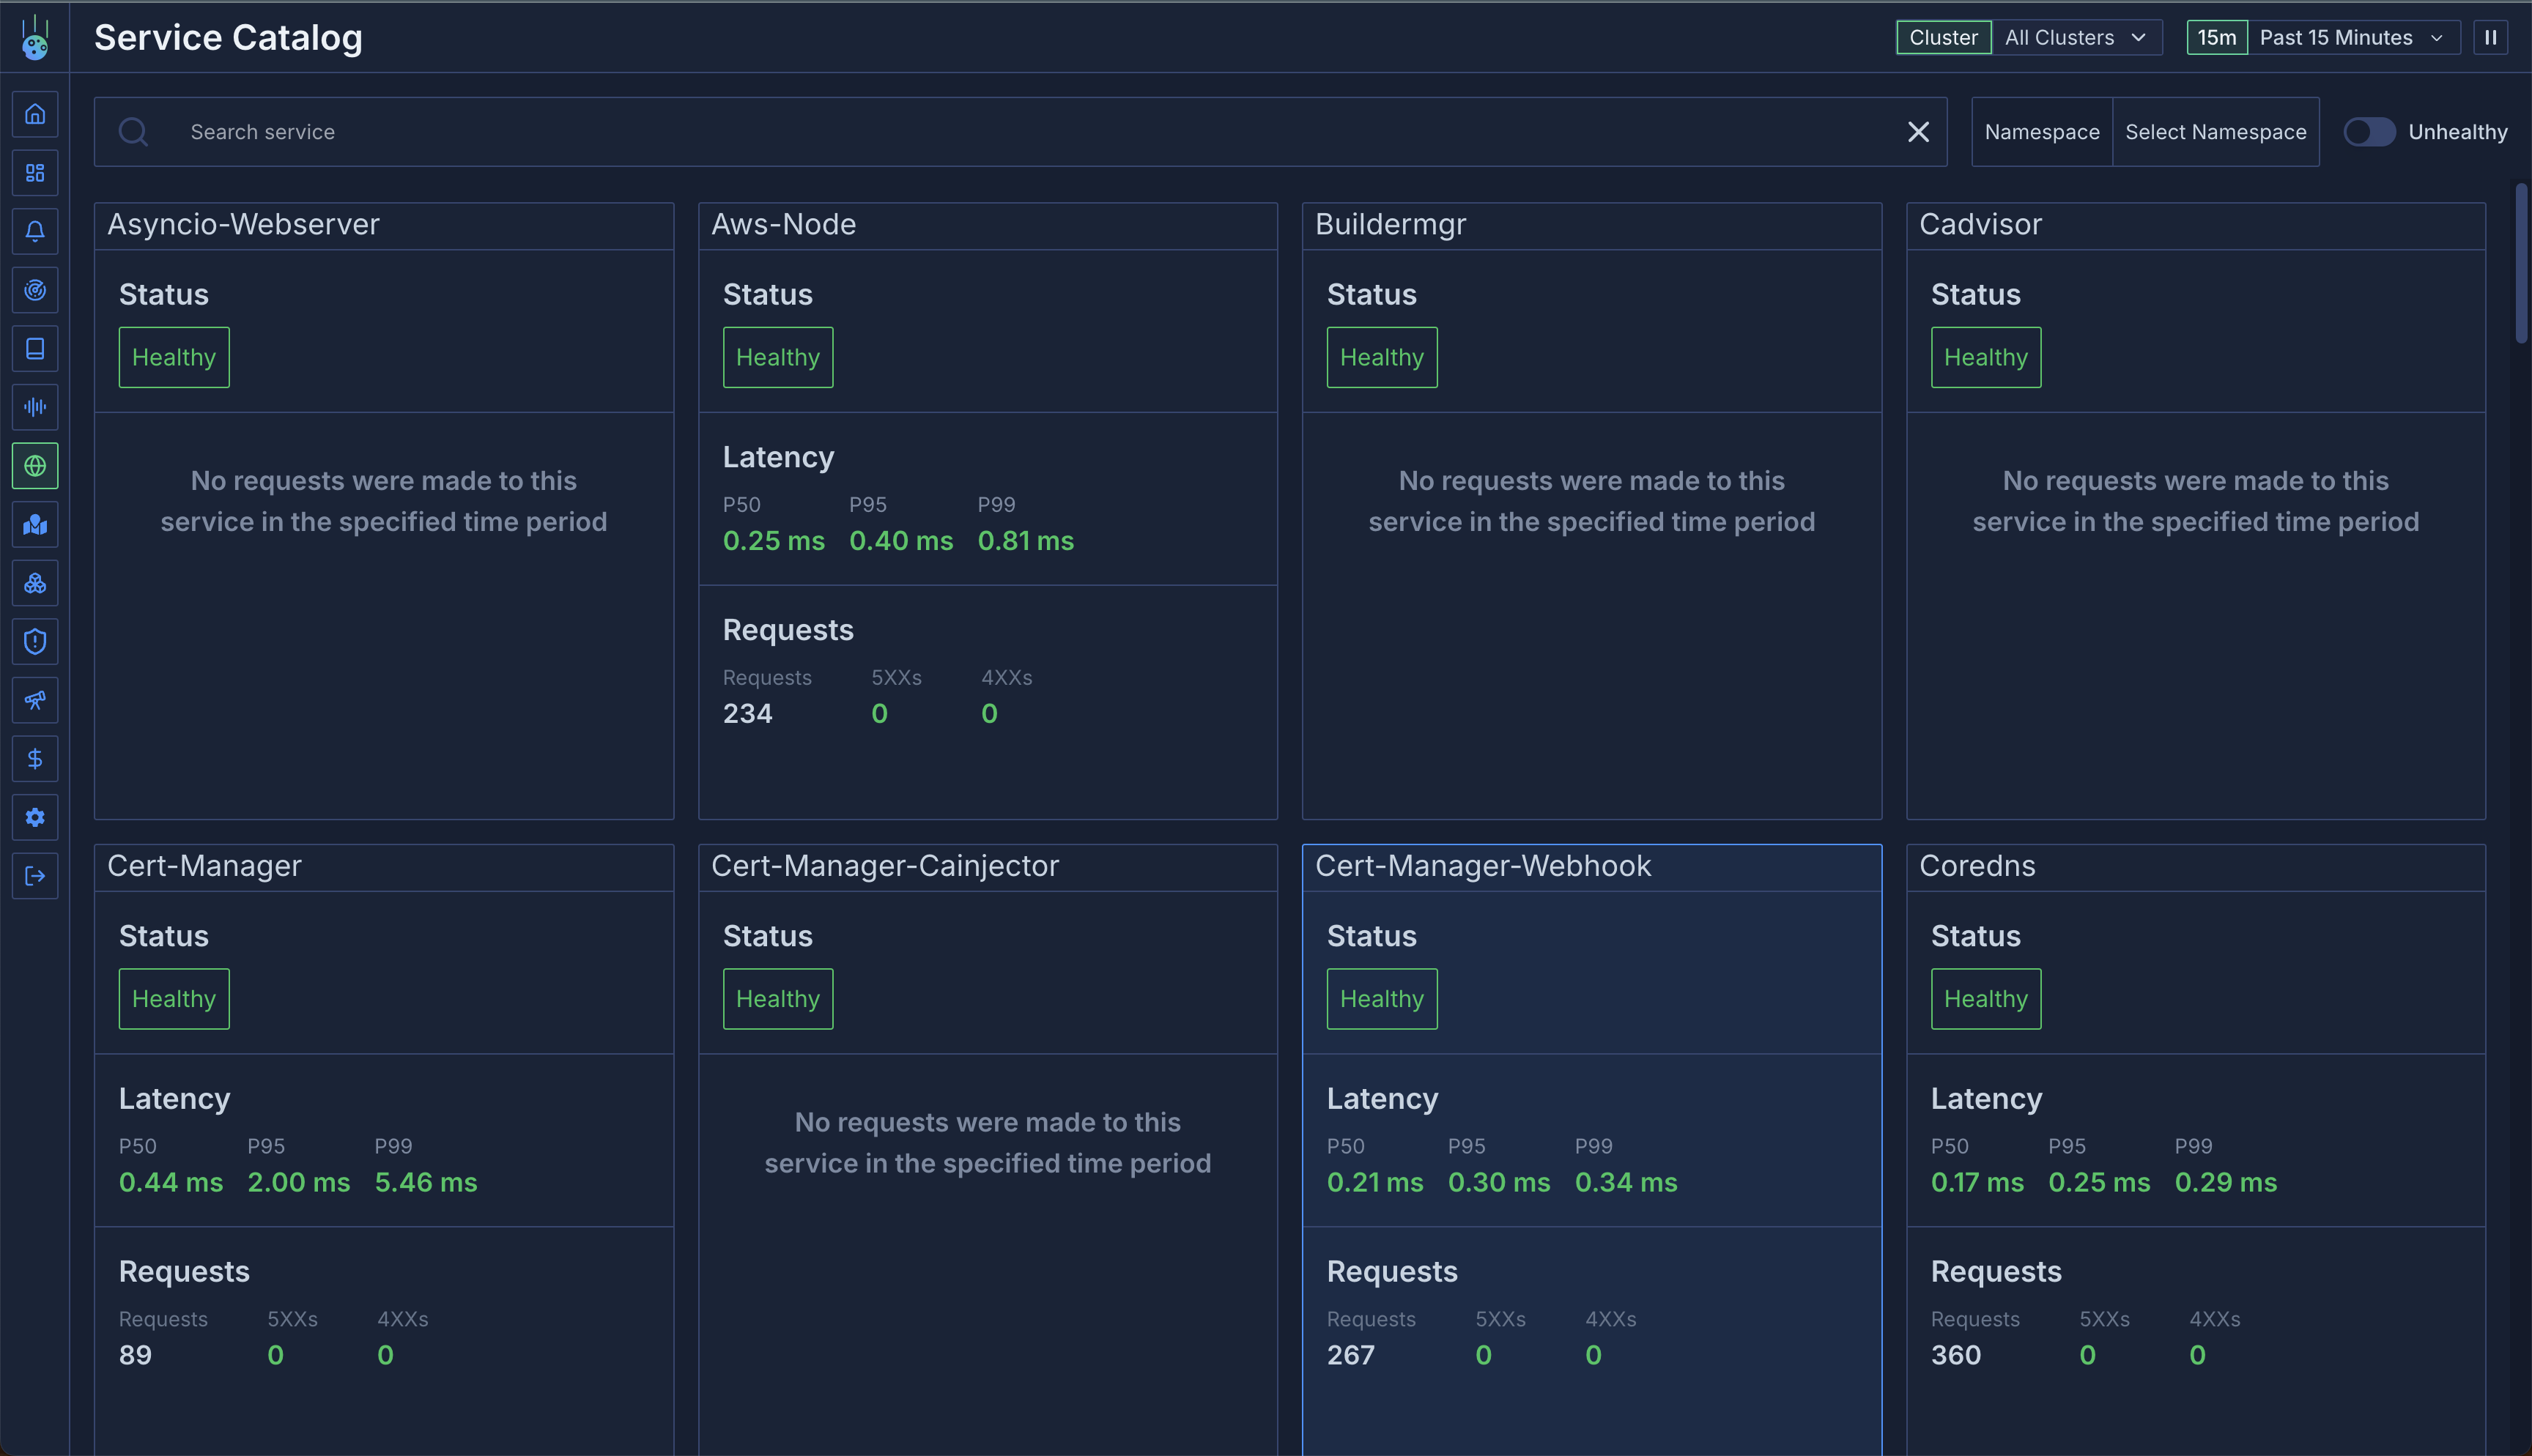
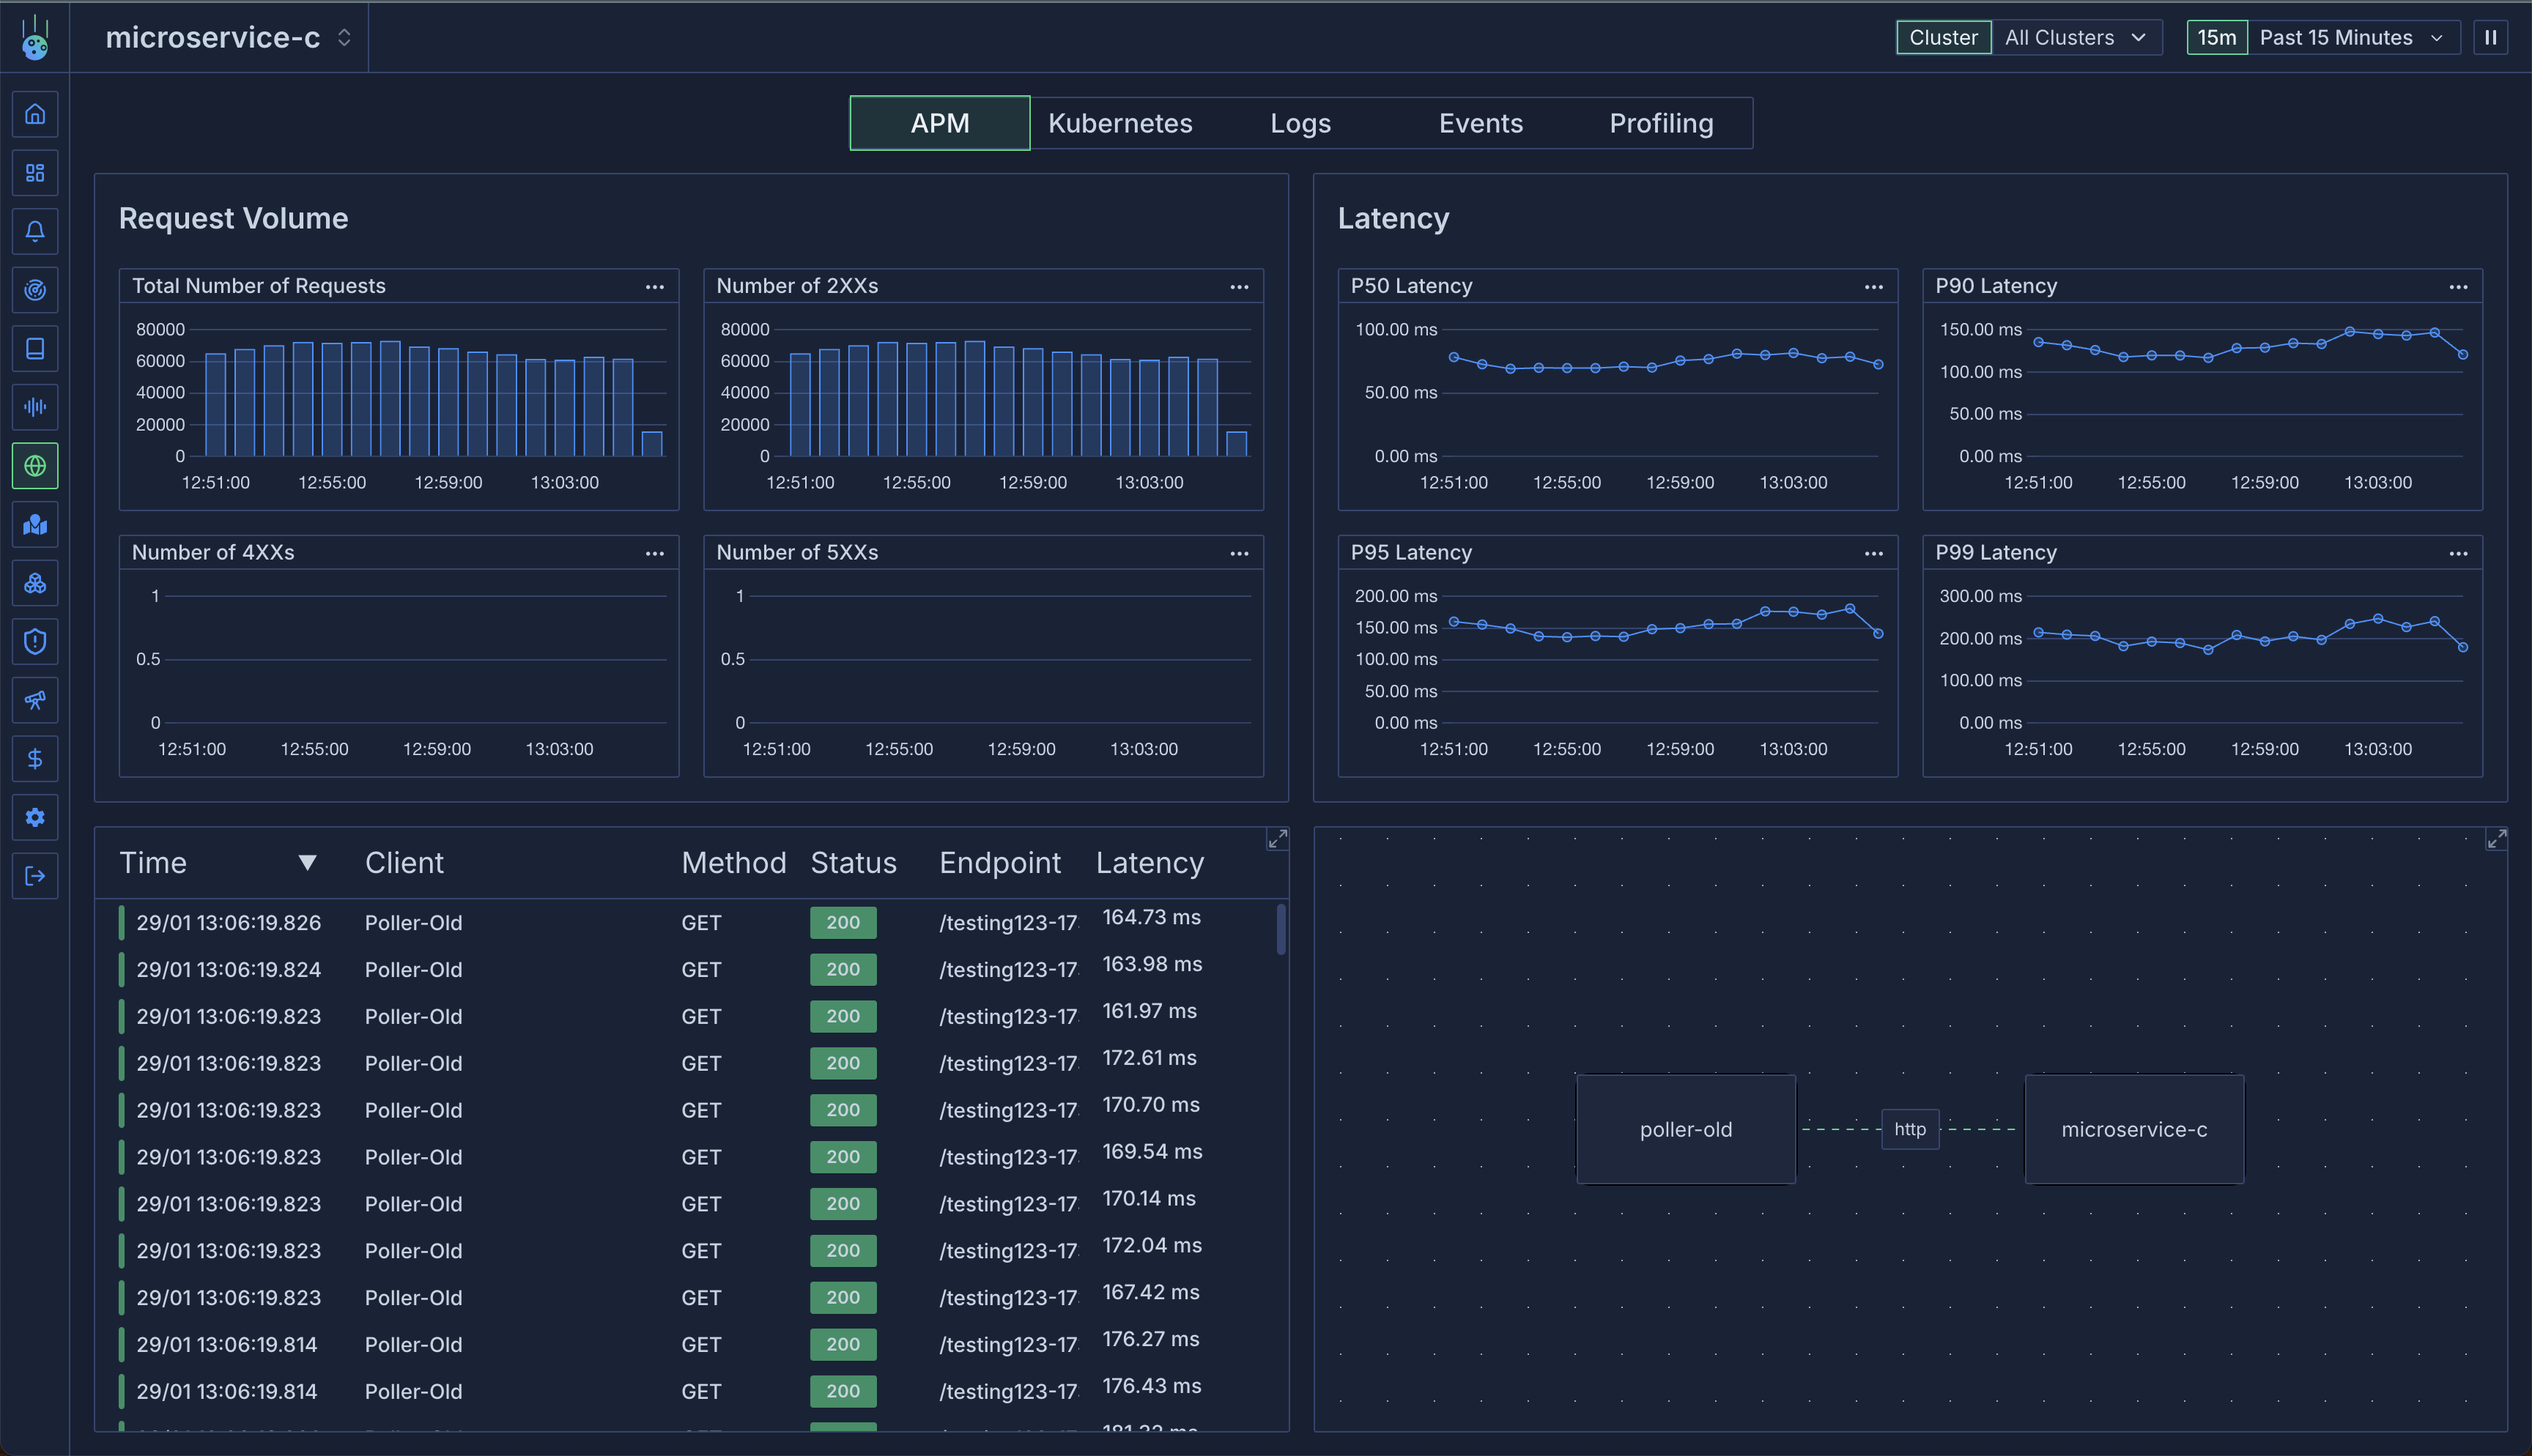
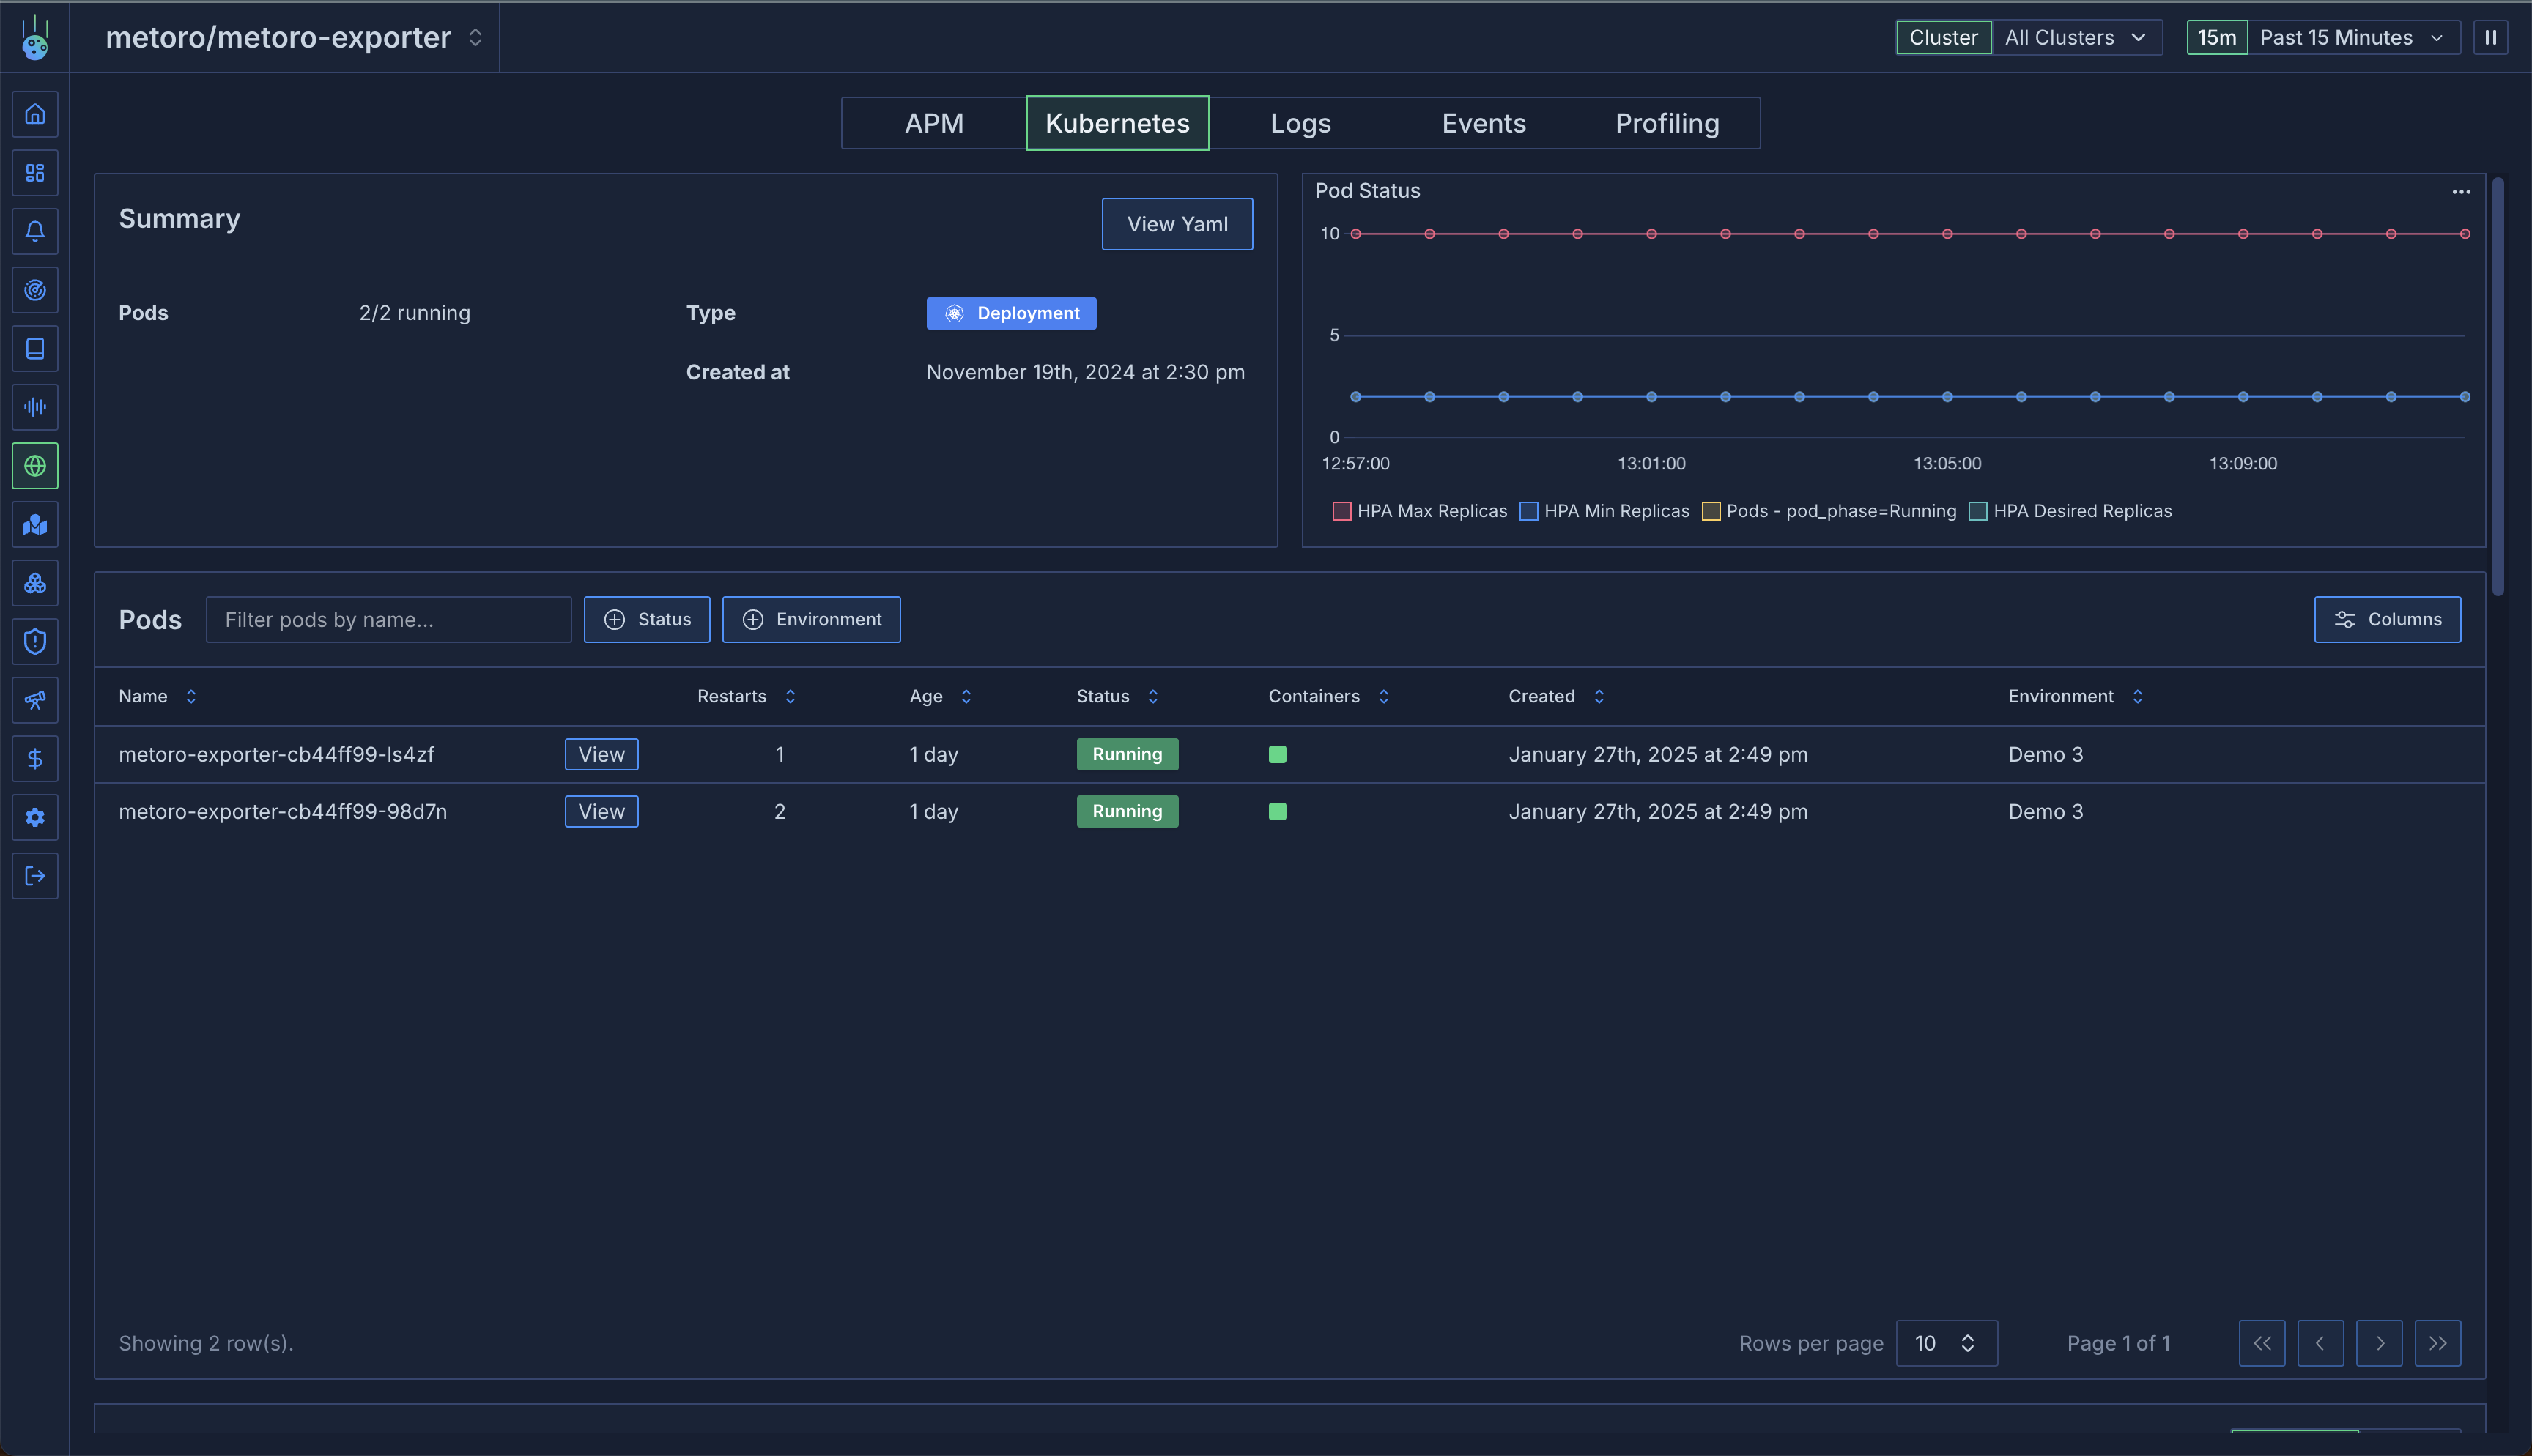
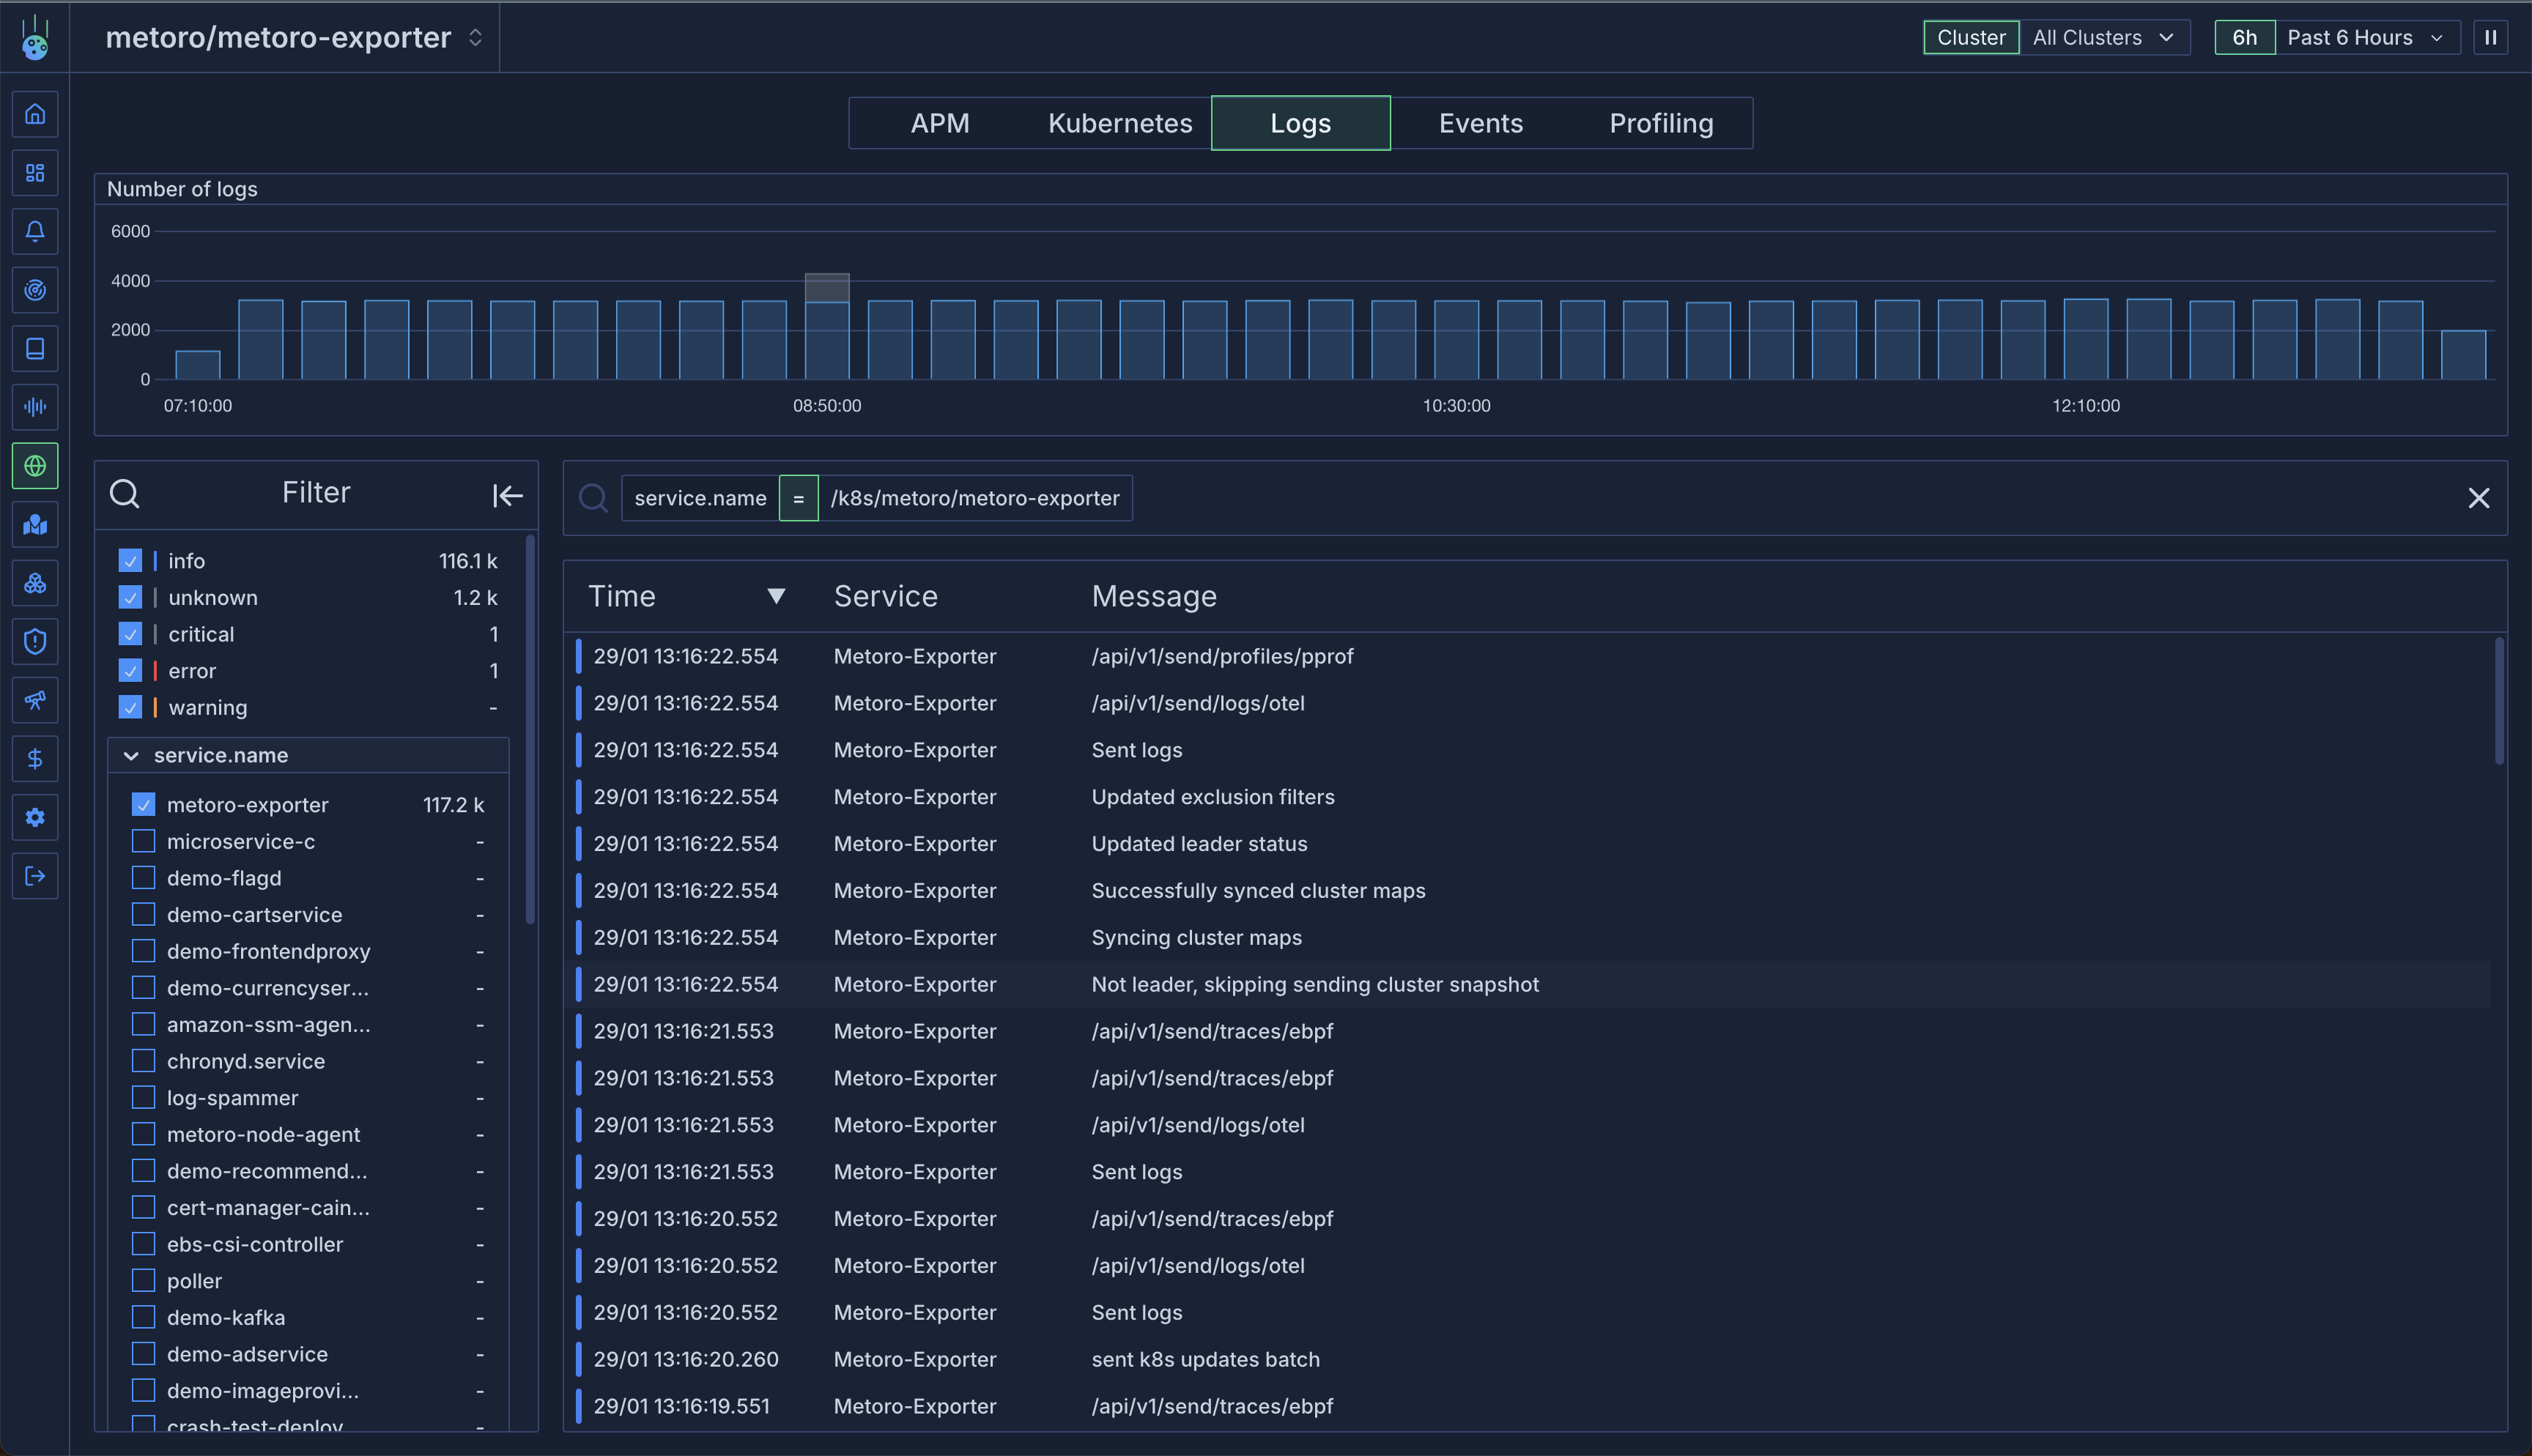
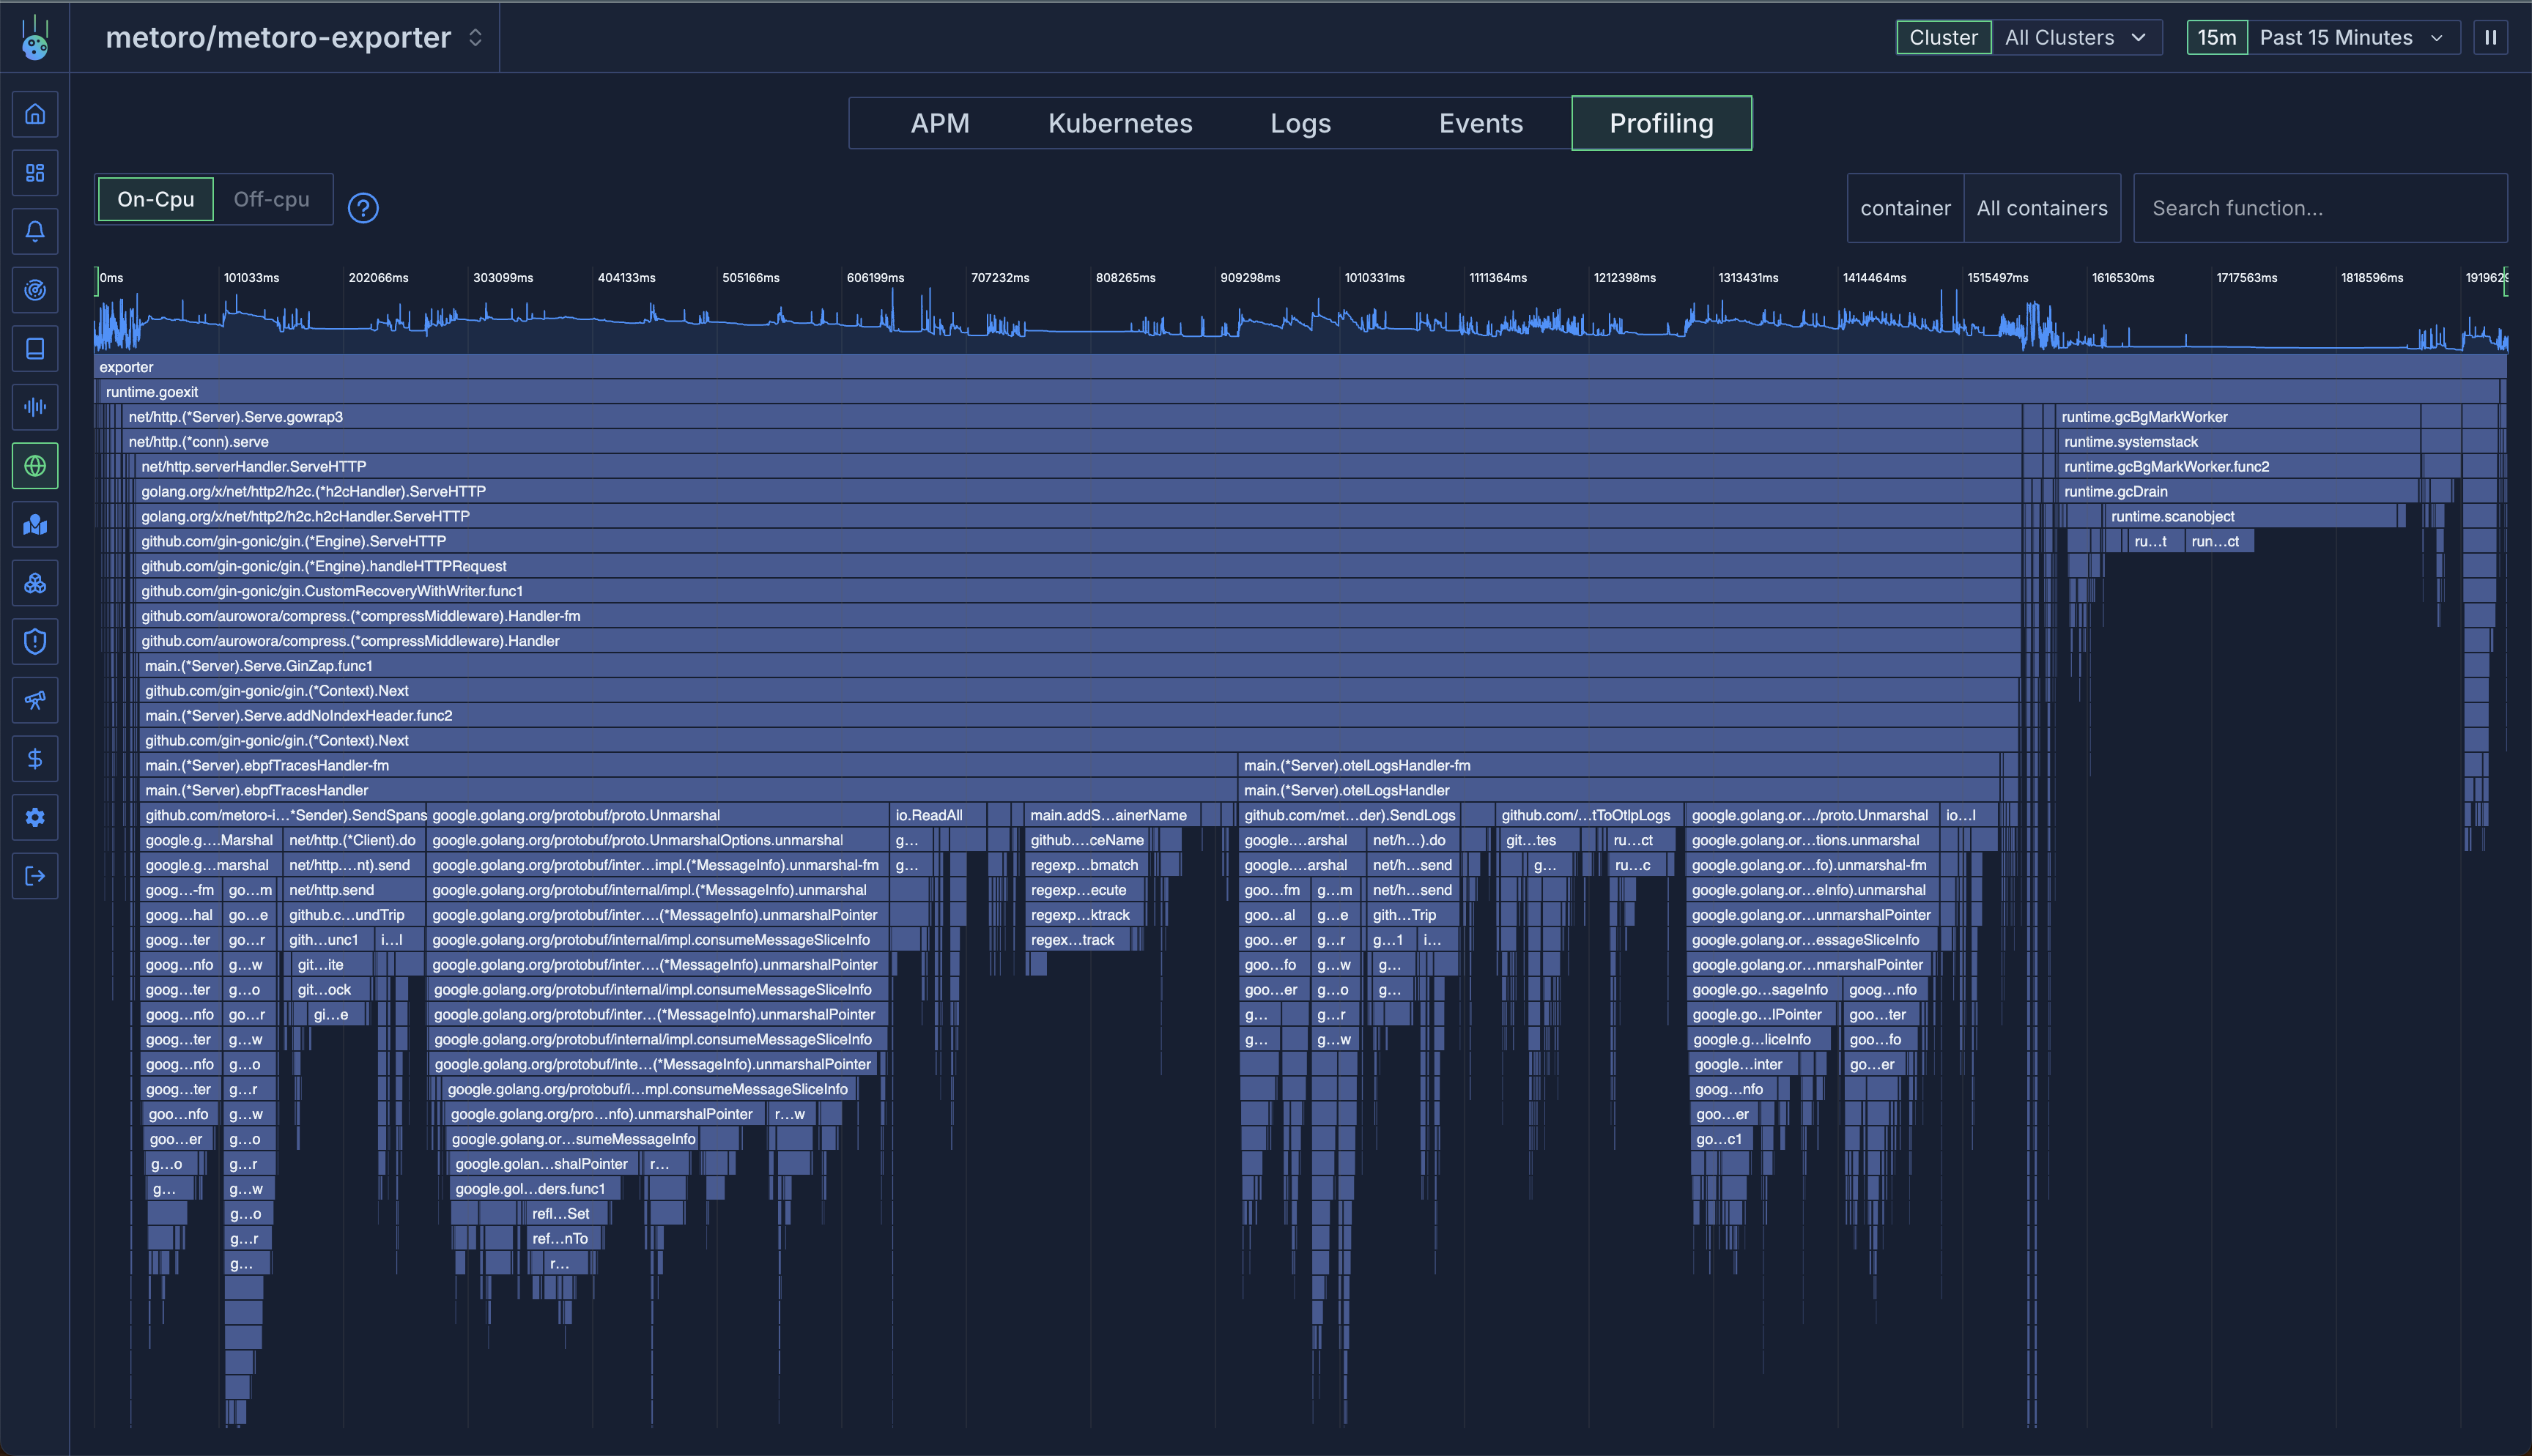
After you find the service you are interested in, you can click on it to see the auto-generated service page.

Service Page

The service page shows you in-depth information about the service including:

  • APM data
  • Kubernetes information like number of replicas, deployment history, etc
  • Metrics
  • Logs
  • Profiling data
  • Kubernetes events associated with the service

The default view is the APM tab. Here you can see autogenerated RED metrics, requests to the service and a service map of the communication between the service and other services in the cluster. Check out an example service page.

Clicking through to the kubernetes tab will show you an overview of service with regards to pods, scaling information and metrics. You can see all pods associated with the service, drill into them or look at aggregated metrics. Check out an example kubernetes page.

Logs are a great way to see what’s going on in your service. Check out an example logs page.

Events show all of the kubernetes events which have been emitted which target a resource associated with the service. For example when a pod is being created you will see the event in the events tab. It’s a good way to see if any cluster level issues are happening with a service like failed scheduling or pod restarts. Check out an example here

Finally the profiling tab will show you any profiling data collected from the pod and containers associated with the service and aggregate it to show you how much time is being spent in each function across all pods. Check out an example profiling page. This allows you to see if there are any performance bottlenecks in your service.