Uptime Monitoring Logs
After setting up your uptime monitors, you’ll want to track their results to ensure your services are functioning properly. Metoro provides detailed logs allowing you to analyze performance and troubleshoot issues.
Finding Uptime Monitoring Logs
- Navigate to the Logs page in your Metoro dashboard
- Use the following filters to find uptime monitoring logs:
- Service name:
uptime-monitor
- Environment:
metoro-internal
- Severity: All (to see both successes and failures)
Log Content
Each log entry contains detailed information about a monitor check:
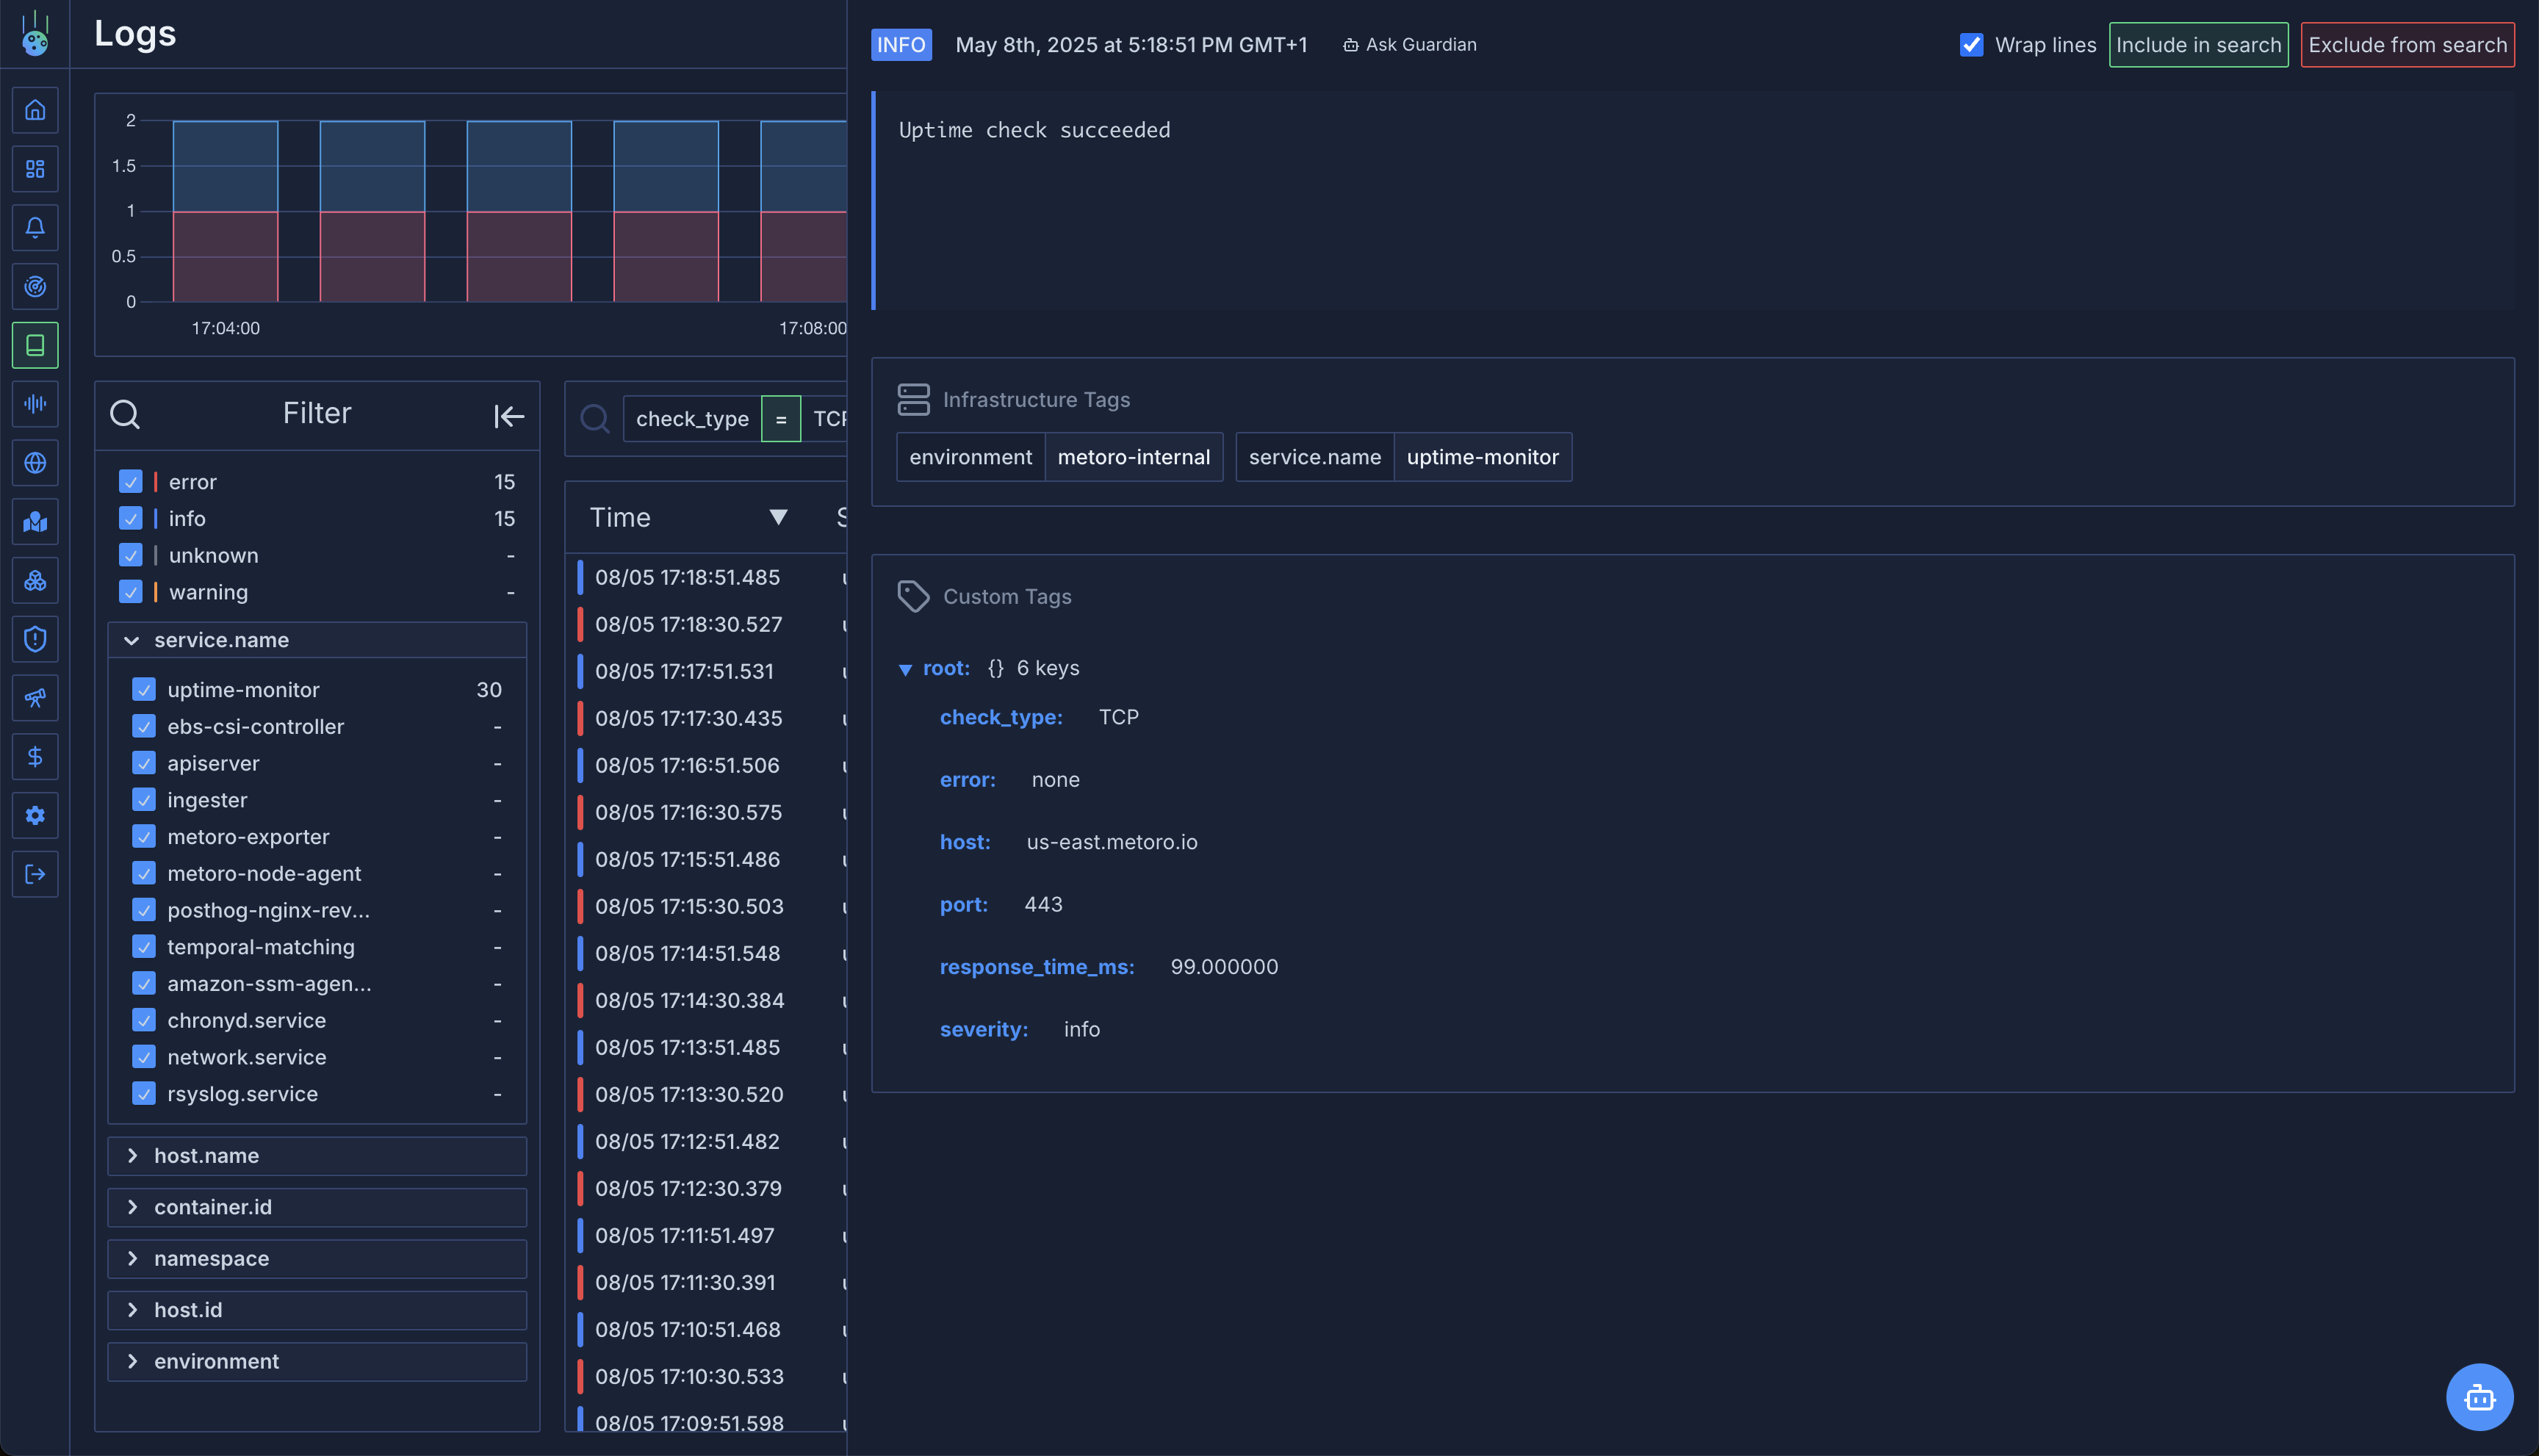
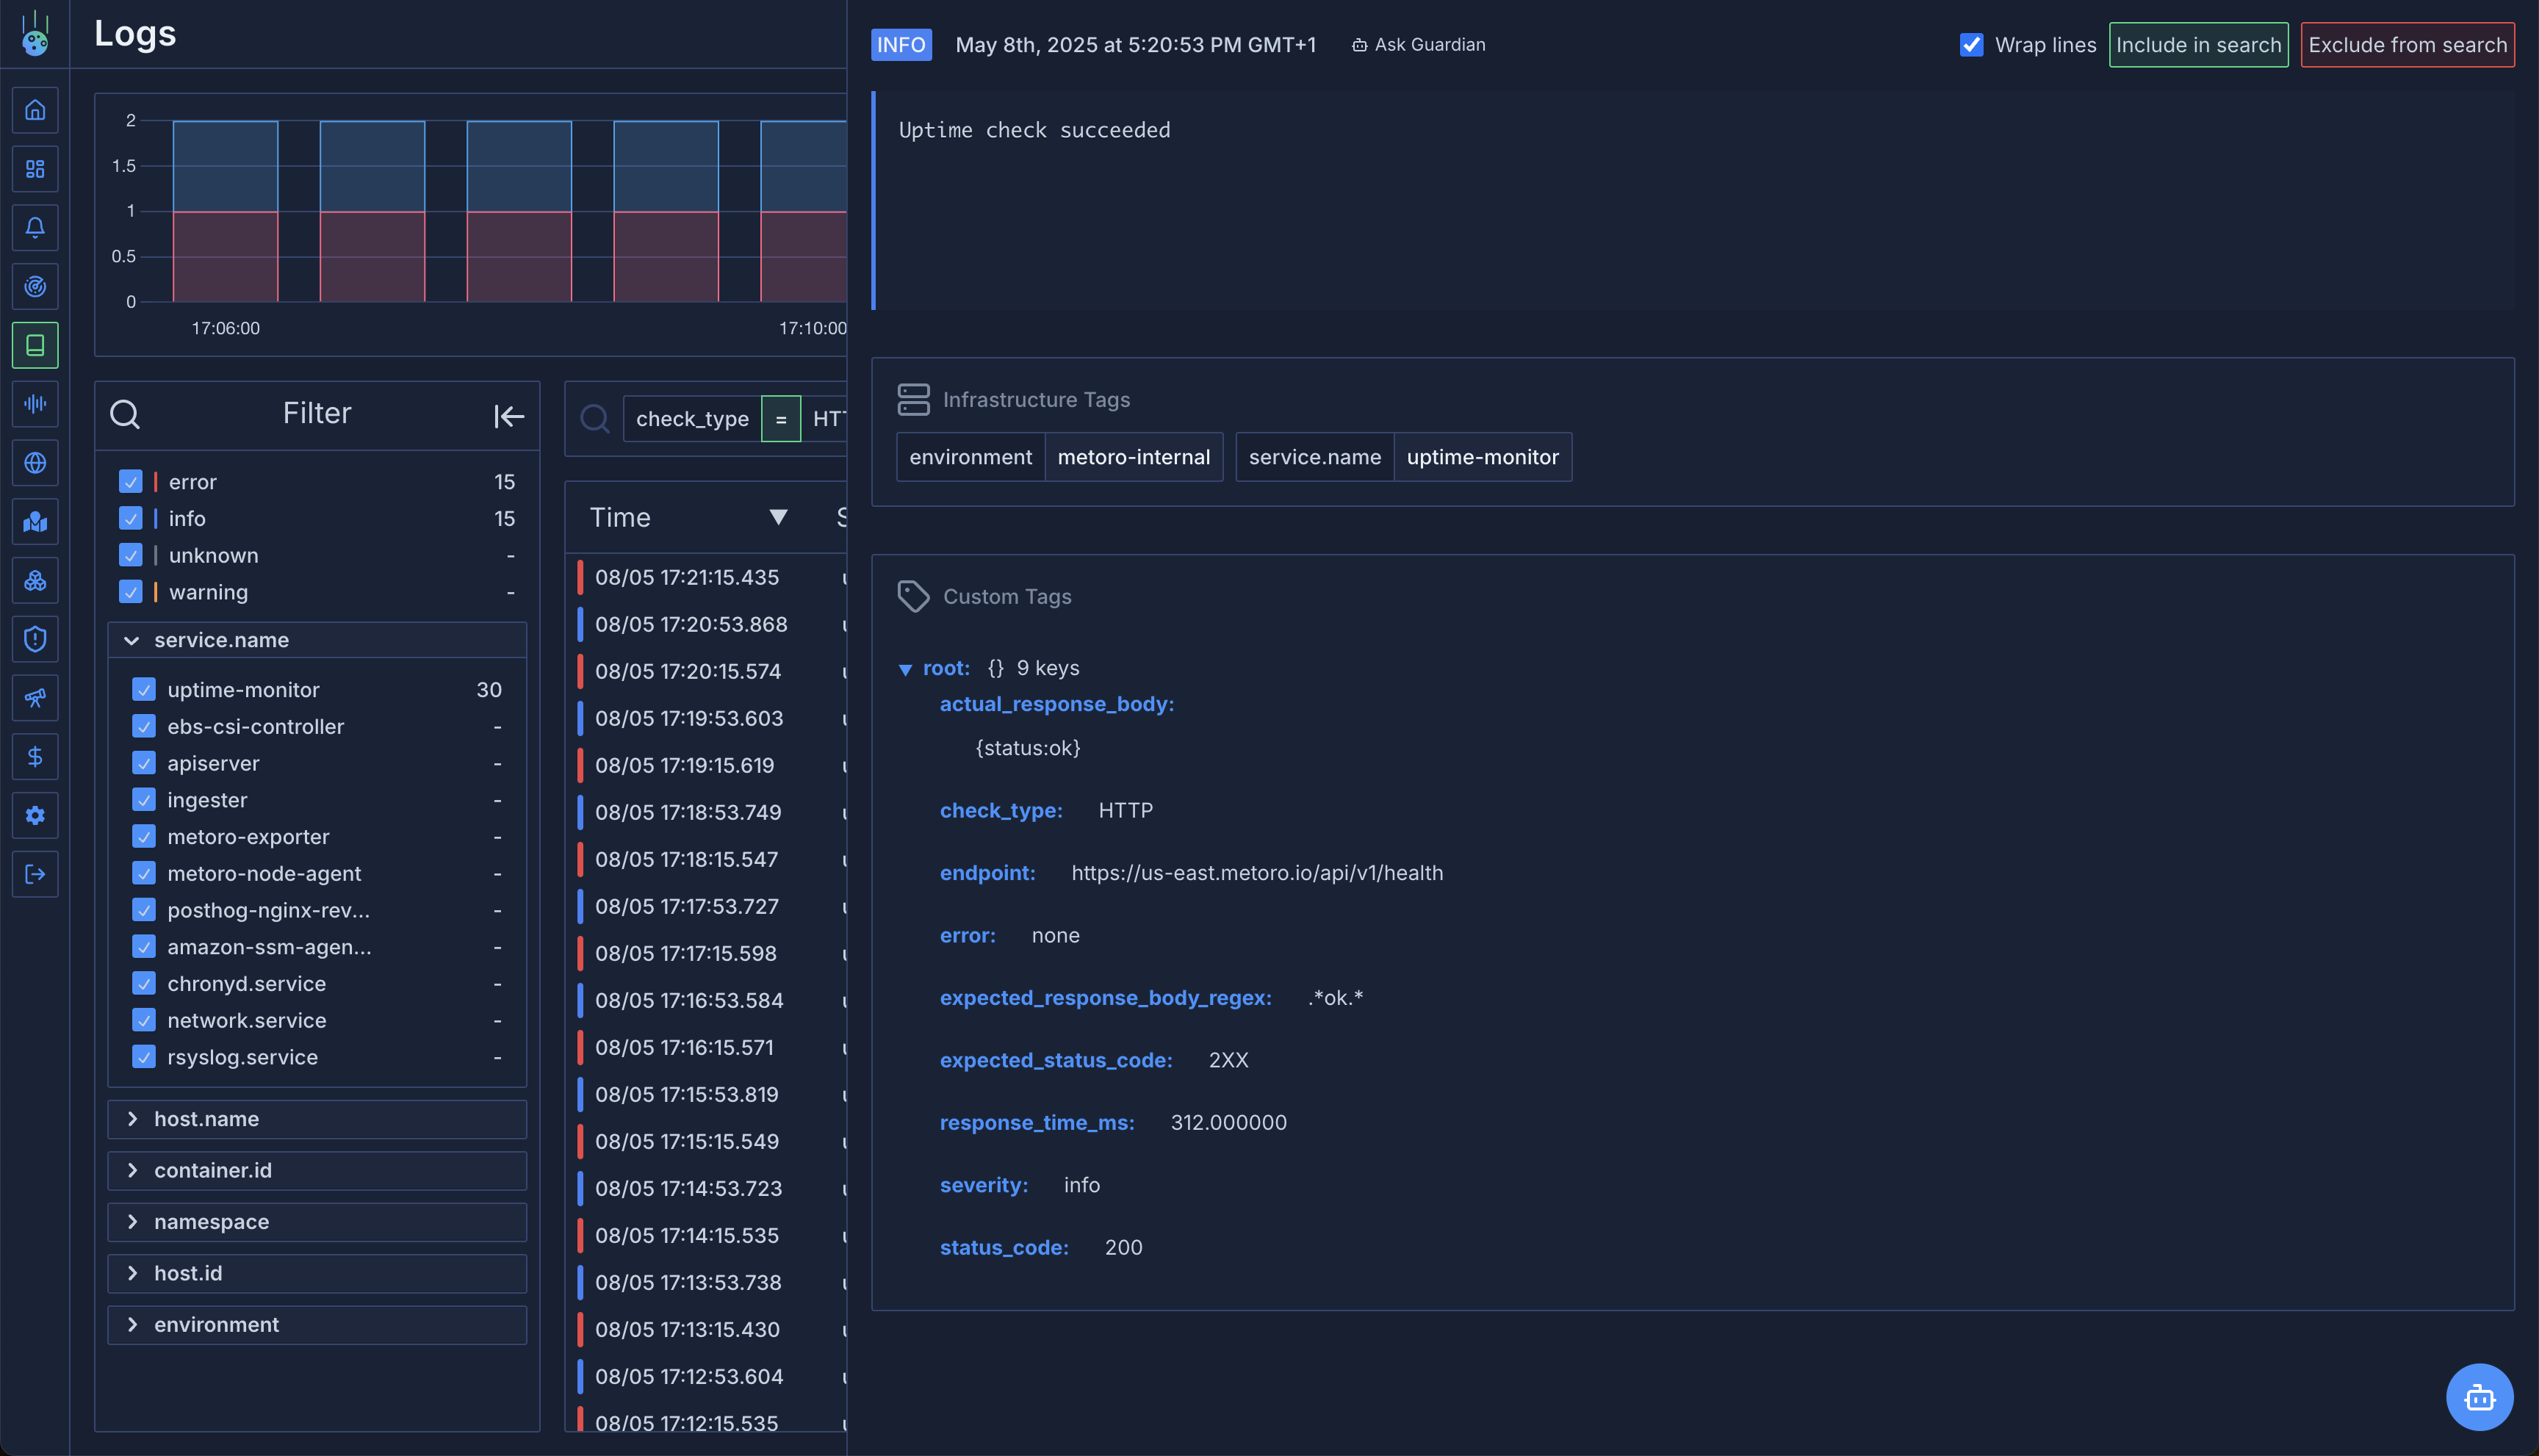
For successful checks:
- Log line:
Uptime check succeeded
- Attributes include:
check_type: Whether this was an HTTP or TCP checkresponse_time_ms: How long the request took to complete- For HTTP checks:
endpoint: The URL that was checkedstatus_code: The HTTP status code receivedexpected_status_code: The pattern you configuredactual_response_body: The body content returned (may be truncated for large responses)
- For TCP checks:
host: The hostname or IP addressport: The TCP port number
Successful TCP Check Log Line
 Successful HTTP Check Log Line
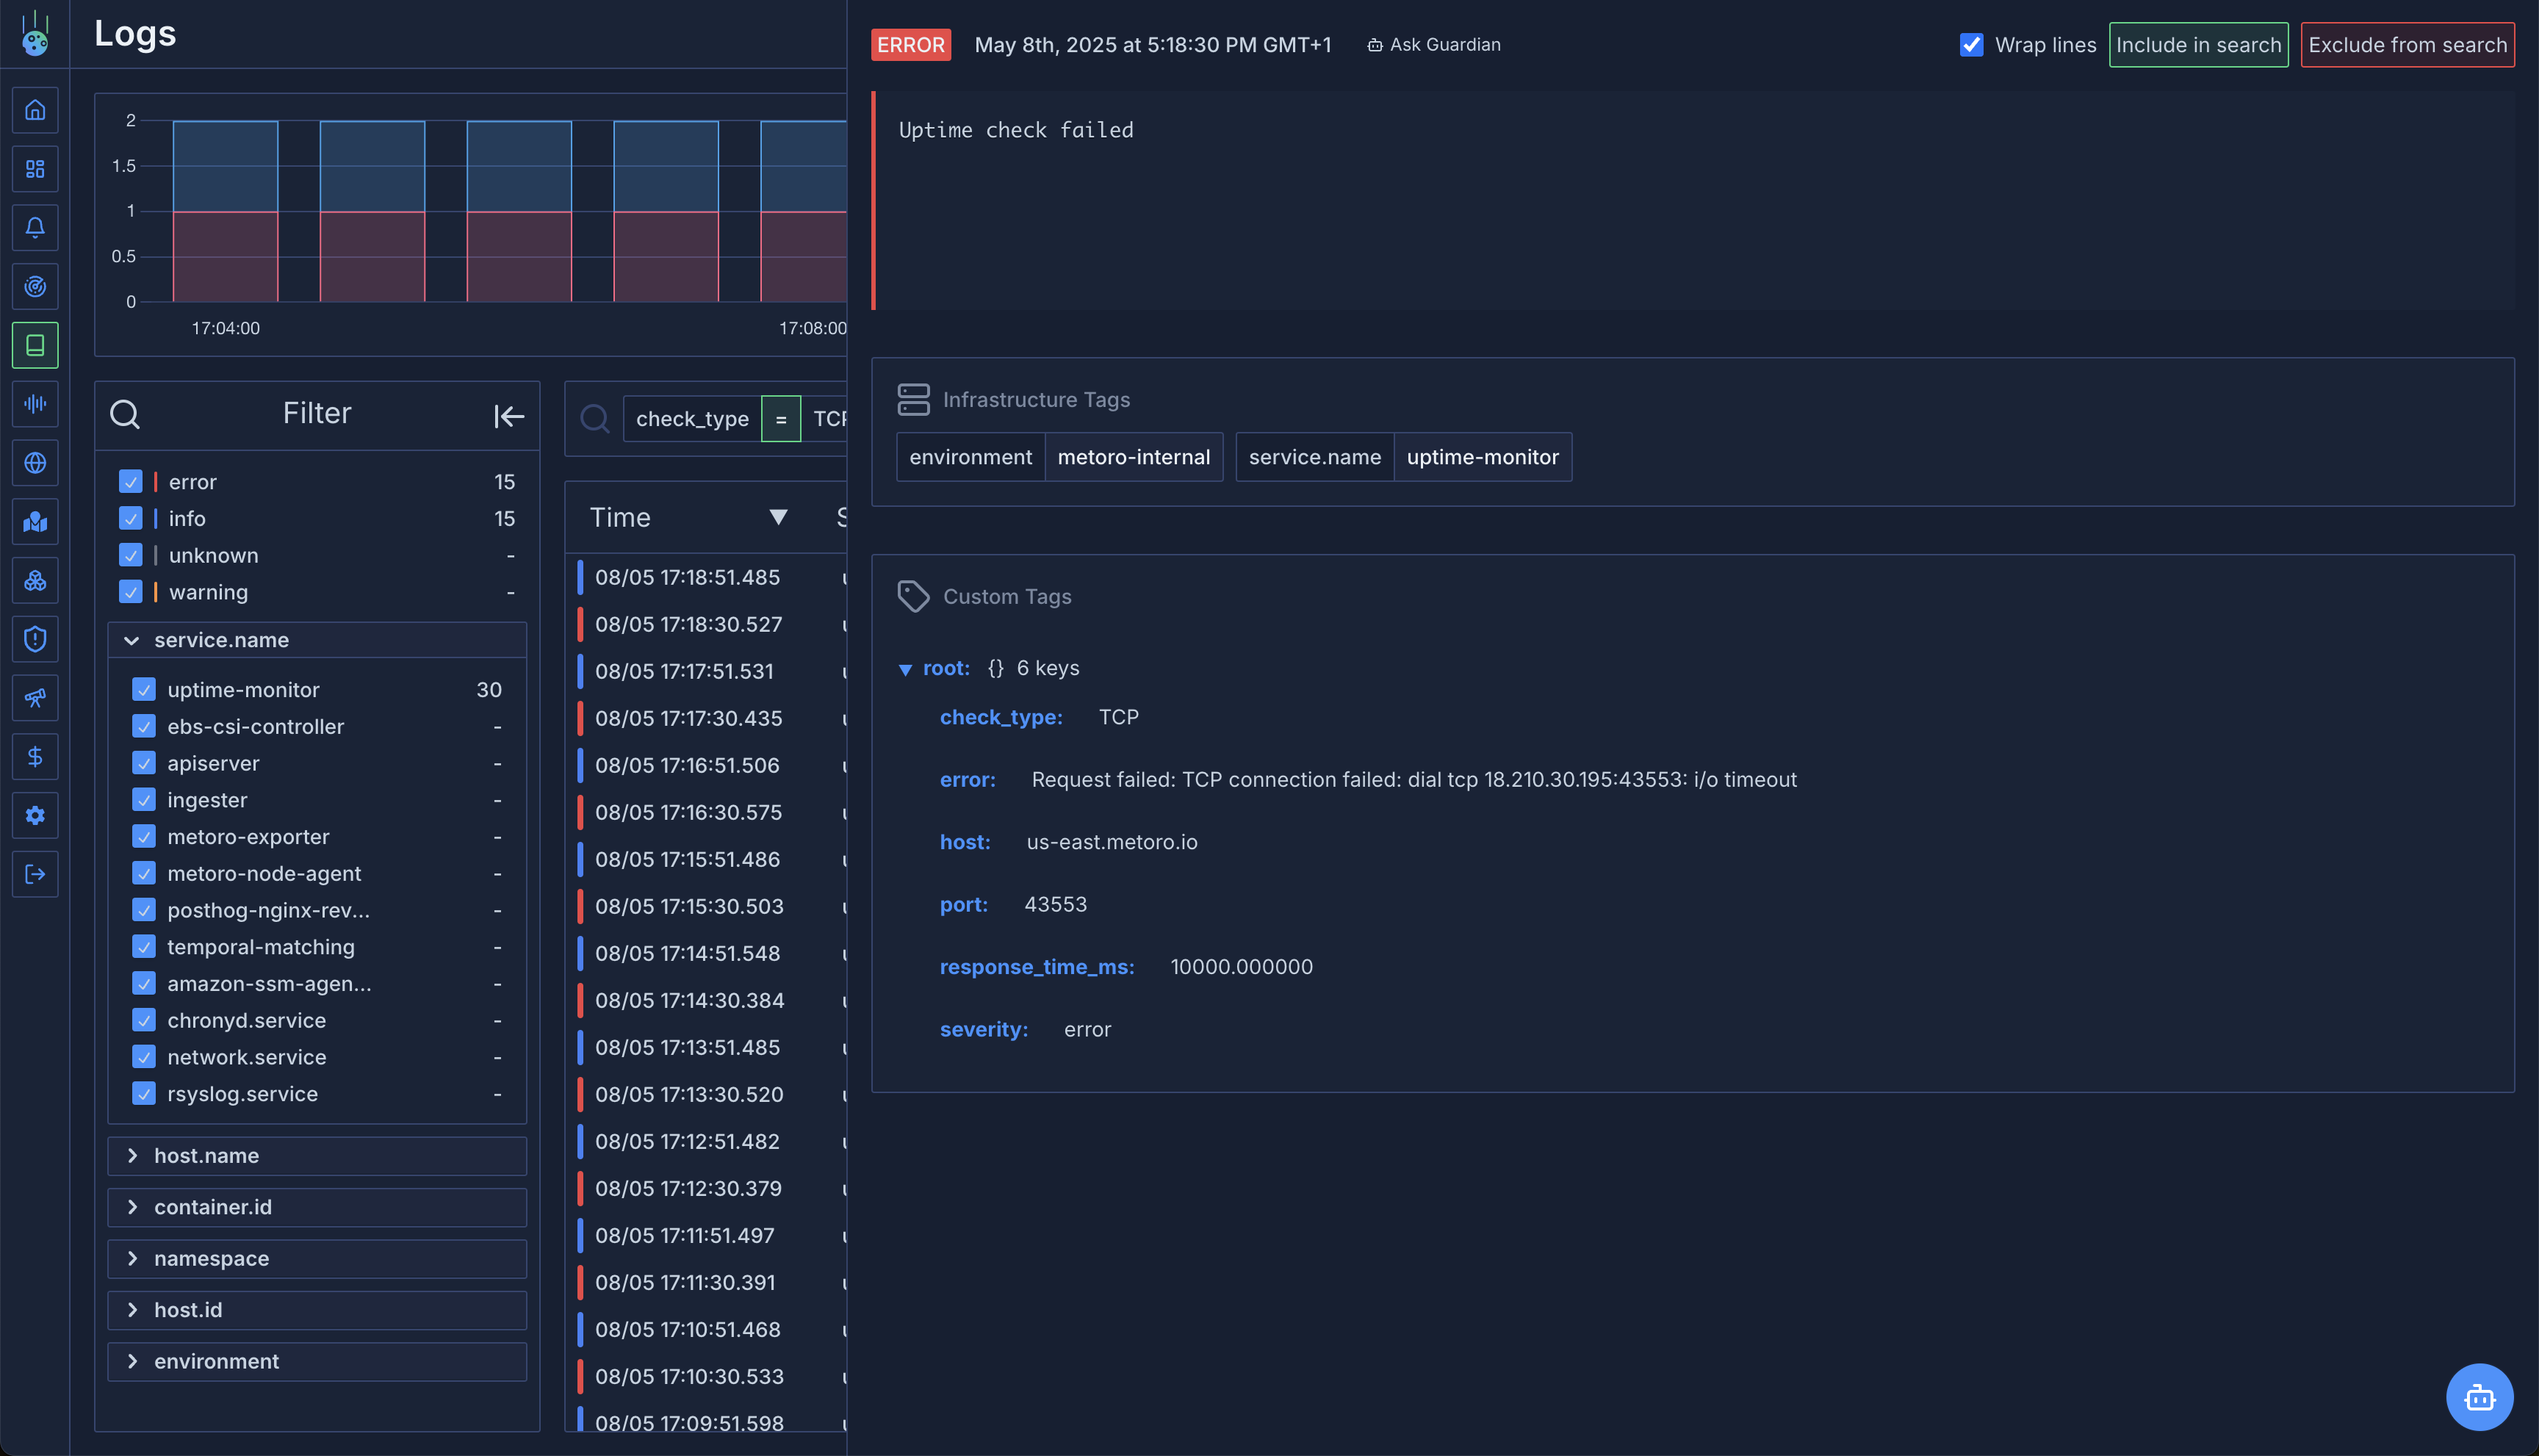
 For failed checks:
- Log line:
Uptime check failed
- Attributes include:
error: Detailed reason for the failure (e.g., “status code mismatch”, “response body mismatch”, “TCP Dial failed”)check_type: Whether this was an HTTP or TCP checkresponse_time_ms: How long the request took before failing- Other attributes as described for successful checks
Failed TCP Check Log Line
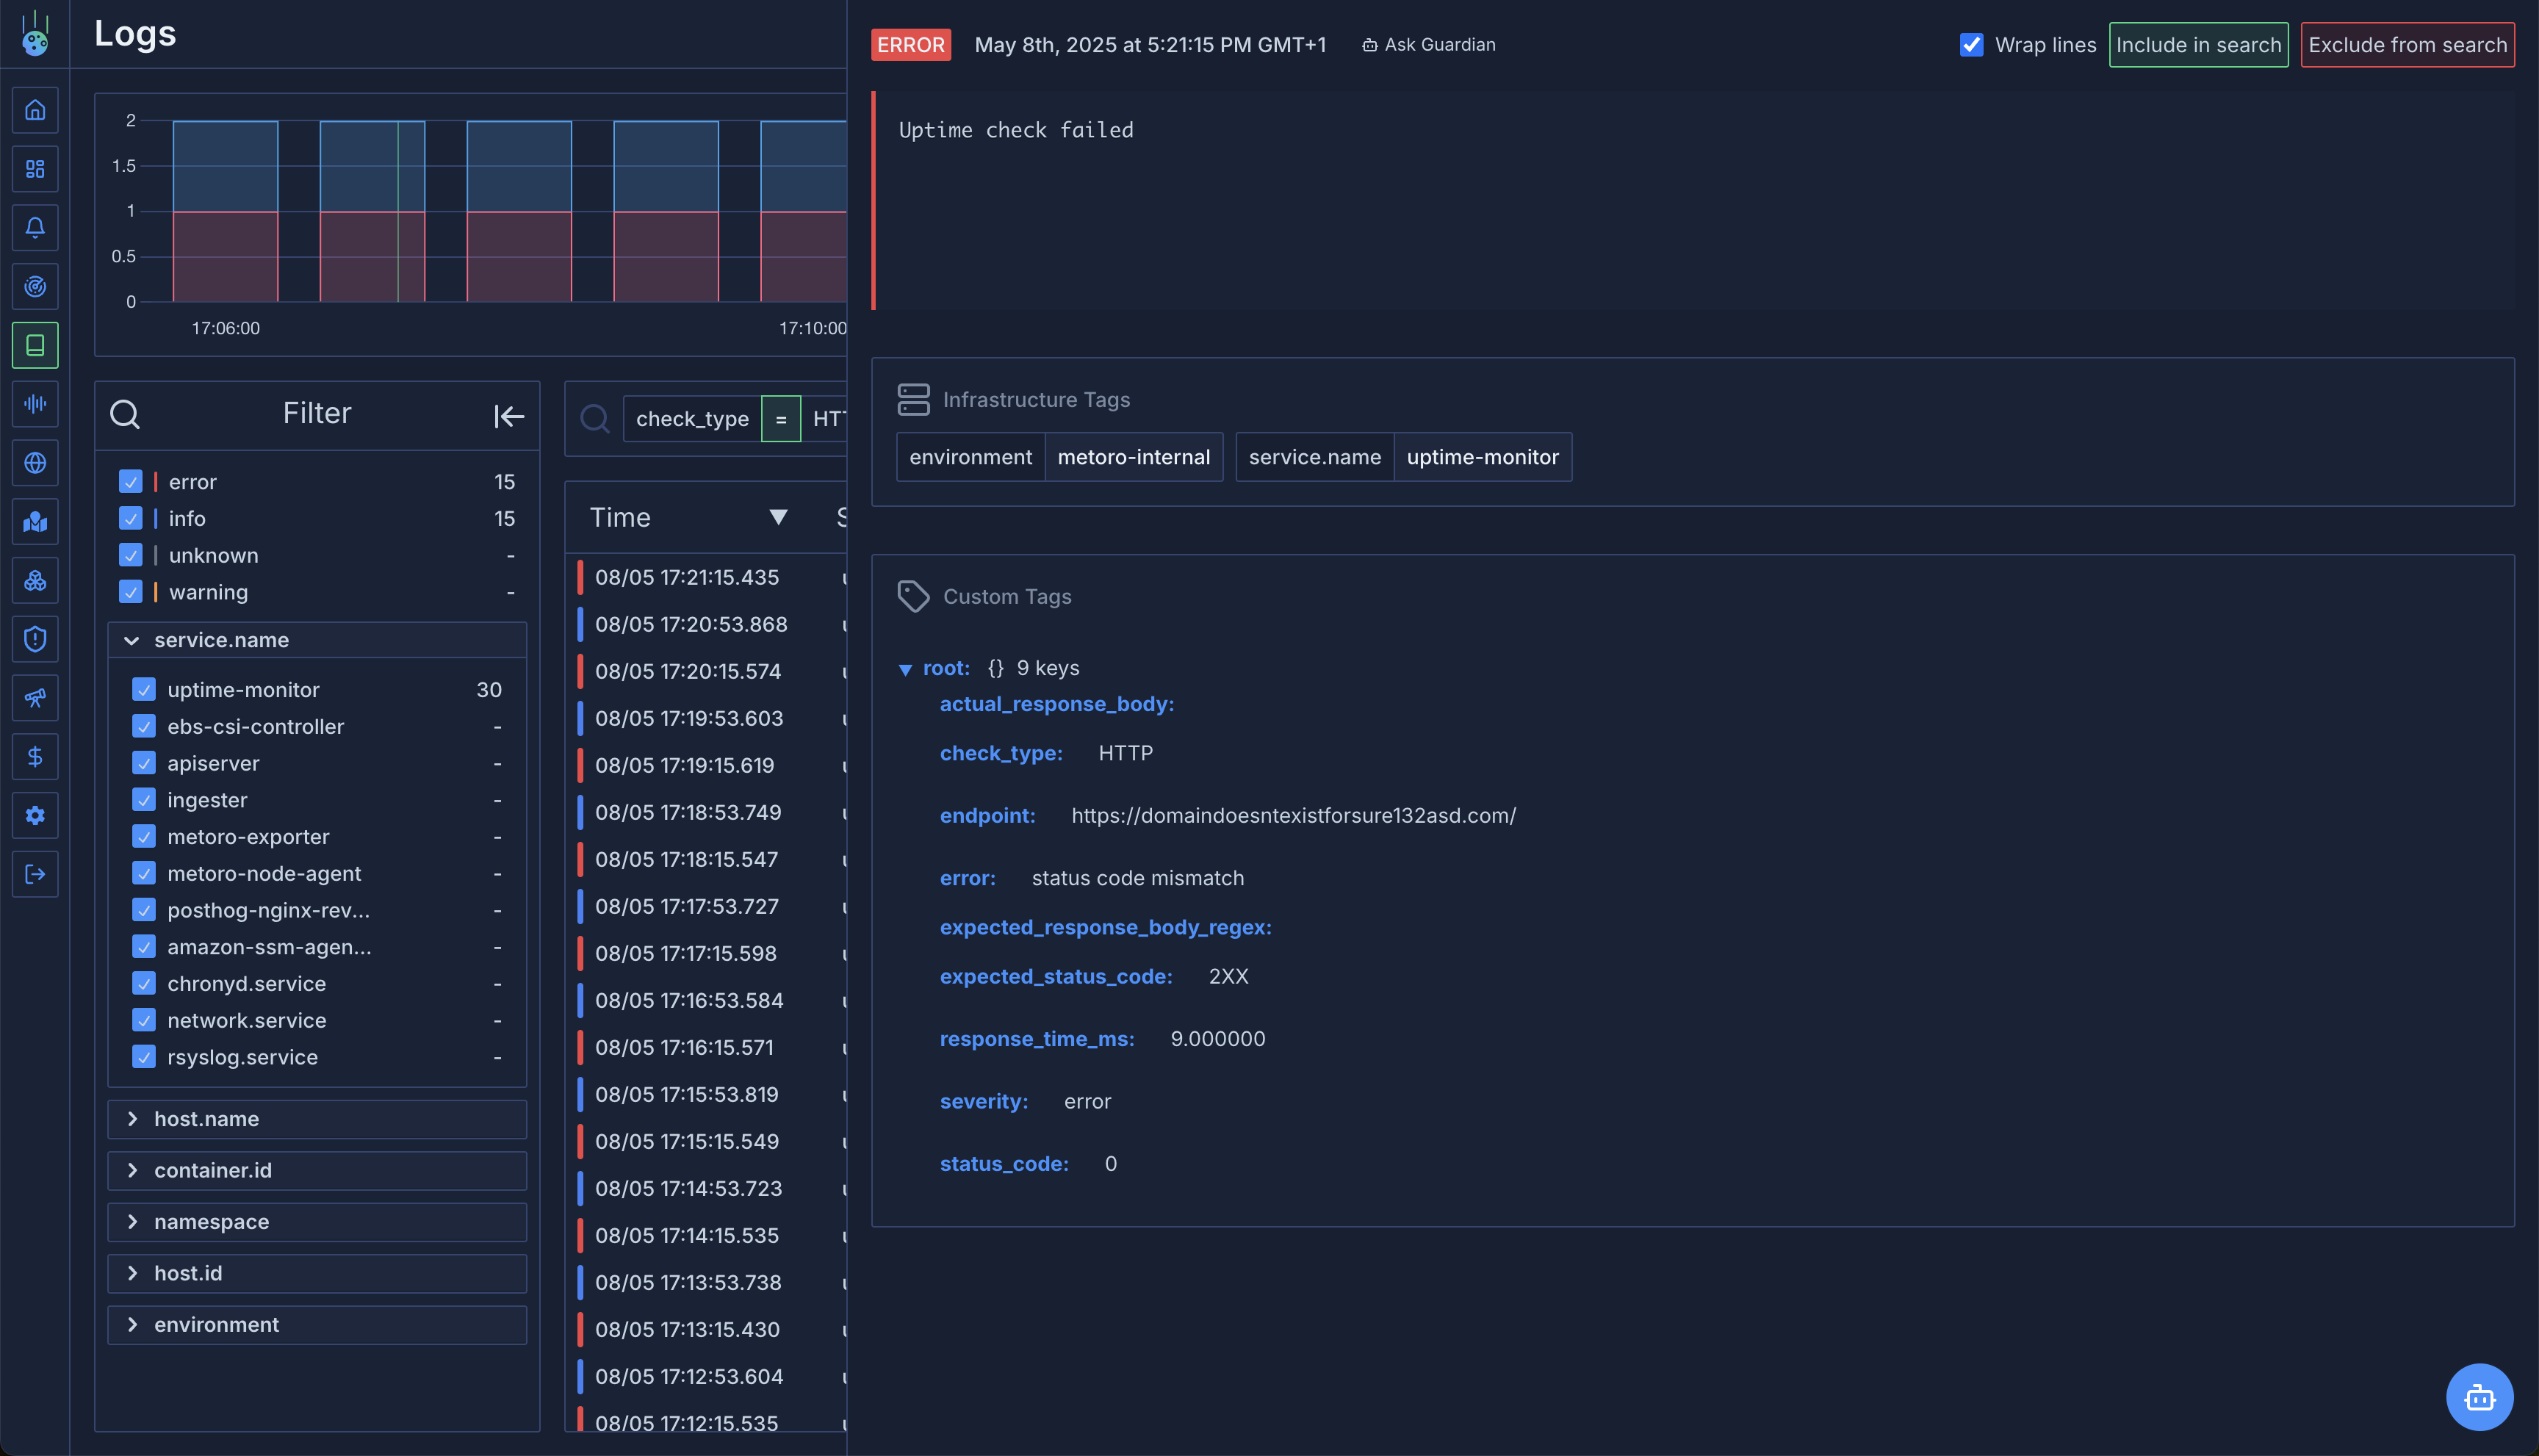
 Failed HTTP Check Log Line
Troubleshooting Using Logs
When a check fails, look at the error field first to understand the type of failure:
-
Connection errors - For errors like “connection refused” or “timeout”, the service may be down, blocked by a firewall, or experiencing network issues.
-
Status code mismatches - Compare the
status_code with expected_status_code to see if the service is returning unexpected responses.
-
Response body mismatches - Check if the
actual_response_body contains the content you expected to match your regex pattern.
-
TCP connection failures - For errors like “TCP Dial failed”, verify the host is reachable and the port is open.
If the actual_response_body attribute is empty in the logs, it likely means the HTTP server did not return a response. In this case, the status_code attribute will be 0, indicating that no response was received.
