
Overview
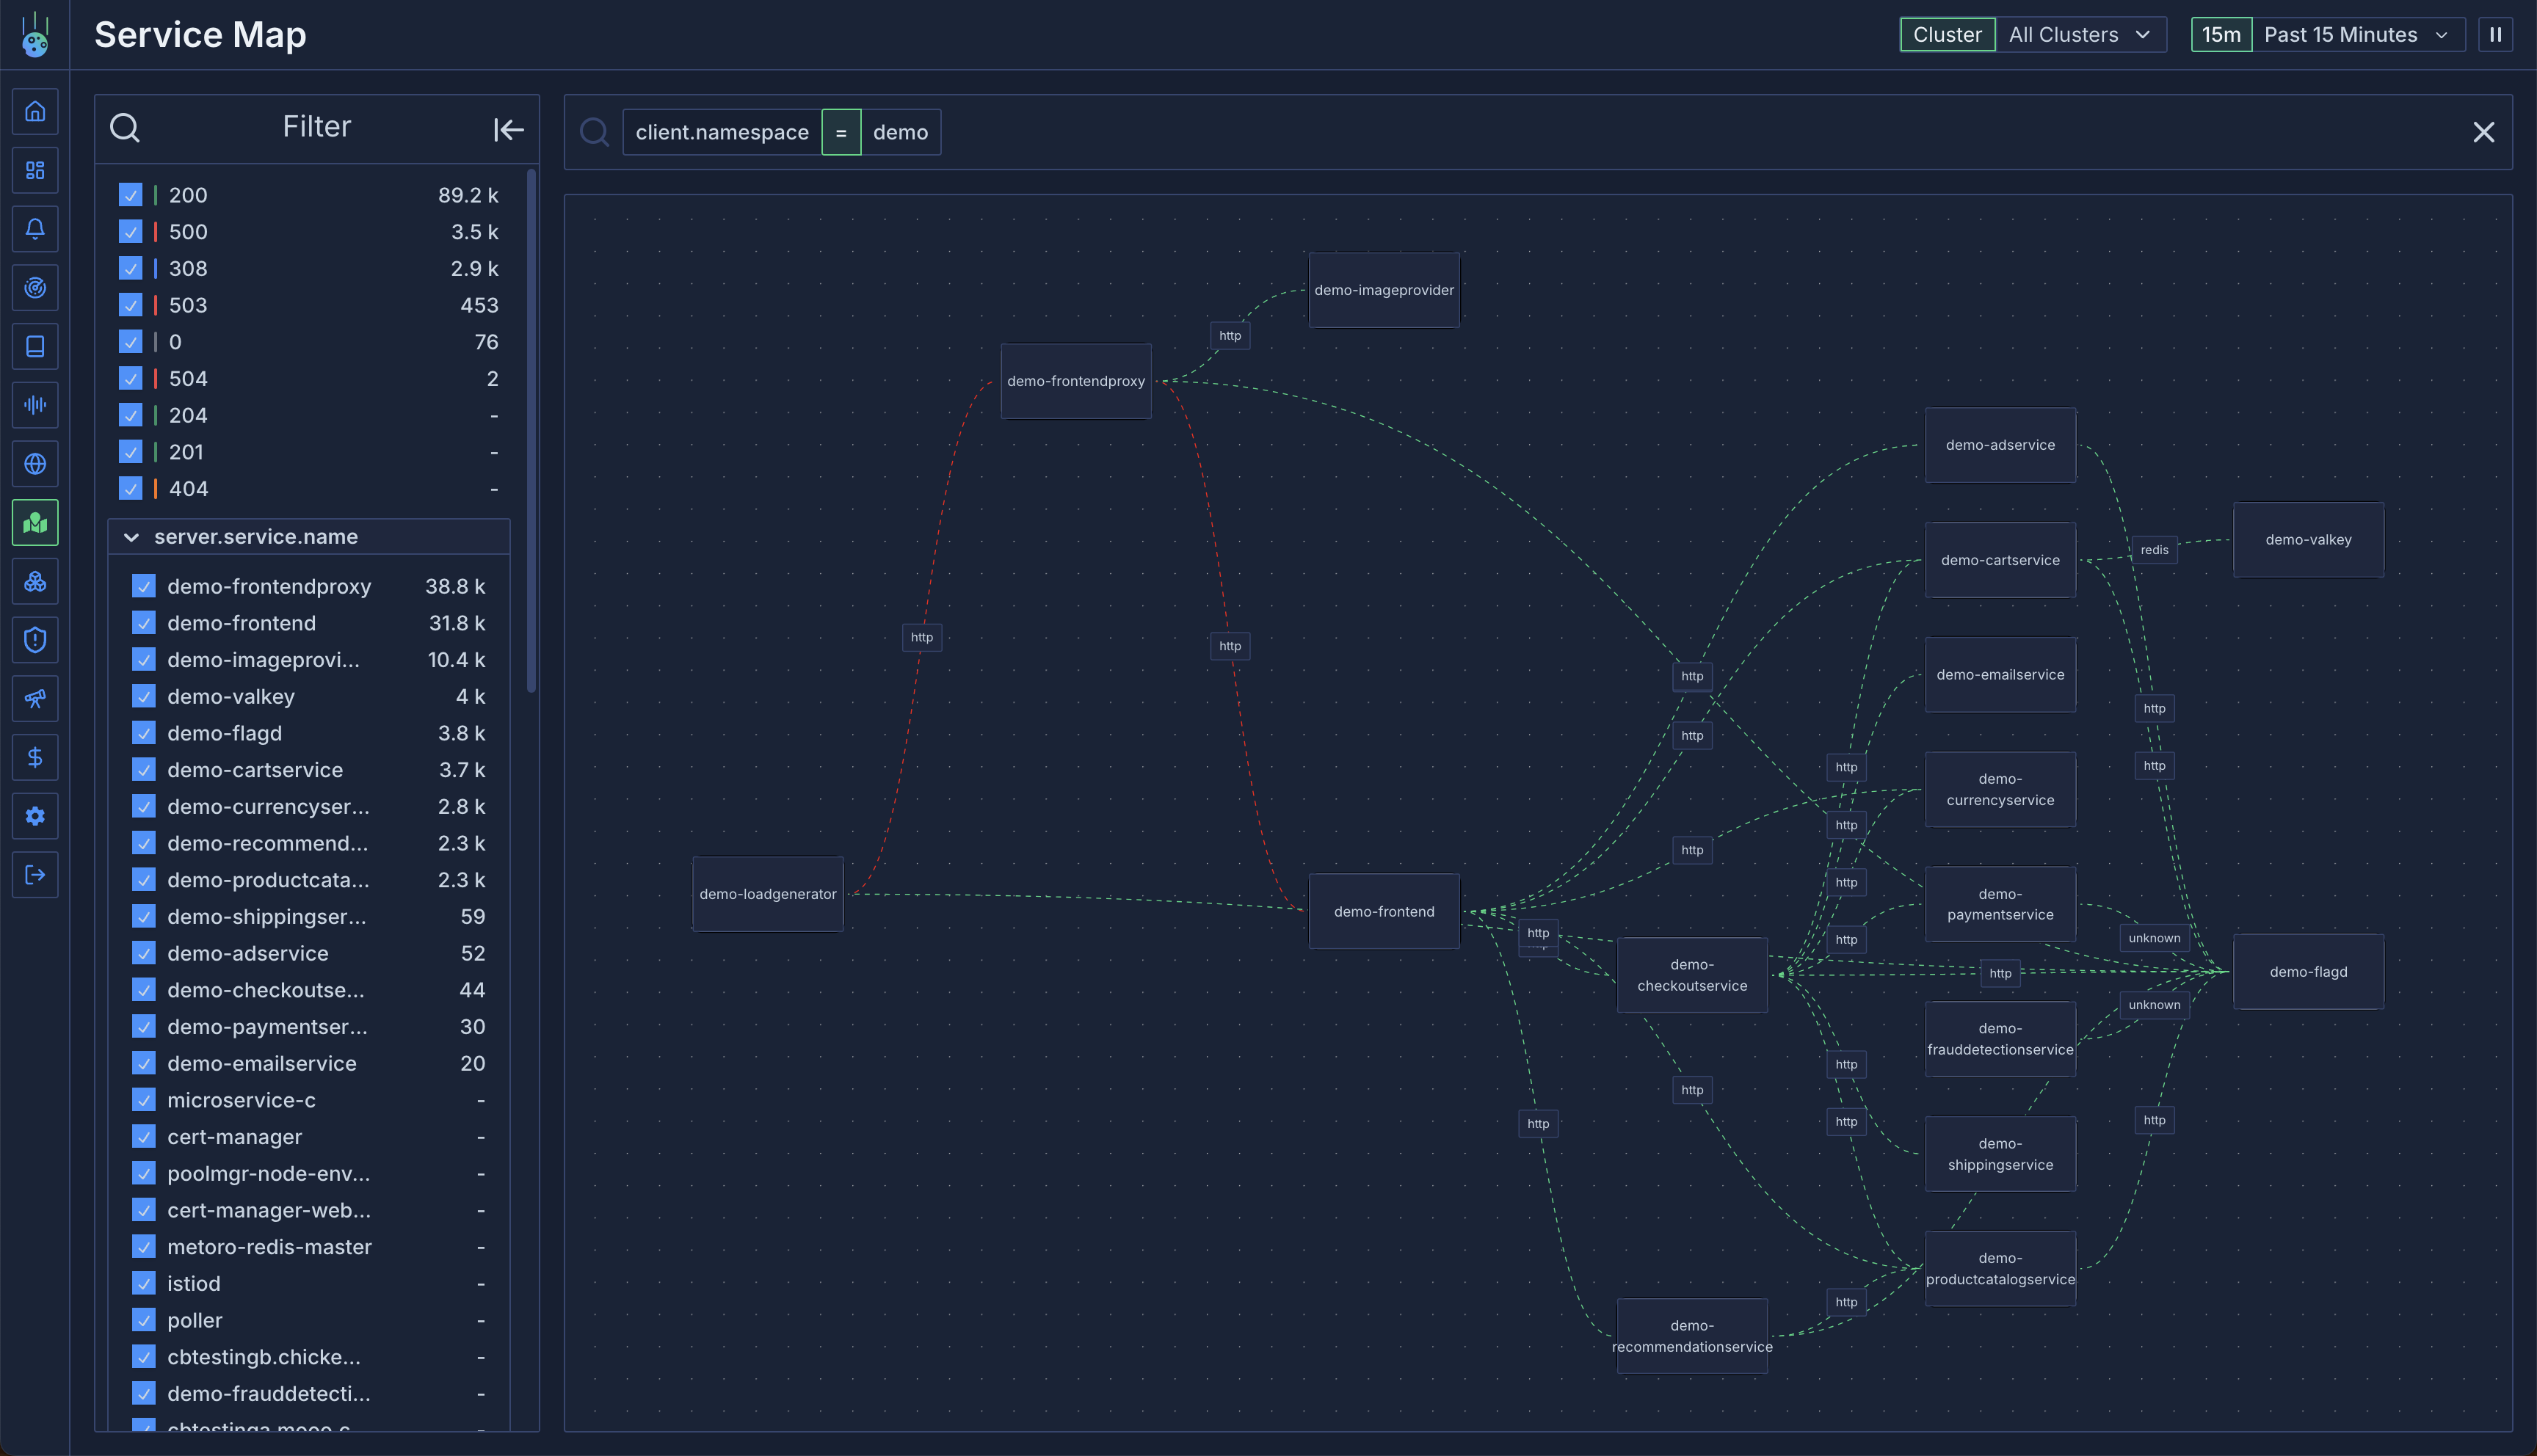
The service map is a powerful visualization tool in Metoro that displays connections between services in your cluster. Built on trace data, it provides insights into:- Service-to-service communication within your cluster
- External client requests entering your cluster
- Outbound requests from your services to external dependencies
How It Works
The service map is dynamically generated from trace data by:- Analyzing each request’s client and server containers
- Identifying service boundaries
- Creating visual connections between communicating services
- Detecting external traffic patterns
Connection Types
Internal Connections
Lines between services represent internal cluster communication:- Green lines indicate healthy connections
- Red lines indicate errors (5xx responses or traced errors)
- Line thickness represents traffic volume
External Traffic
The service map identifies two types of external traffic:- External Clients:
- Detected when only server-side traces exist
- Shows incoming traffic from outside the cluster
- Helps monitor external access patterns
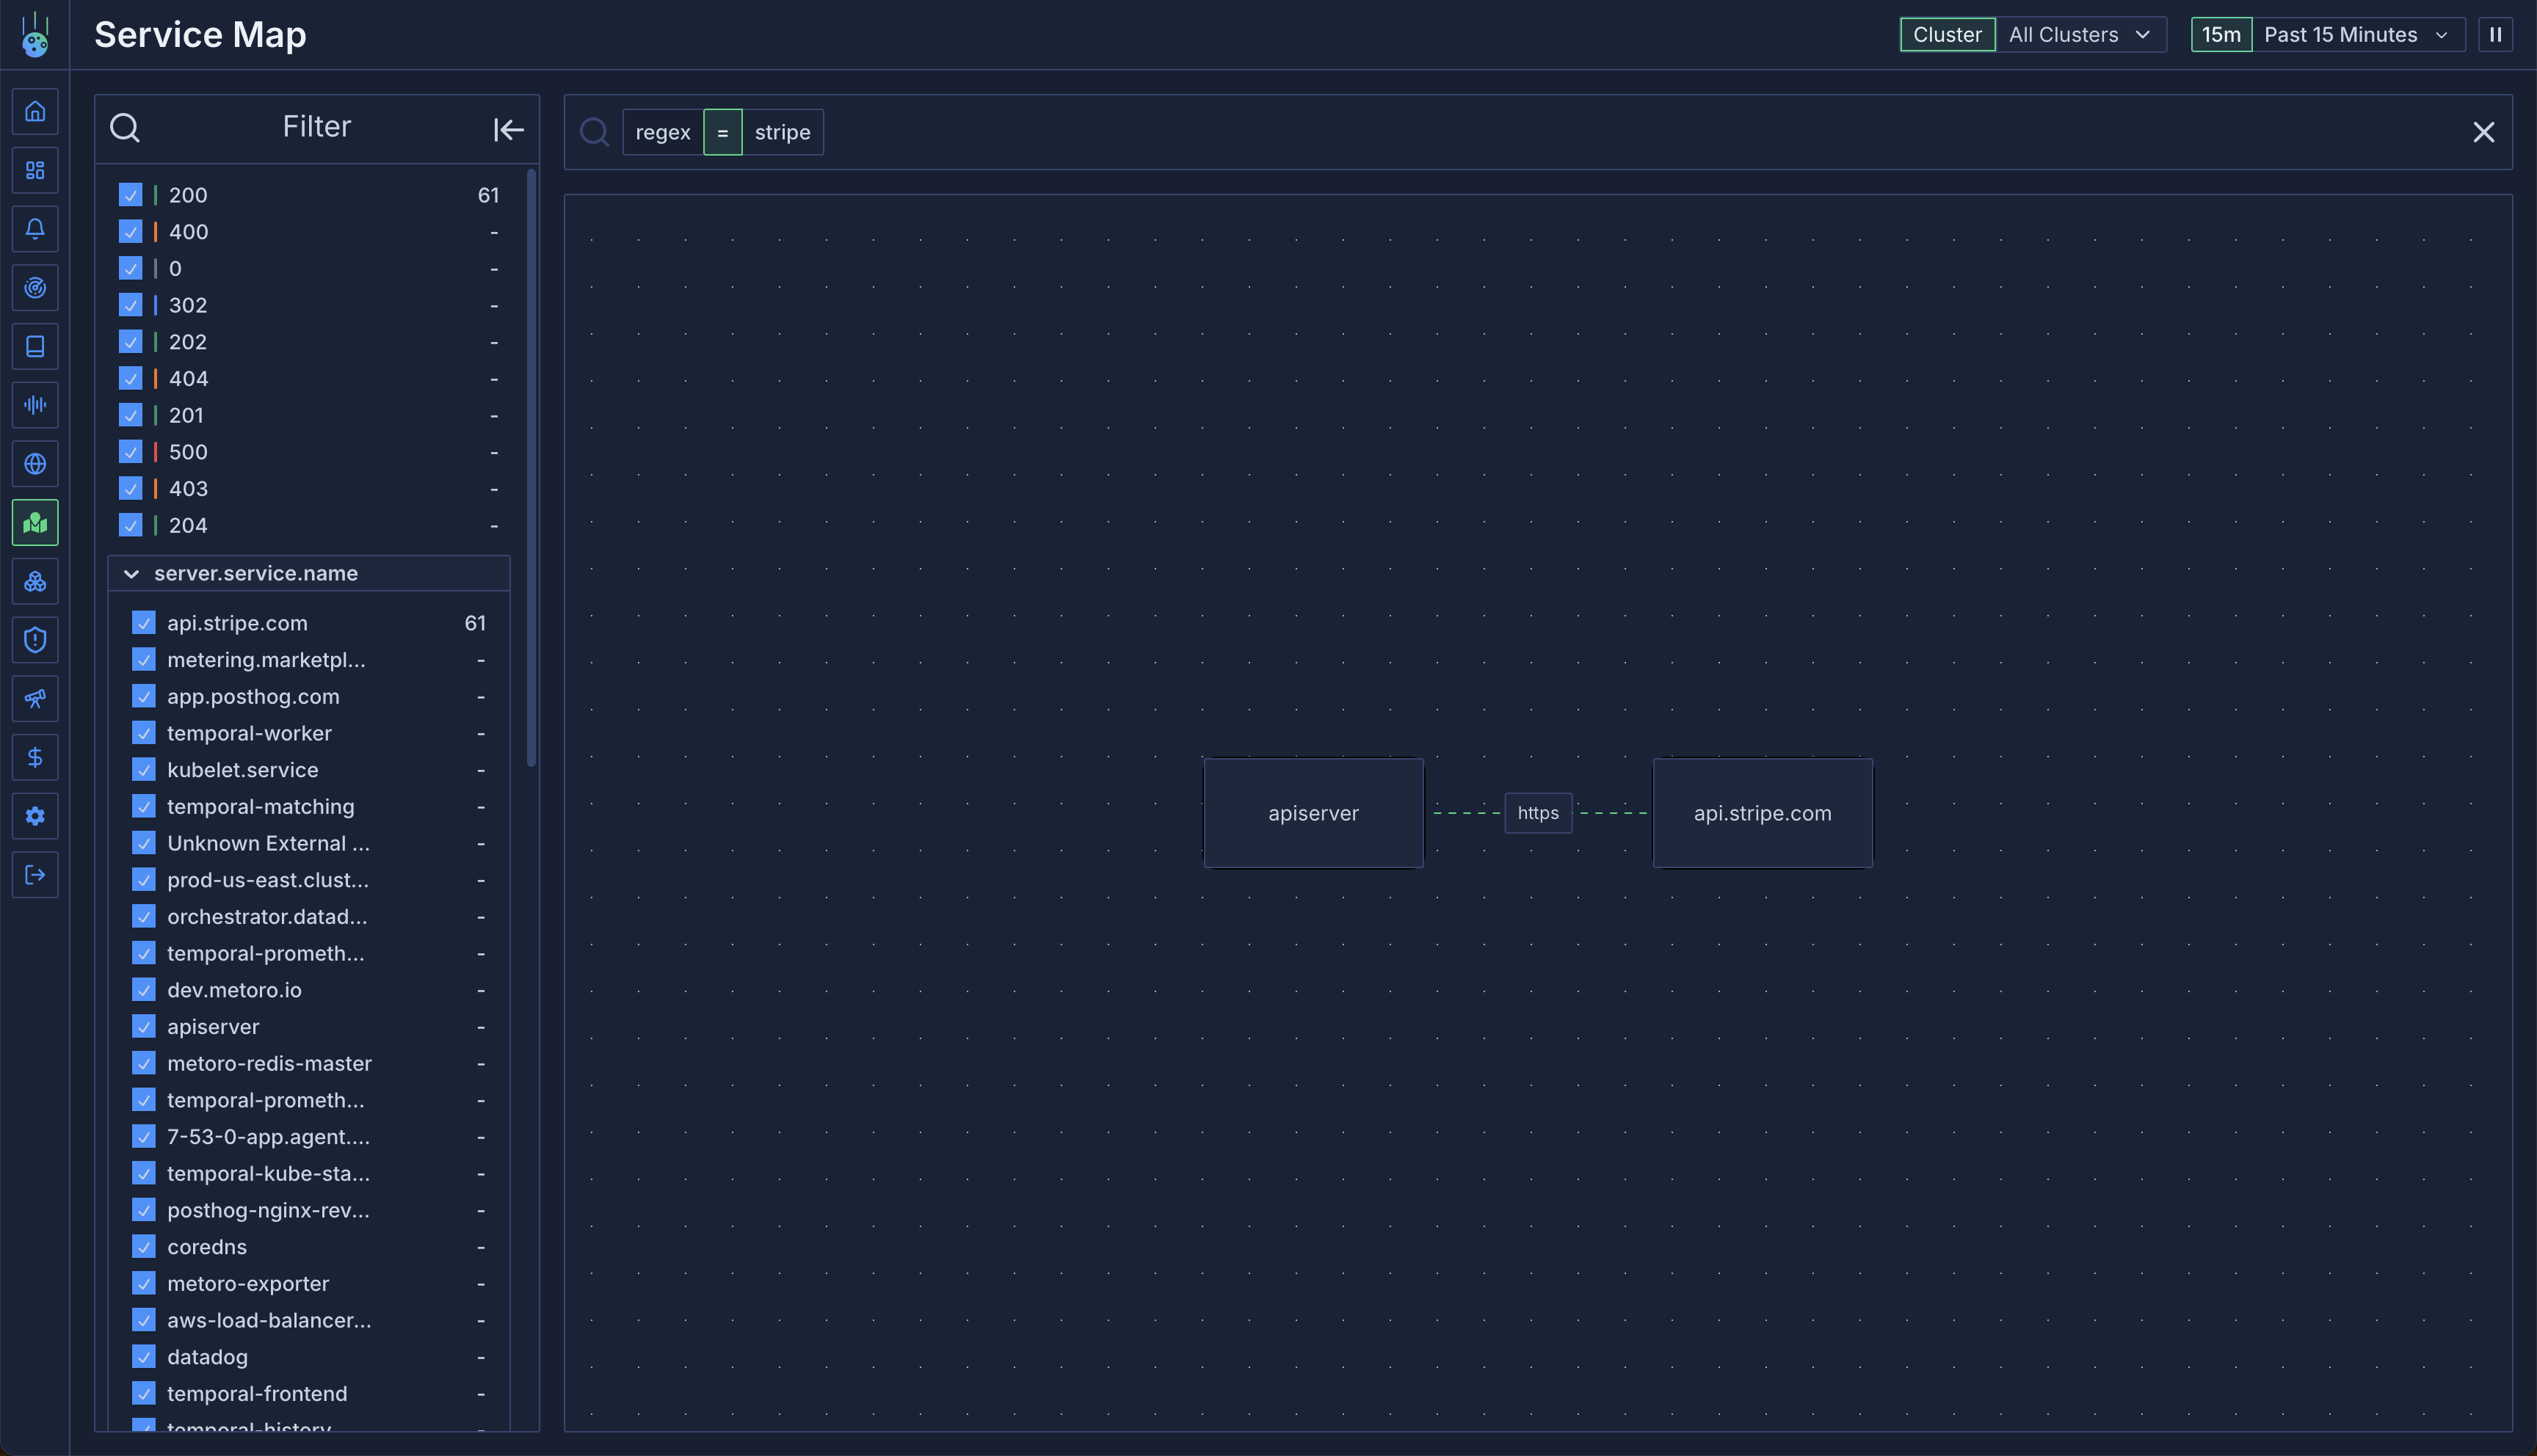
- External Services:
- Identified by analyzing outbound request destinations
- Groups requests by hostname (e.g.,
api.stripe.com) - Falls back to “Unknown External Service” for unresolvable IPs
Interactive Features
Connection Details
Mouse over any connection to:- View request rate statistics
- Access underlying traces
- See error rates and patterns
- Filter by connection attributes
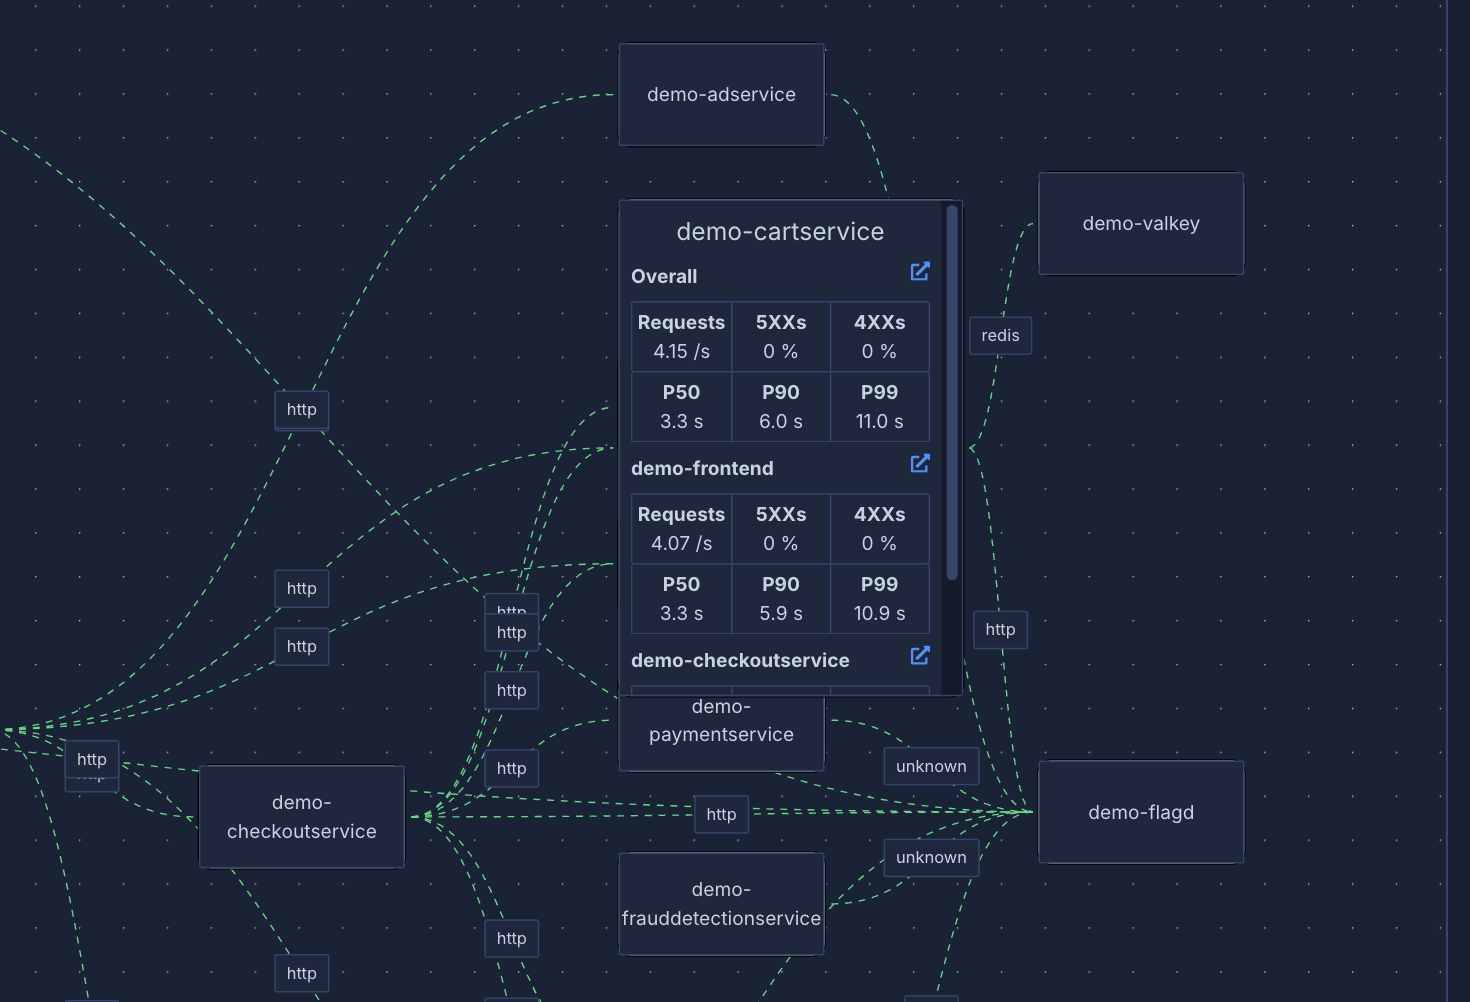
Service Details
Mouse over any service node to see:- Incoming request rates
- Connected services
- Traffic patterns
- Service health metrics
Filtering
Namespace Filtering
Filter traffic by namespace:Service Filtering
Filter by service names:Path Filtering
Use regex to filter by HTTP path:Use Cases
- Dependency Monitoring:
- Track external service dependencies
- Monitor third-party API usage
- Set up alerts for external service issues
- Traffic Analysis:
- Identify communication patterns
- Debug service connectivity issues
- Monitor service health
- Error Detection:
- Quickly spot failing connections
- Investigate error patterns
- Track error rates across services