Add Webhook button.
Fill in the details of the webhook and click on the Add Webhook button.
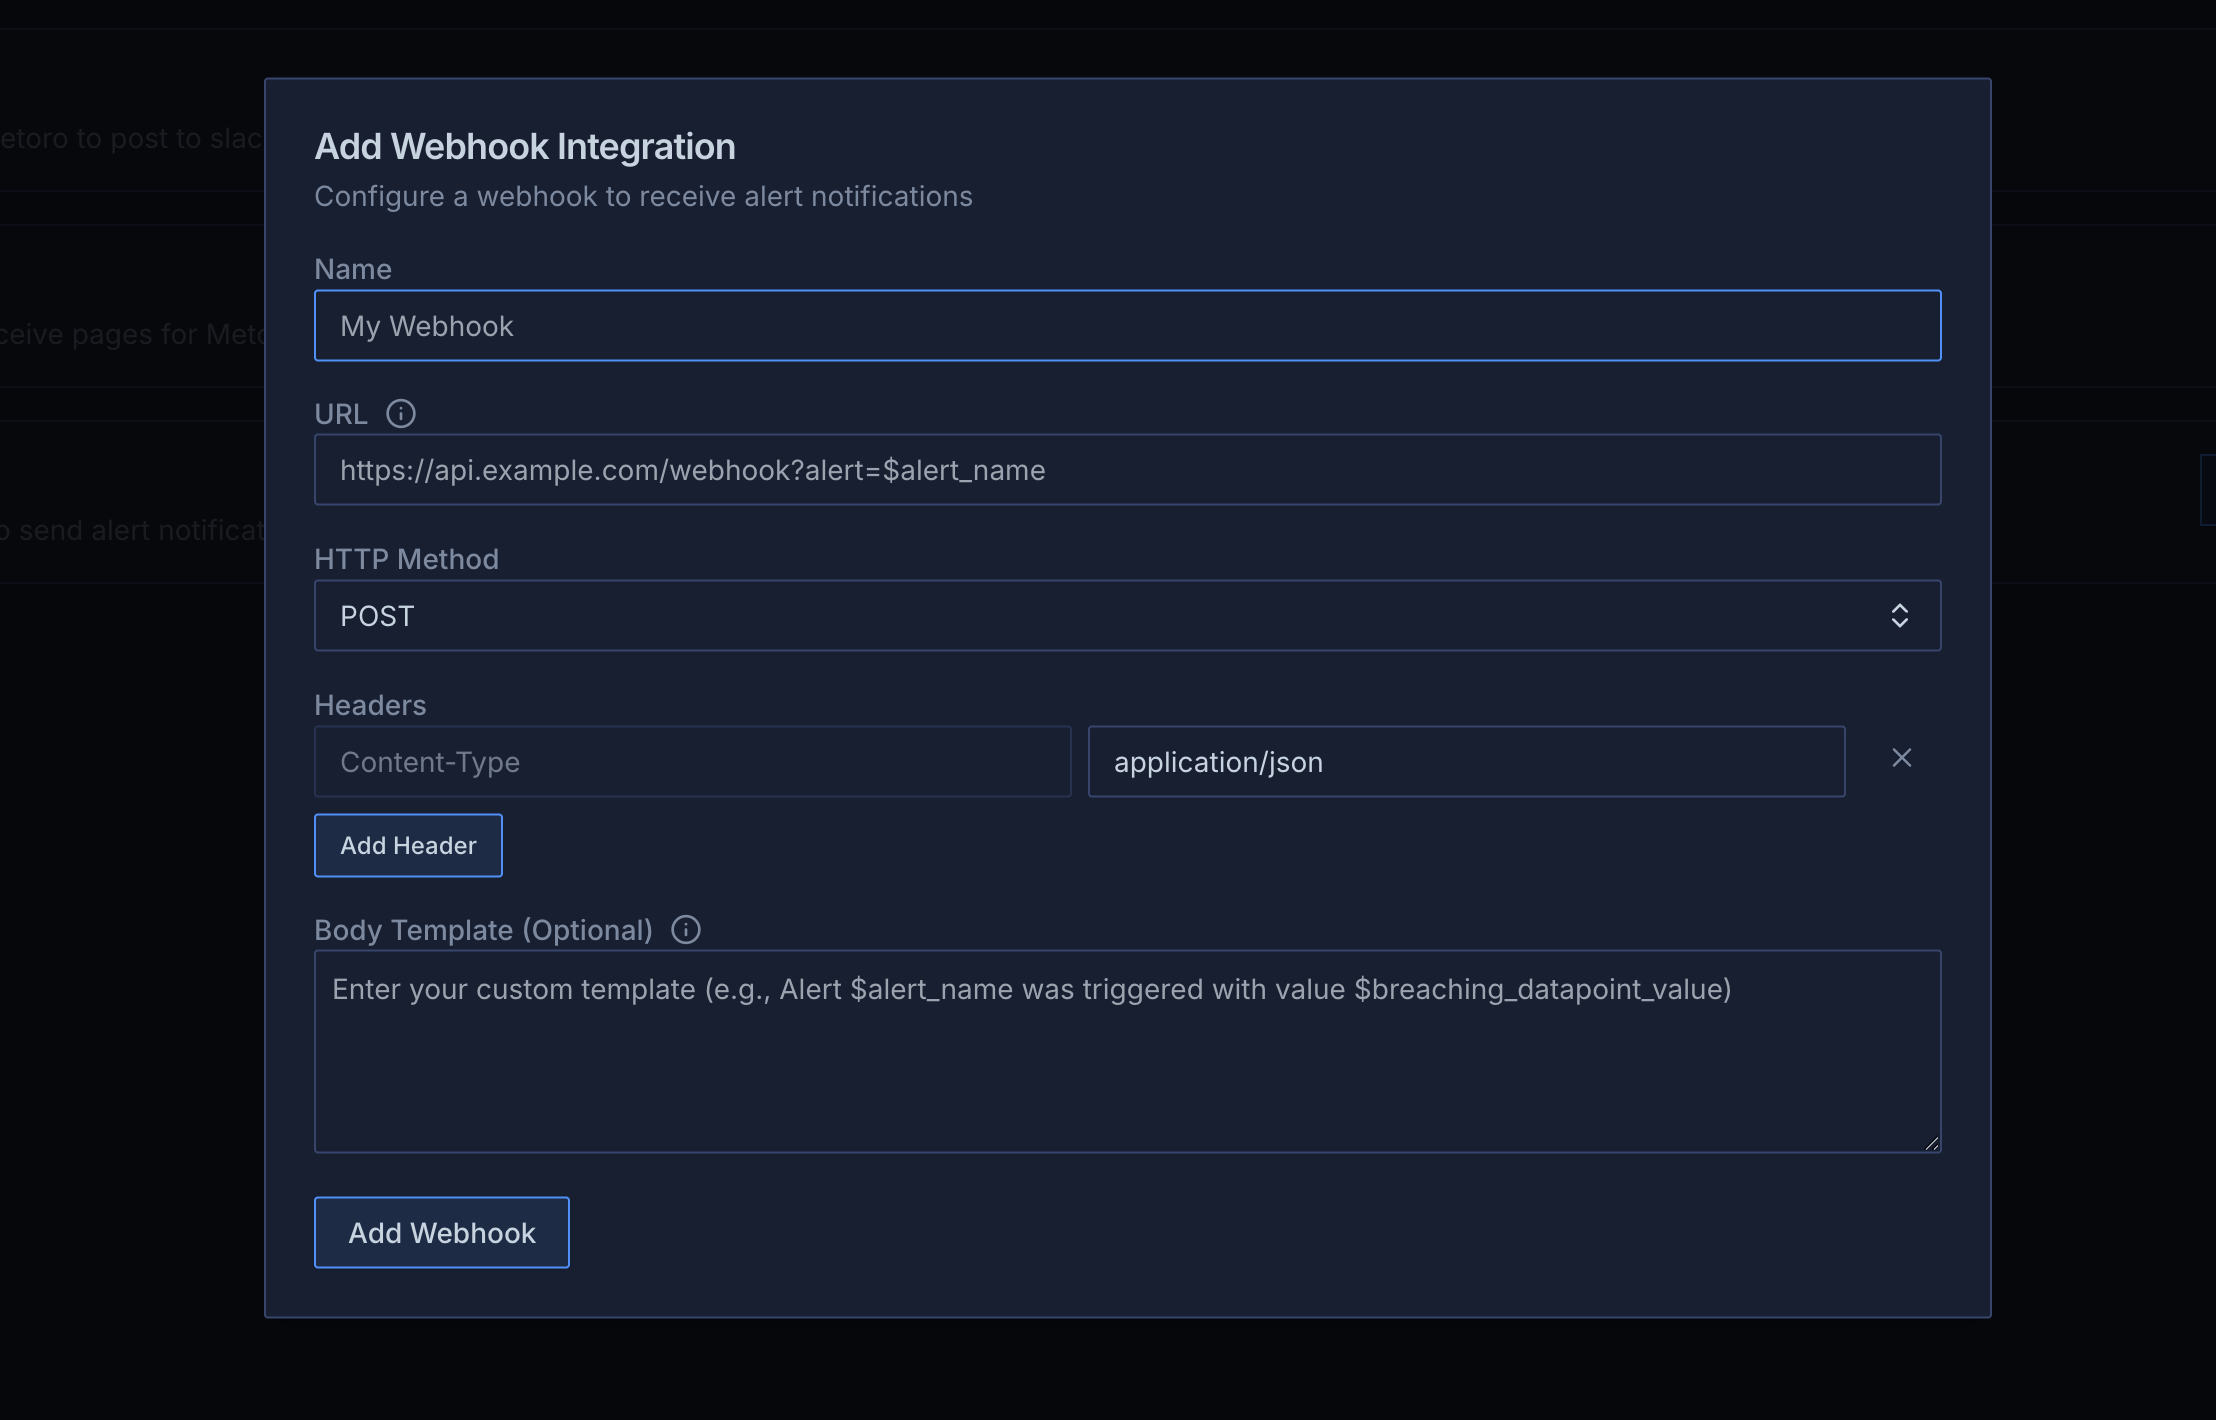
- Name (required): The name of the webhook
- URL (required): The URL of the webhook. You can use template variables in the URL for dynamic values (see template variables section below)
- HTTP Method: The HTTP method to use when sending the webhook. Default is
POST - Headers: Additional headers to send with the webhook. If you are sending a POST request,
Content-Typeheader is added by default with the valueapplication/json. You can add more headers by clicking on theAdd Headerbutton. - Body Template (optional): If you would like to send a custom body with the webhook, you can use the body template. Leave empty to use the default JSON payload. You can use template variables in your webhook body (see template variables section below).
Template Variables
You can use the following template variables in both the webhook URL and body template:$alert_name: The name of the alert$alert_description: The description of the alert$alert_uuid: The UUID of the alert definition$alert_fire_uuid: The UUID of the specific alert fire instance$alert_state: The state of the alert (either “firing” or “resolved”)$deep_link: Direct link to view the alert details in Metoro$environment: [Deprecated - use$attributesinstead] Environment context of the alert. It’s set for Kubernetes and Log alerts only or if the alert has a group by withenvironment$service: [Deprecated - use$attributesinstead] The service associated with the alert. It’s set for Kubernetes and Log alerts only or if the alert has a group by withservice.name/service_name/client.service.name/server.service.name.$fired_at: Unix Timestamp when alert was fired$resolved_at: Unix Timestamp when alert was resolved/recovered.$breaching_datapoint_value: The last metric/trace value that triggered the alert. It’s set for Trace and Metric alerts only.$breaching_datapoint_time: Unix Timestamp of the last breaching value. It’s set for Trace and Metric alerts only.$metric_name: Name of the metric that triggered the alert. It’s set for Trace and Metric alerts only.$attributes: List of attribute key and value pairs (inkey: valueformat) for which the alert is firing. Only set when you use a group by in your alert.
Examples
URL Examples
You can include template variables directly in your webhook URL:Body Template Examples
- JSON format:
- Plain text format:
- XML format:
Remember to set the
Content-Type header in the headers section with the appropriate value.