
Log Search and Performance
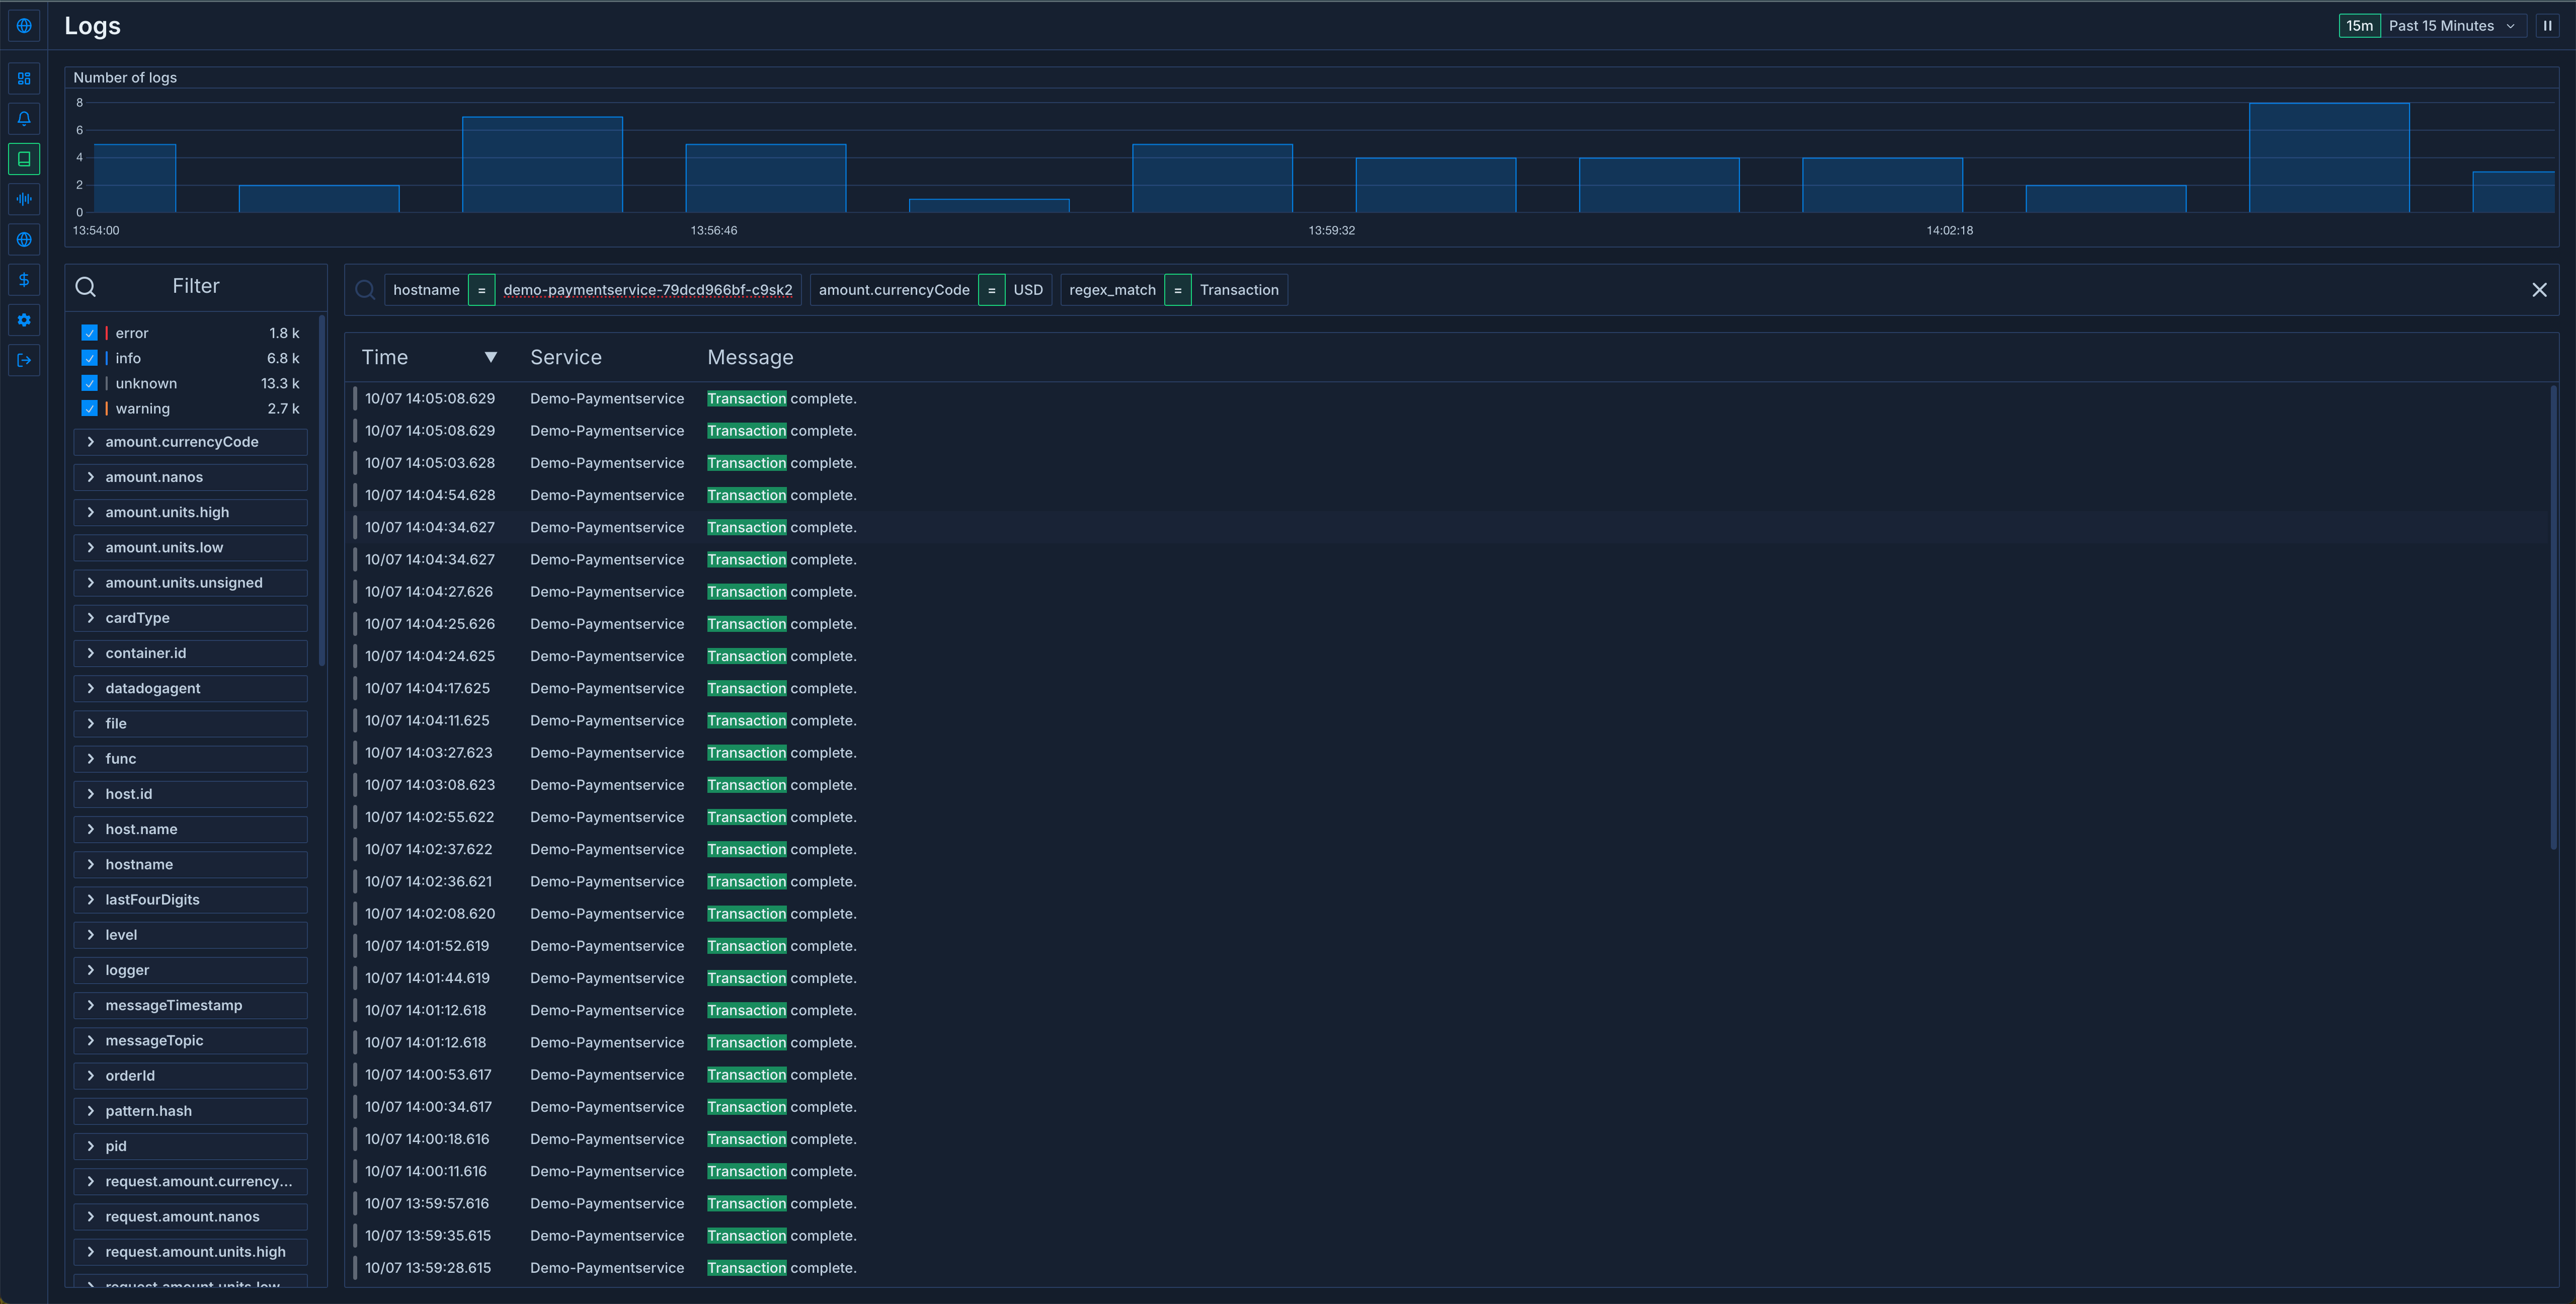
The log view allows you to filter logs using multiple methods:- Regex search using re2 format
- Attribute-based filtering
- Time range selection
- Clauses are combined with AND, by default
attribute = regex: <re2 expression>. For example:
service.name = regex: .*metoro.*will match logs from any service containing “metoro”message = regex: error|warningwill match logs containing “error” or “warning”kubernetes.container.name = regex: ^api-.*will match containers starting with “api-”
Default Attributes
Each log entry is automatically tagged with several default attributes:- Container ID (the unique id of the container that emitted the log)
- Environment
- Namespace (the namespace the container belongs to)
- Service name (the service the container belongs to)
- Host (source of the log)
Structured Logs
Metoro automatically parses structured JSON logs and other formats like LogZero, making every field searchable. Key features include:- Automatic parsing of JSON log formats and LogZero format
- Flattening of nested JSON structures using dot notation
- Every key and value is indexed for searching
- Similar search performance to regex searches when filtering by specific JSON fields
Log Clustering and Hashing
Metoro implements an intelligent log clustering system that:- Assigns unique hashes to similar log lines
- Groups logs that are similar but differ in dynamic elements (like timestamps)
- Enables searching for similar types of errors using hash-based clustering
- Helps identify patterns in your logs more effectively
Logs in Trace Context
Metoro now provides integrated log viewing within the trace view, allowing you to:- View all logs associated with a trace by clicking “View Logs” in the trace header
- See logs for specific spans by selecting a span and switching to the “Logs” tab
- Automatically filter logs by
traceIdorspanIdbased on your selection - Maintain full context while debugging issues without switching views
Log Analytics and Alerting
Beyond basic log viewing and searching, Metoro provides advanced analytics capabilities:- Chart log volume over time - apply filters and group logs by any attribute
- Create visualizations filtered by specific log patterns
- Build alerts based on log patterns and frequencies
Bring your own Logs (OpenTelemetry Log Ingestion)
In addition to automatically collecting container logs, Metoro supports ingesting logs from any source that implements the OpenTelemetry protocol. This allows you to:- Send logs from applications running outside your Kubernetes cluster
- Integrate existing logging pipelines with Metoro
- Maintain a unified logging experience across all your infrastructure