Optimizing Go Performance with GOMAXPROCS
Learn how to solve unexpected performance issues in Go applications by correctly configuring the GOMAXPROCS parameter for optimal CPU usage in containers
Recently we had an unexpected performance degradation in one of our go workloads to the tune of nearly 2x expected cpu usage. Turns out the issue was that we didn’t explicitly set the GOMAXPROCS go runtime parameter. We’re going to run through the investigation, what we found and how we fixed it. If you want the lower-level background on the telemetry path behind this debugging workflow, read how Metoro uses eBPF.
Background
Metoro is an observability platform for systems running in Kubernetes. In order to collect telemetry about the cluster and the workloads running in it, we deploy a daemonset to monitored clusters. This deamonset creates a pod on each host called the node-agent which collects information about workloads and sends it out of the cluster to be stored.
The node agent instruments a number of kernel operations through eBPF to automatically generate distributed traces and other telemetry, this means that the cpu usage of the node-agent scales with the number of requests being made to / from pods on a node. Typically a node-agent can expect to use around a 1 second of cpu time (on up to date EC2 hosts) to process 12,000 HTTP requests.
The problem
We were deploying to a new customer cluster when we noticed that some of our node agents were using much more cpu than we expected. Hosts in this cluster were processing up to 200,000 requests per minute, so in a single minute we should expect the node-agent to use around 17 seconds of cpu time (28% of one core) to process these requests. Instead, we noticed that the node-agent was using 30 seconds of cpu time (50% of one core), this nearly 2x what we would expect for that workload.
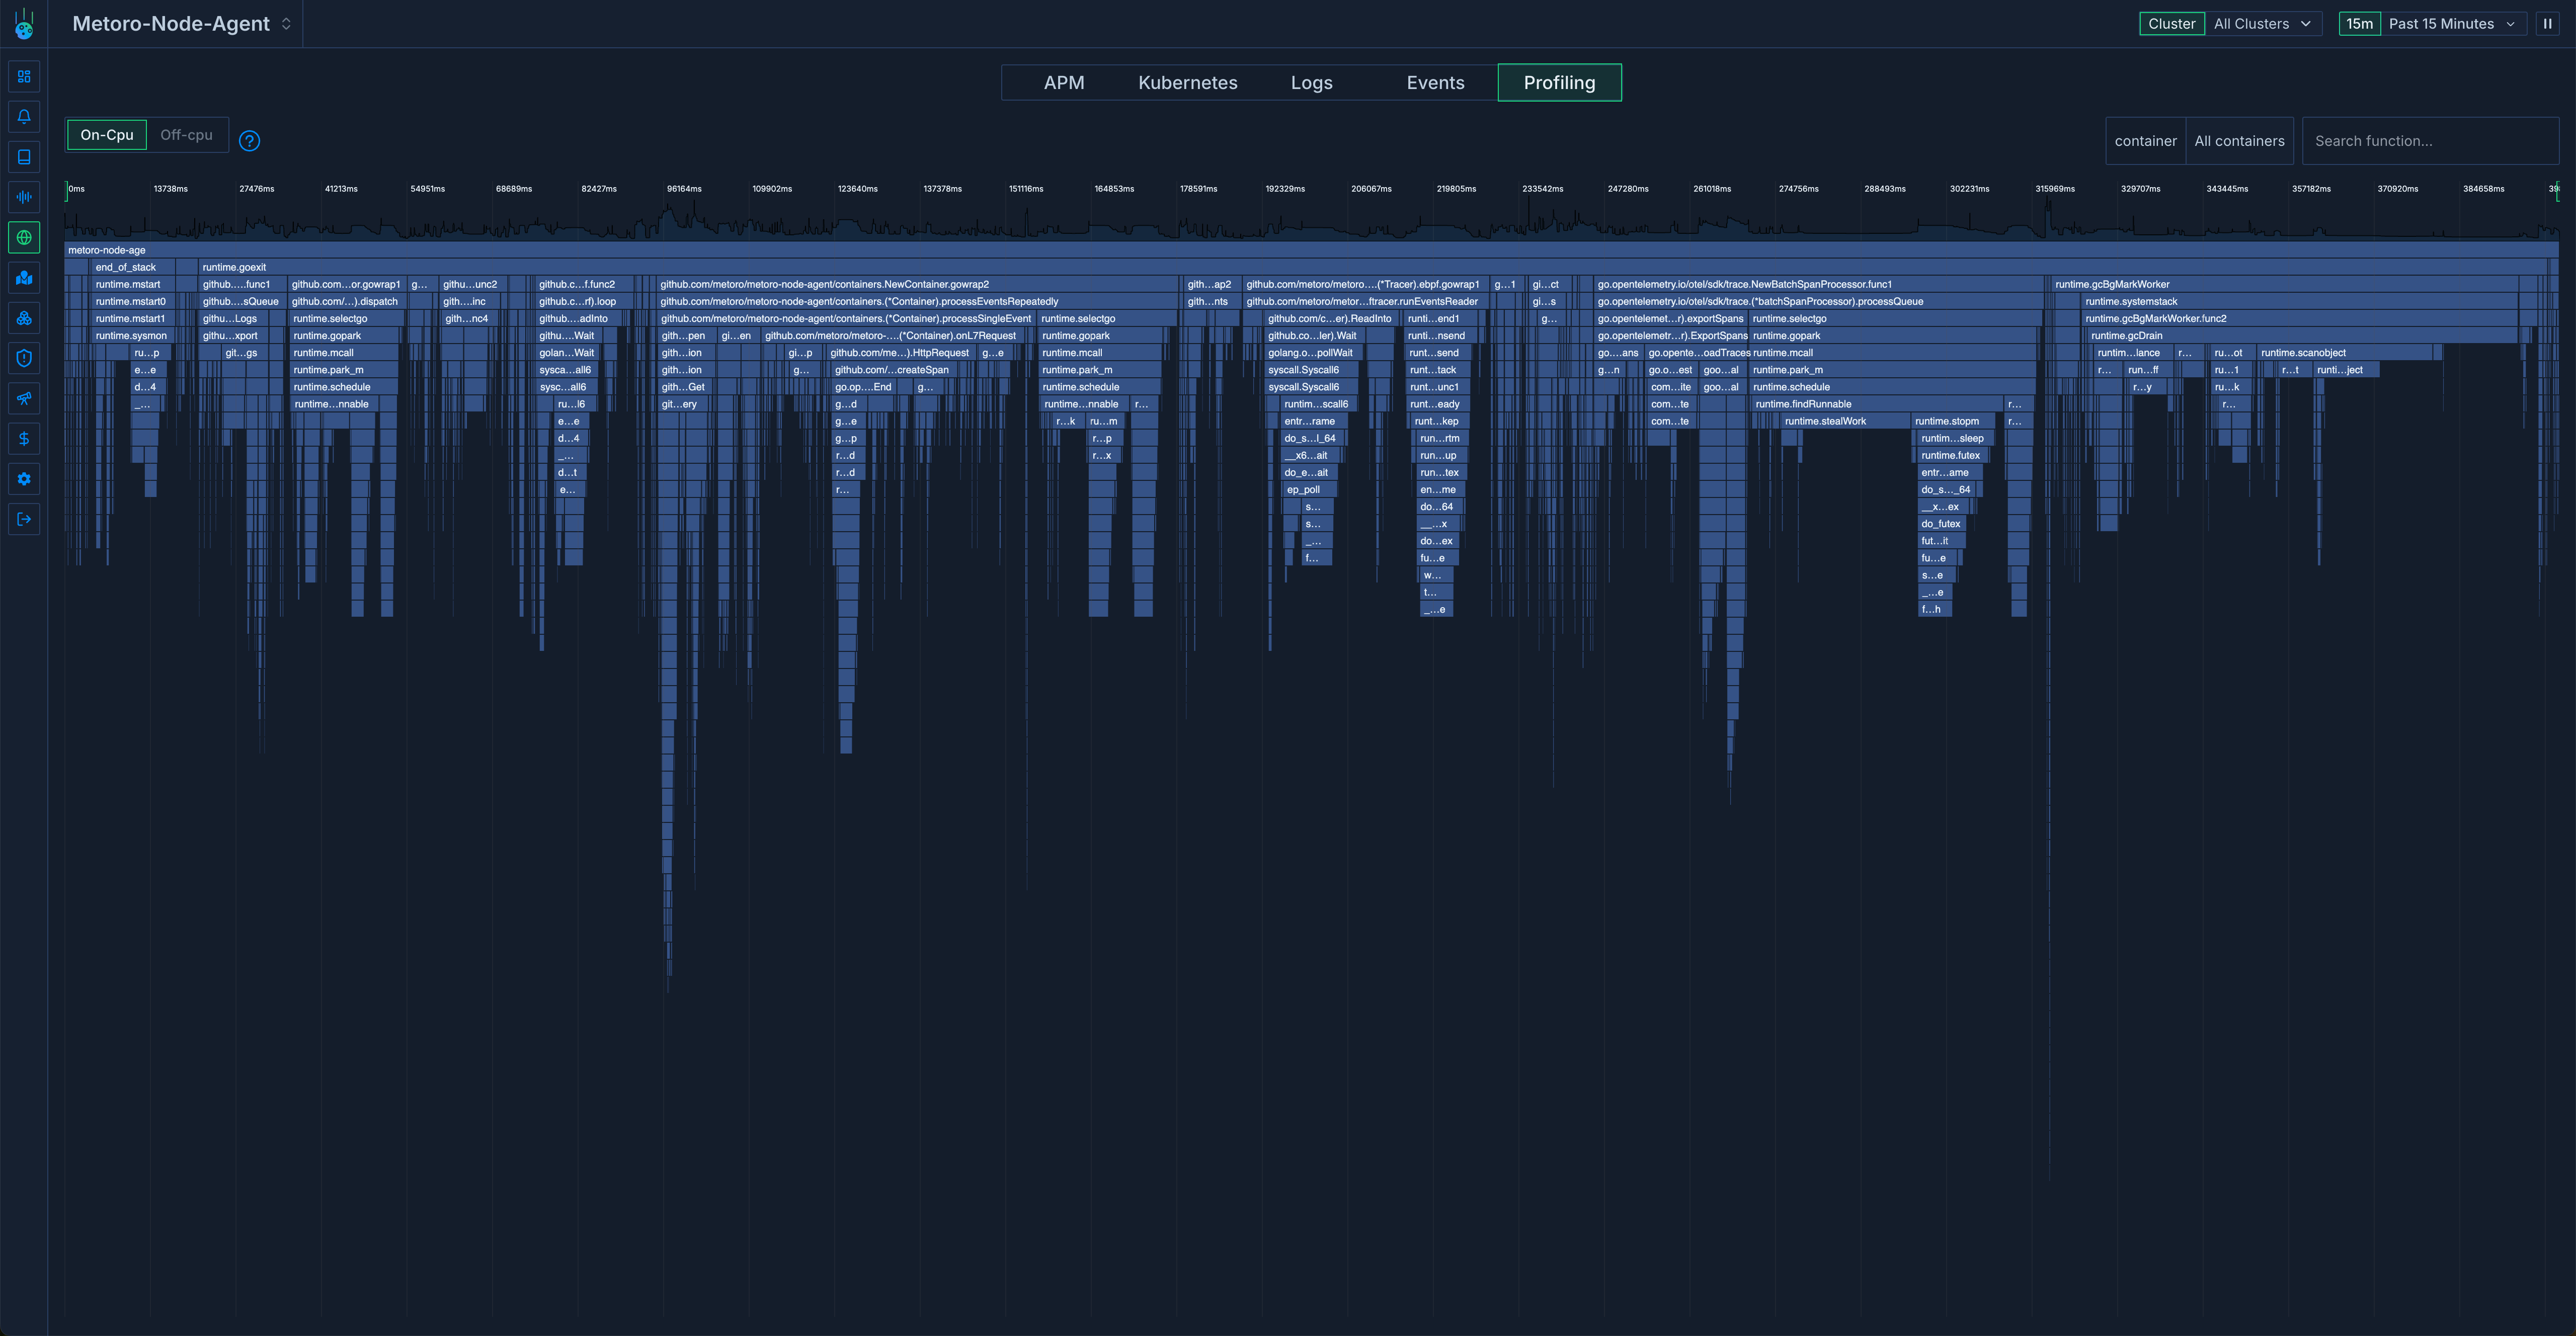
Thankfully Metoro runs an eBPF based CPU profiler which we can use to inspect its own cpu usage. This is what we saw.

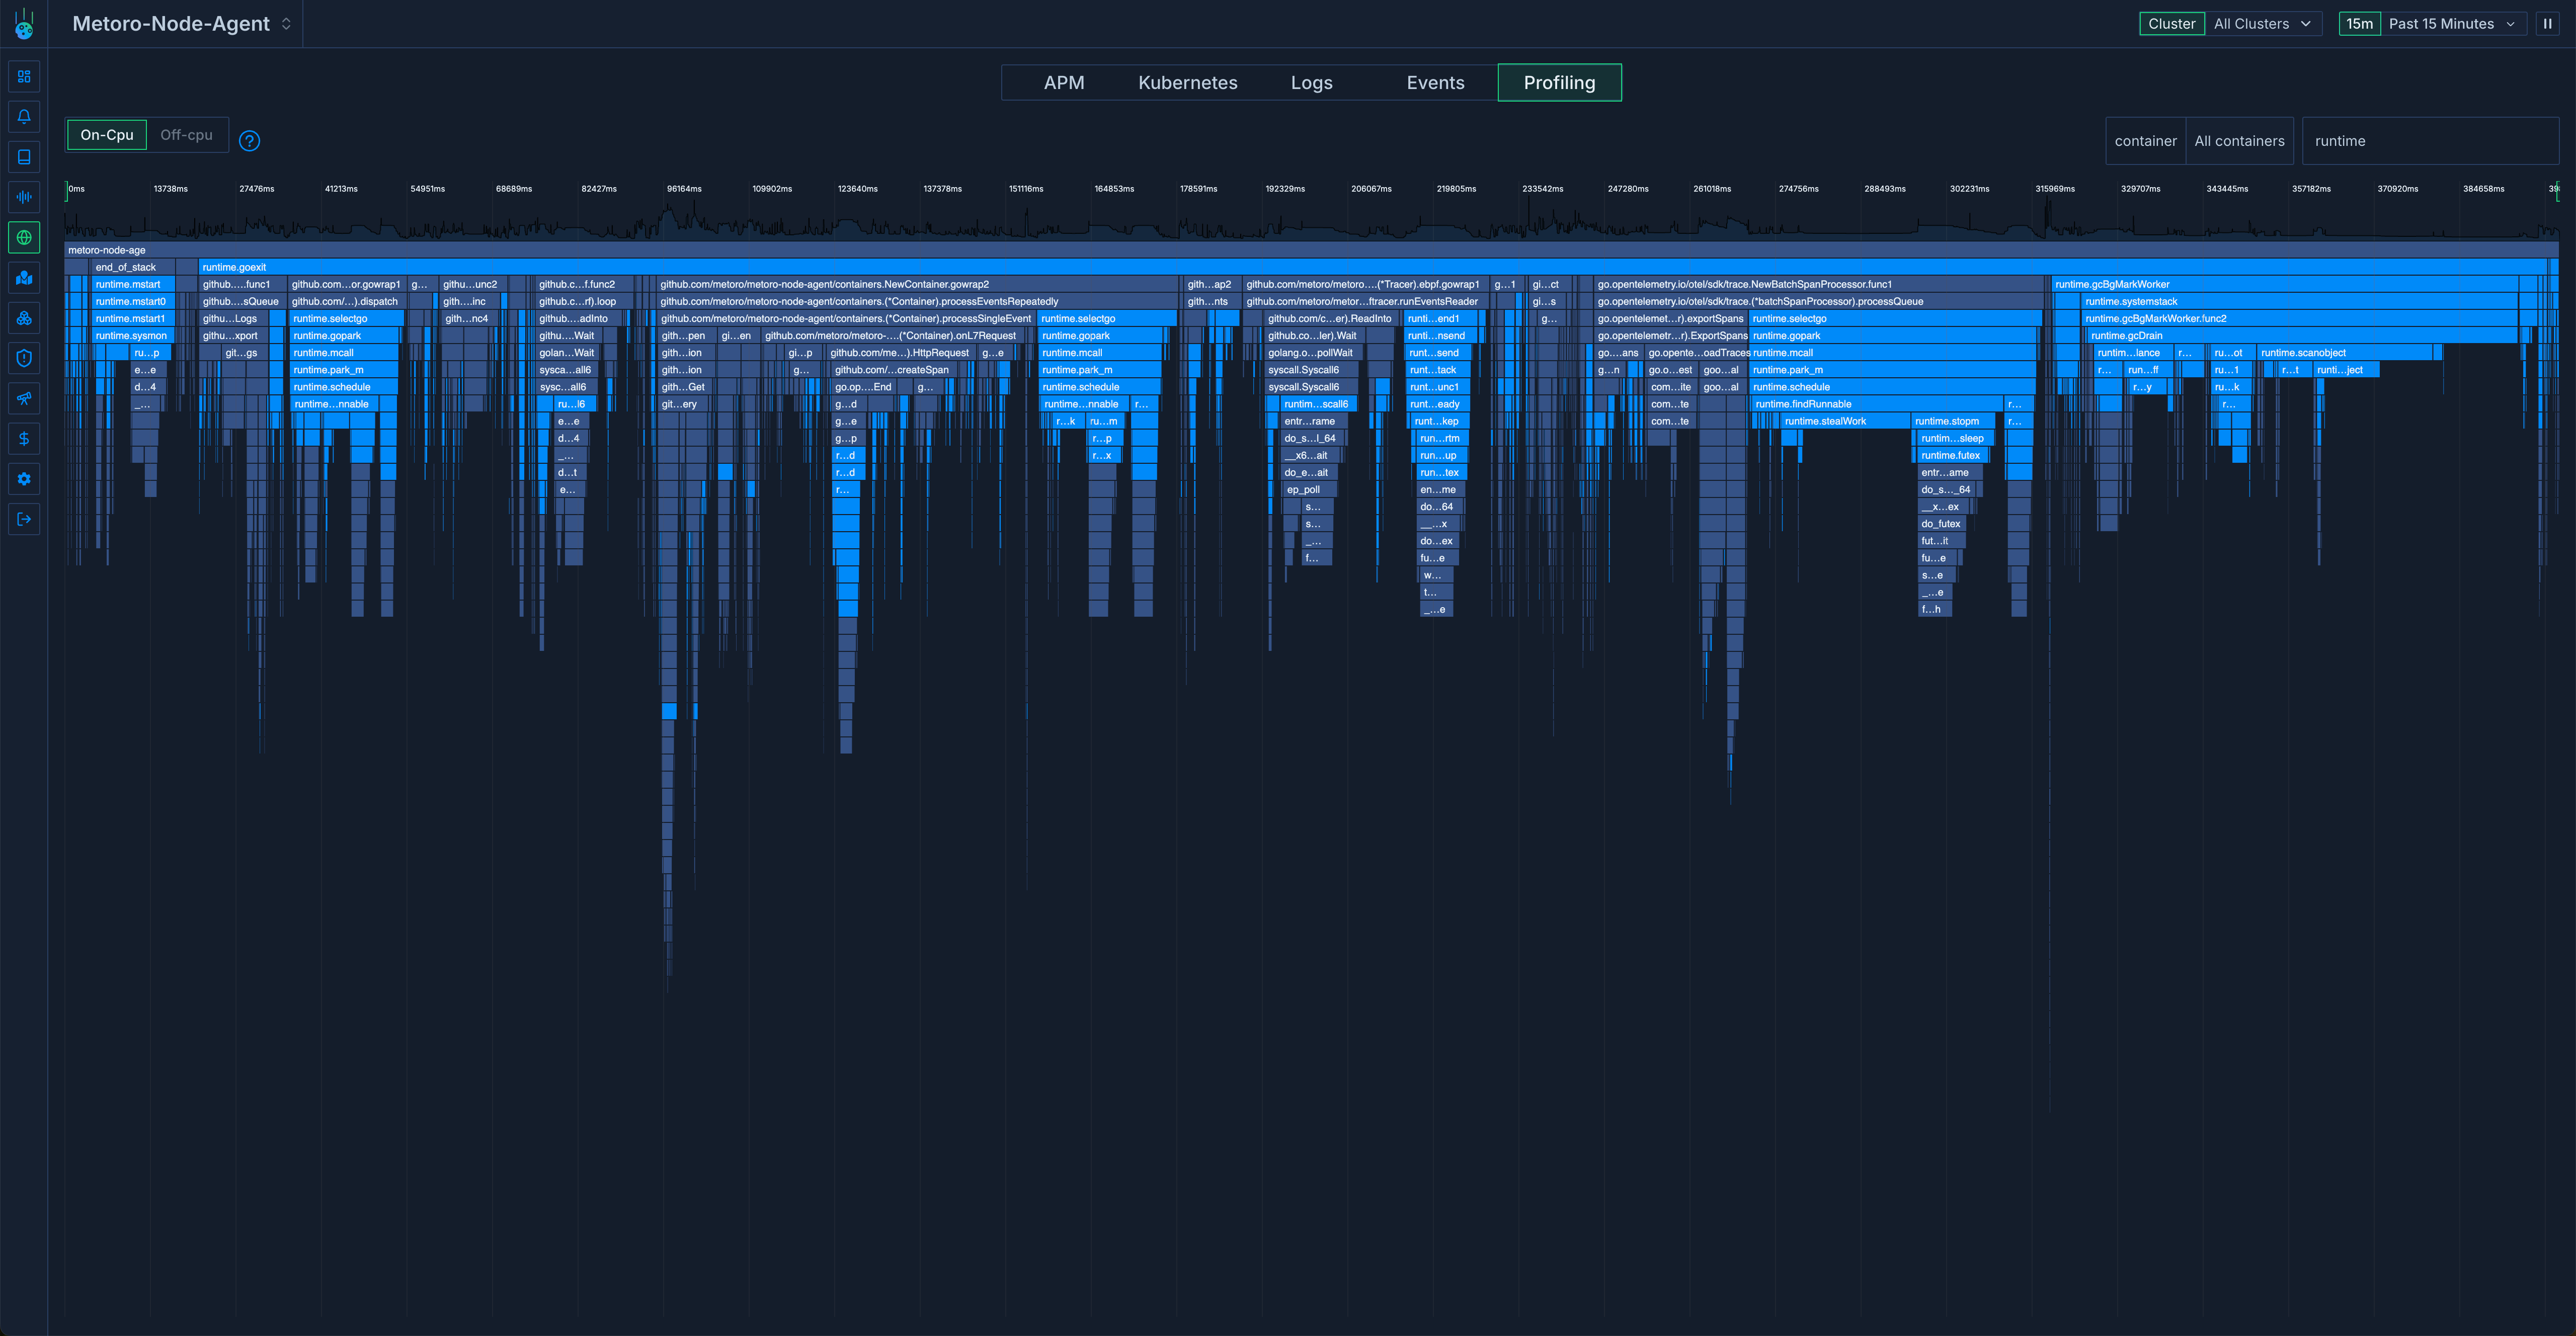
At first glance something stood out: the go runtime functions were using a lot of cpu time. Here’s the same chart with the go runtime functions highlighted.

There were two main consumers of CPU usage:
-
runtime.schedule- ~30% of cpu usage -
runtime.gcBgMarkWorker- ~20% of cpu usage
runtime.Schedule seems to be responsible for finding goroutines to run + starting them on an OS thread. runtime.gcBgMarkWorker seems to be responsible for figuring out which pieces of memory can marked to be cleaned up by the garbage collector later.
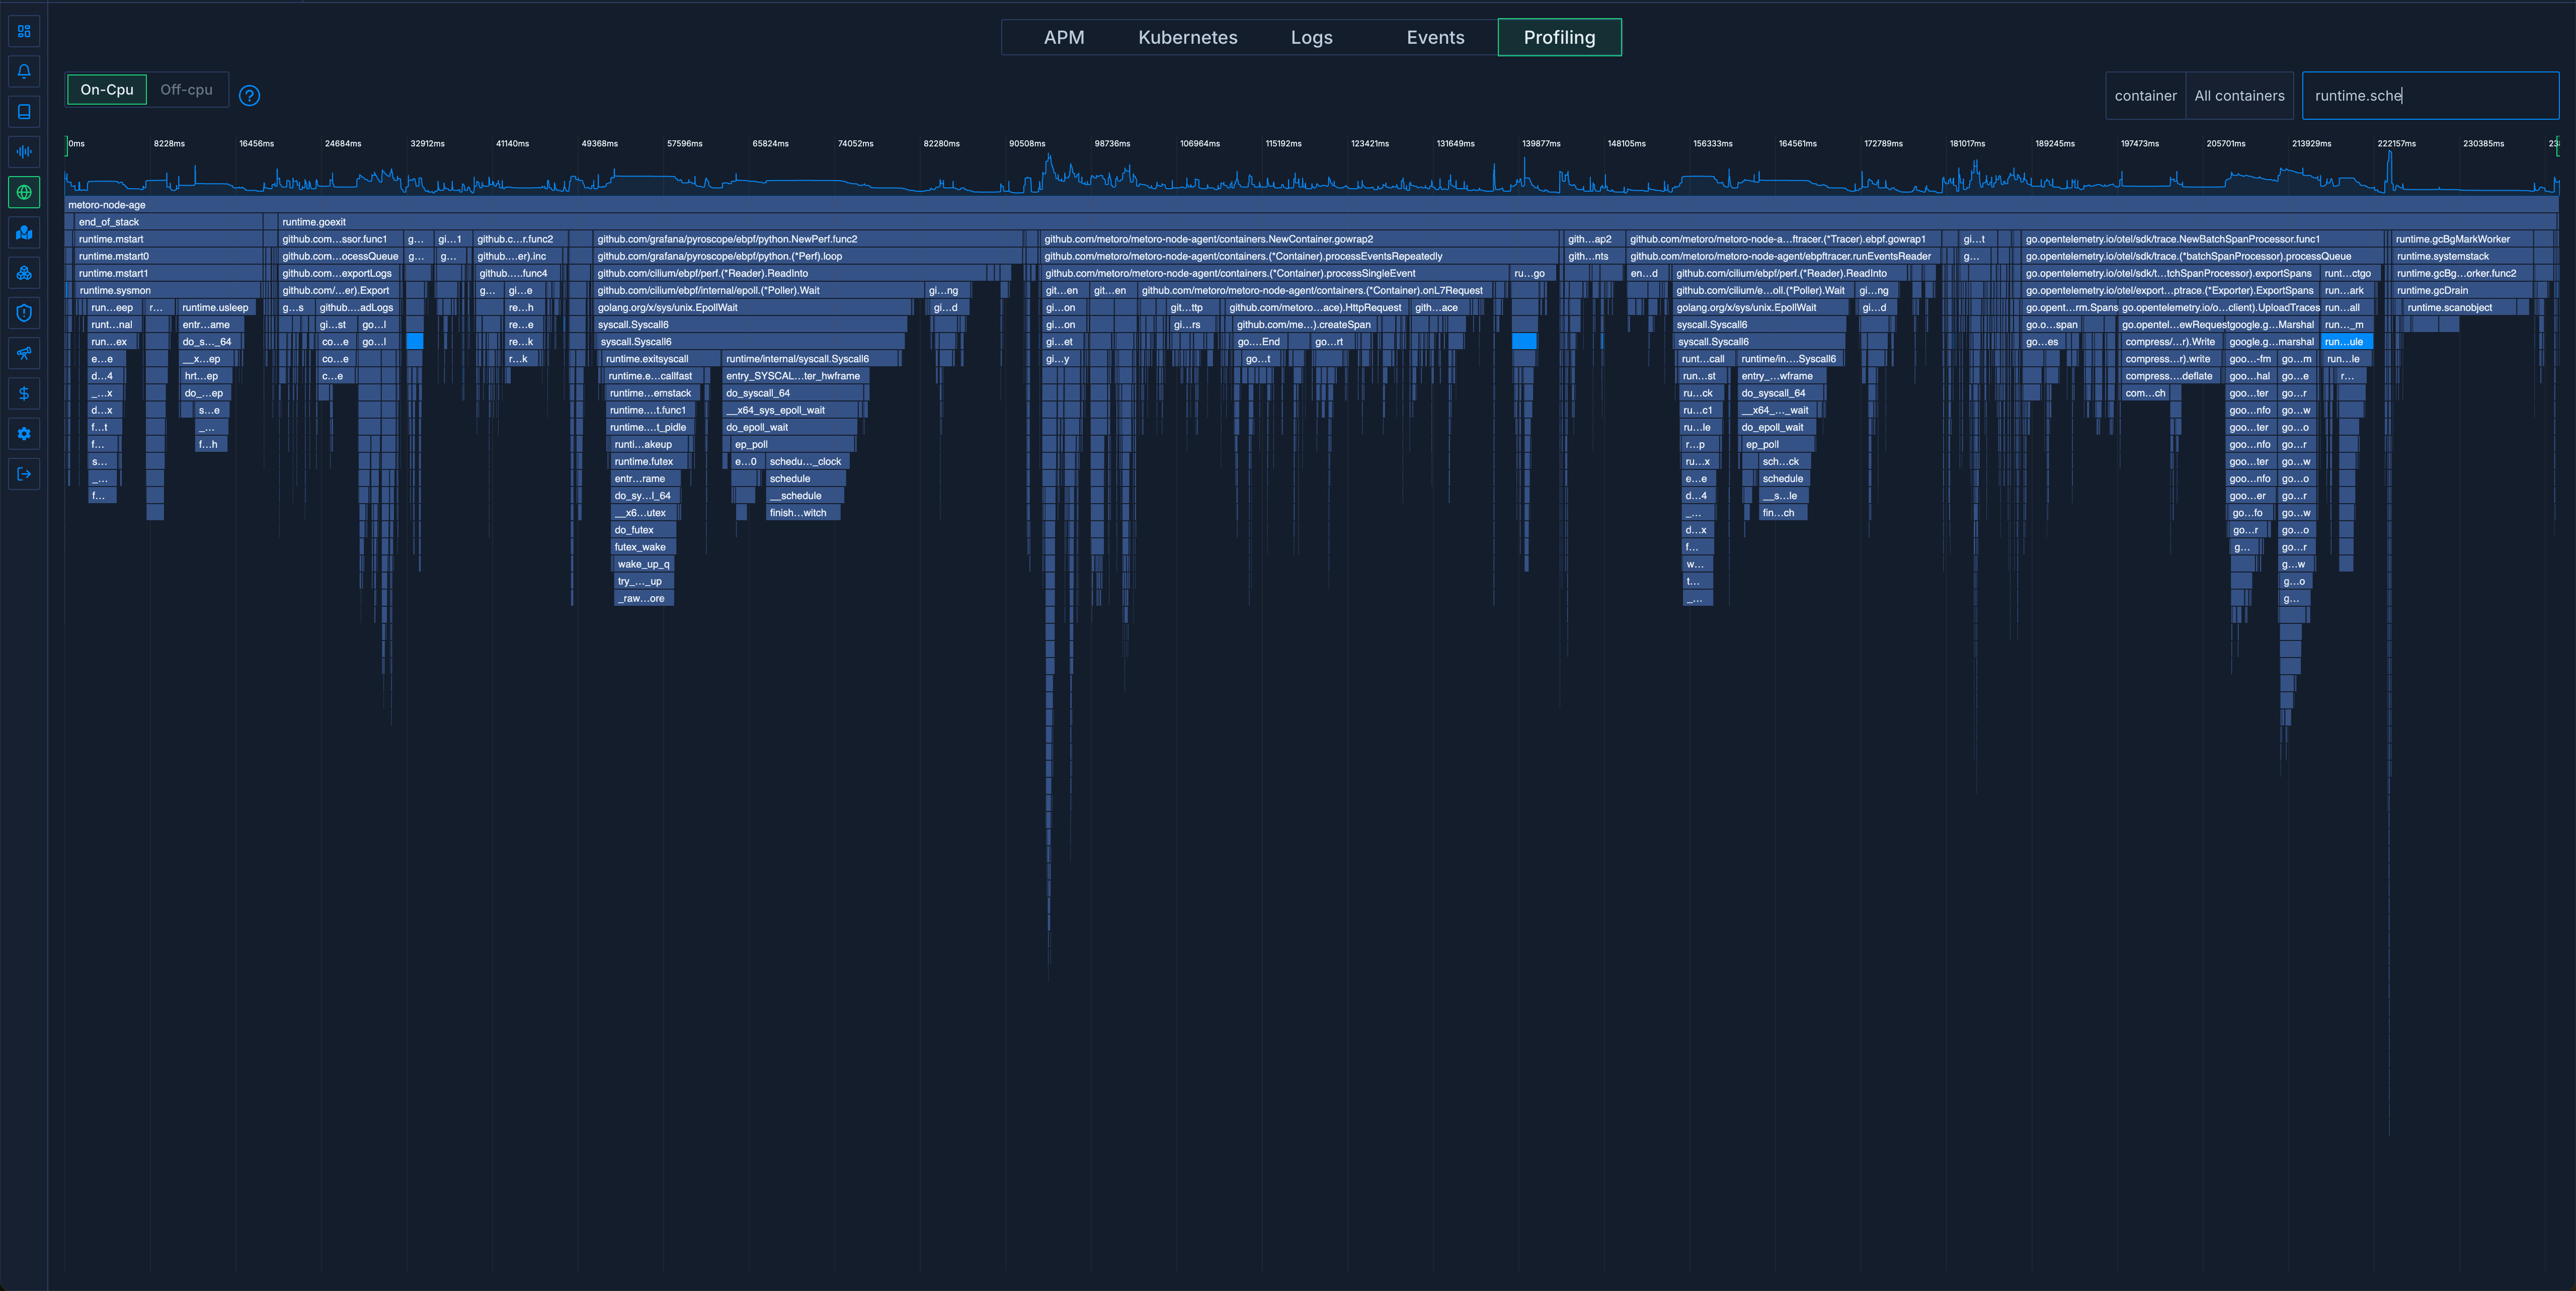
Wanting to understand why this was, we set up a reproduction in a dev cluster with the same number of requests. This is what we saw:

The highlighted area is runtime.Schedule - just 5% this time. runtime.gcBgMarkWorker was another 6%.
Our reproduction failed. We started looking at other differences in the environment until we looked at the host size. The node-agent using 50% of its cpu time on go runtime functions was on a 192 core host. Our reproduction was running on a 4 core host. We added a 192 core host to our cluster, ran the experiment again. Reproduction! 50% of time was being spent in the two go runtime functions.
This was perplexing. Why would the go runtime use 5x more cpu usage on a bigger host when the go program itself wasn’t doing anything differently?
Lots of googling later, we came across a couple of github issues linking high runtime cpu usage and GOMAXPROCS.
So what is GOMAXPROCS? According to the docs:
The GOMAXPROCS variable limits the number of operating system threads that can execute user-level Go code simultaneously. There is no limit to the number of threads that can be blocked in system calls on behalf of Go code; those do not count against the GOMAXPROCS limit.
Okay, so how is this set, we aren’t explicitly setting it, so what’s the default?
In the go source code:
	procs := ncpu
	if n, ok := atoi32(gogetenv("GOMAXPROCS")); ok && n > 0 {
		procs = n
	}
So it’s ncpu if we don’t set it. ncpu is calculated differently depending on the OS and with linux it gets a bit gnarly: it ends up being the number of set bits in the CPU mask at program creation time. This is generally the number of cores on the host but can actually be a bit different.
This now makes sense, these two functions: runtime.Schedule and runtime.gcBgMarkWorker scale with the number of os processes used by the go program which is 192 on our big host and only 4 on our small host. That’s why they’re using so much more cpu time.
This default value is not particularly useful if you’re running in a containerized environment. In this environment, it’s likely that many other containers are running on the same host and your program is only allocated a small percentage of the host.
In our case we have a default cpu limit on the node-agent of a single core so that we don’t impact customer workloads. So in our case we’d want GOMAXPROCS to be 1 as we can’t utilise more than 1 core anyway so anything over a single OS thread is overkill.
So how do we fix this?
The solution
We need to set GOMAXPROCS to a more reasonable value. There’s prior art here from folks who’ve run into the same issue:
-
https://github.com/uber-go/automaxprocs - A library that sets
GOMAXPROCSequal to the container cpu quota programatically -
The kubernetes downward api - Allows you expose pod / container fields to a running container through environment variables
We’re always running in k8s so we decided to use the downwards api to set the GOMAXPROCS environment variable on the node-agent container at deployment time. It looks like this.
env:
  - name: GOMAXPROCS
    valueFrom:
     resourceFieldRef:
       resource: limits.cpu
       divisor: "1"
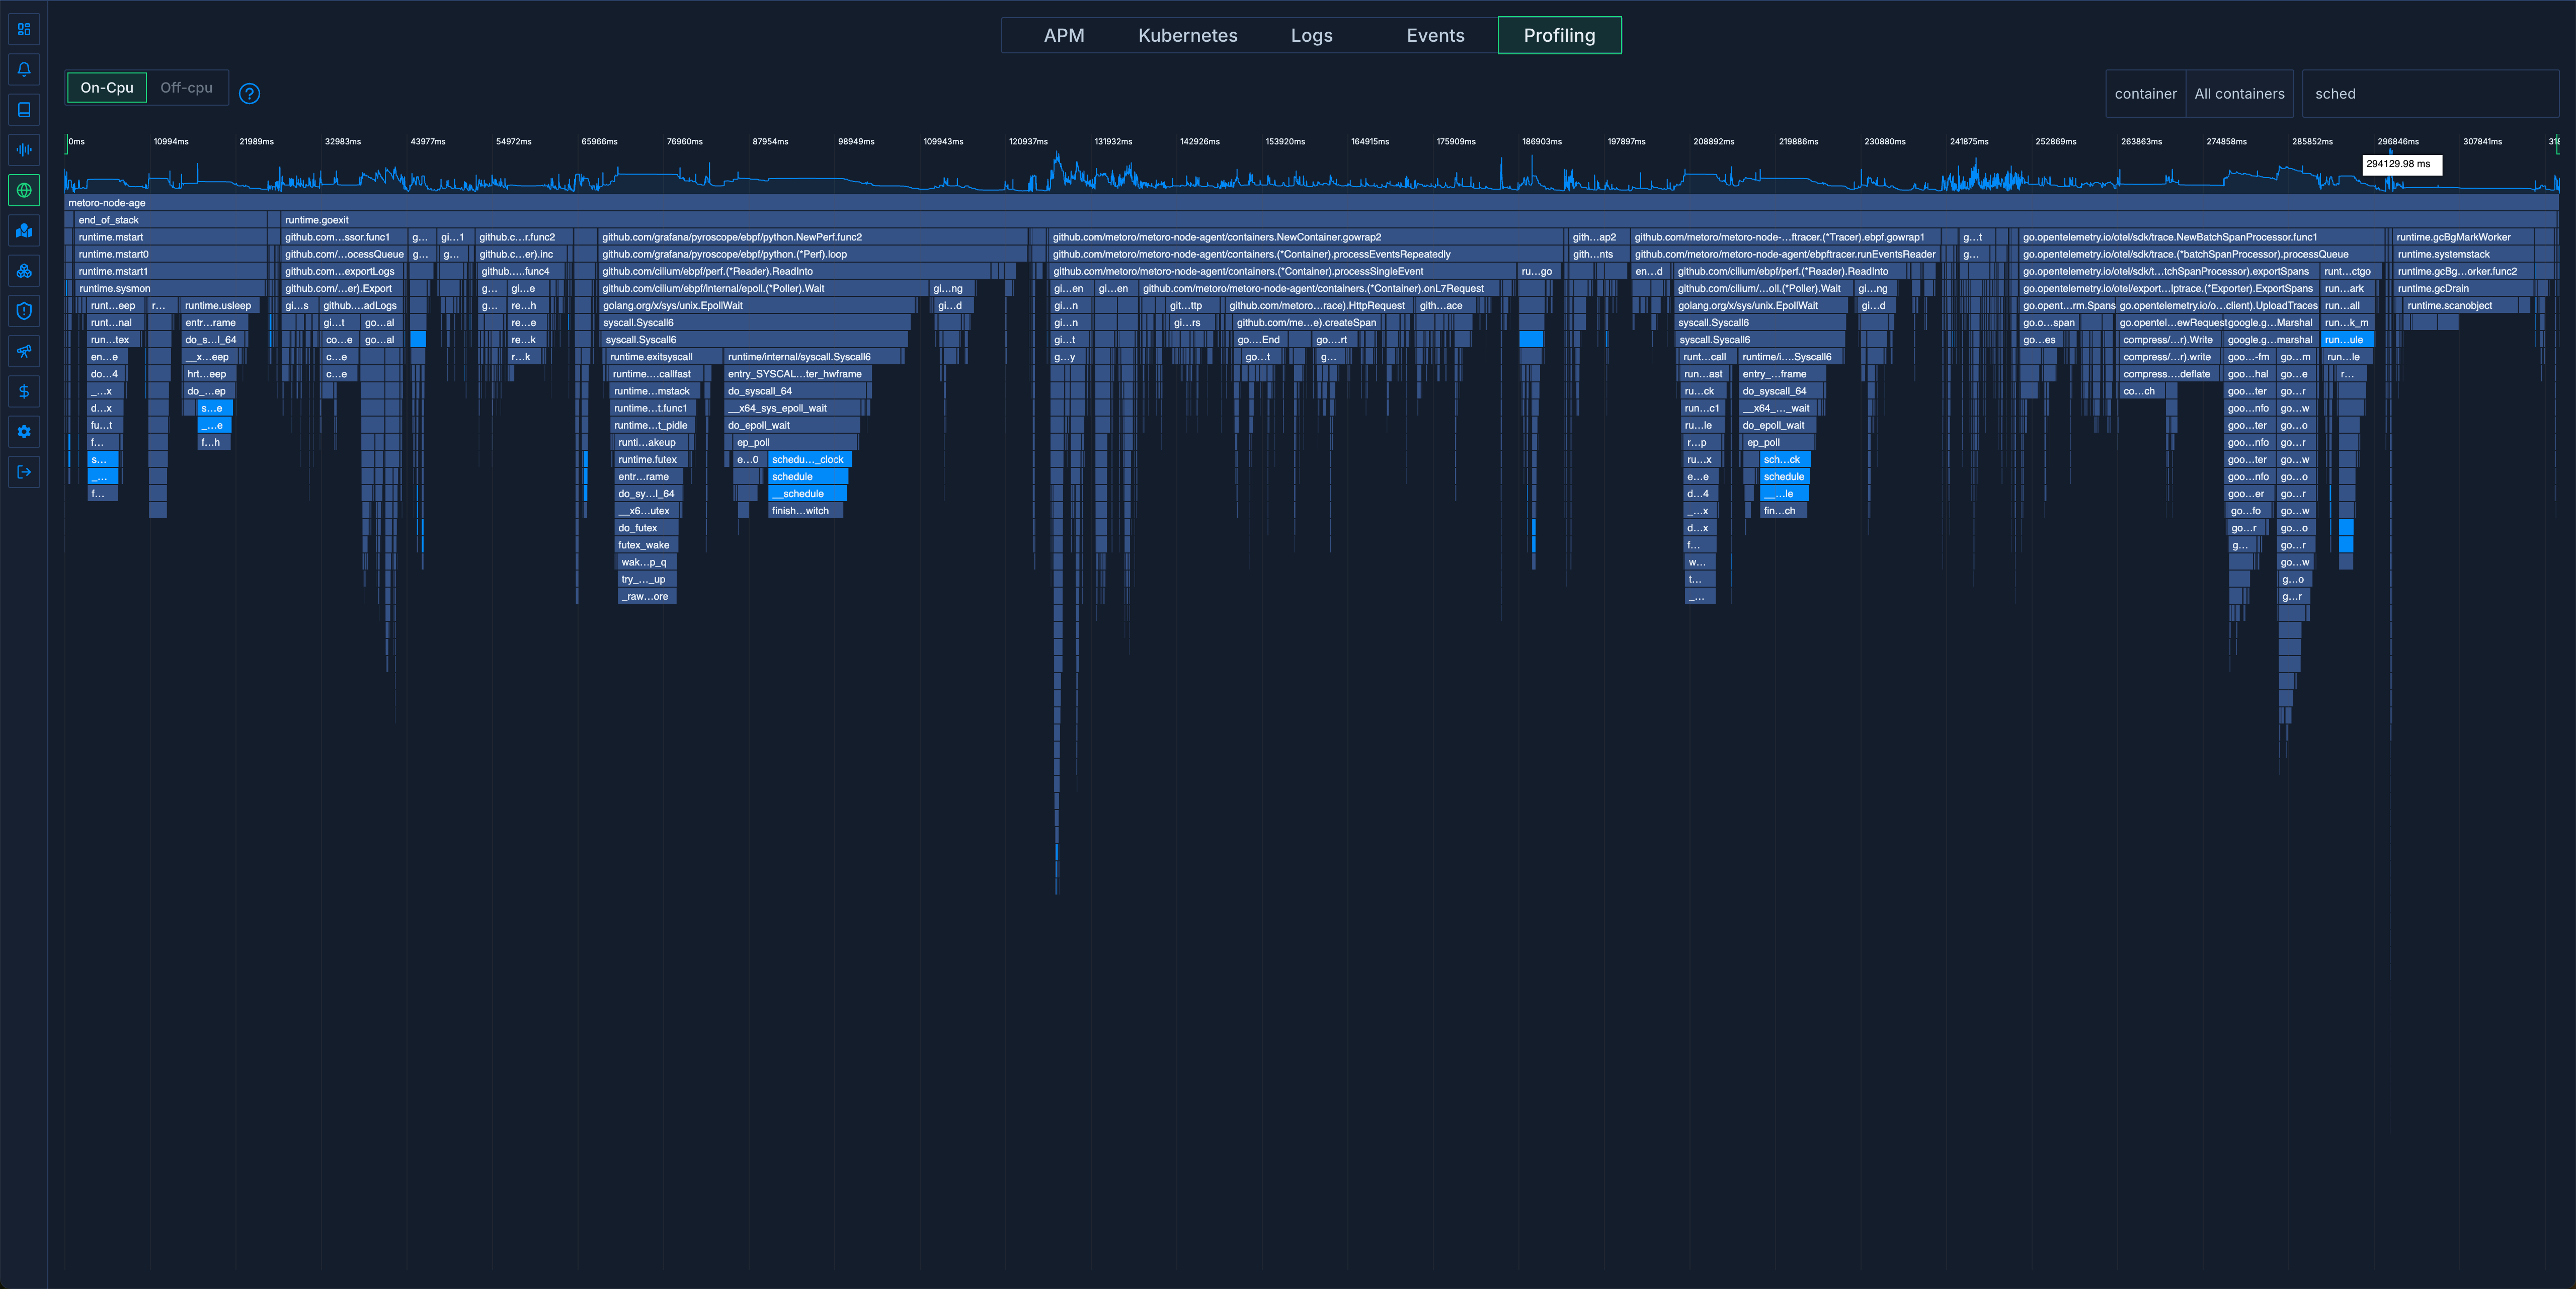
Running the benchmark on our 192 core host again gave us the expected cpu usage and the following flame-graph:

Back to normal!
Related reading
More Metoro articles that deepen the same topic from another angle.
How Metoro Uses eBPF for Zero-Instrumentation Observability
A technical deep-dive into how Metoro captures L7 protocol traffic and intercepts TLS-encrypted data using eBPF, enabling automatic observability without code changes
Read article →eBPF Auto Instrumentation in Kubernetes Landscape
Understand ebpf, how it can be used in kubernetes and what tools are currently out there
Read article →Kubernetes Observability: The Complete Guide
Learn what Kubernetes observability is and how to implement effective observability for your k8s clusters.
Read article →