Published:
8 min read

Understand ebpf, how it can be used in kubernetes and what tools are currently out there
In this post, we're going to briefly go over what eBPF is and how it can help you with observability in k8s. Then we'll run through a breakneck tour of what's out there. You should be able to go from not knowing what eBPF is to understanding the concept of eBPF and being able to do your own research by the end of the post.
If you want a deeper implementation walkthrough after this survey, read how Metoro uses eBPF for zero-instrumentation observability.
At a satellite level view, eBPF allows you to run sandboxed code inside the linux kernel[1], that’s it.
It might sound like a fairly trivial feature at first, but there are extremely far reaching applications for security, networking and of course observability which we’ll be talking about in this post.
The things you need to know about eBPF in the context of observability are:
eBPF programs are event driven. You write handlers which are called when one of a number of different things happens. For example: when the write syscall is made, increment my counter. The combination of a bunch of handlers is an eBPF program.
eBPF programs can store state in shared maps. These maps can be accessed by other eBPF programs or by user space programs.
These two features let us do something like increment a counter every time I make a write syscall and store the value in a map, then have a user space program periodically report that value somewhere over the network. And that’s a basic way of getting observability into the kernel via eBPF!
Not only is this interesting, we don’t need to change our application code in anyway to get this information. So we can pull out observability information for any program we wish.
Okay so why does this play so nicely with Kubernetes? Well Kubernetes at its core is a container orchestration platform. Containers are built on top of cgroups. You can scope down an eBPF program to a cgroup.
So that’s pretty cool. Now it’s possible to write eBPF programs to generate all sorts of detailed information at the container / pod level.
Not only is it possible, plenty of people have done it and in this post we’ll be doing a break neck tour of the landscape of eBPF observability specifically for k8s. If you’re interested in deep dives on any of the projects let me know and I’ll write another post.
There are a pretty massive number of eBPF based projects, we’ve focussed on the k8s projects here. Before you dive in I’ll give you a quick list by features so you can jump to the relevant sections:
Network Observability - Cilium/Hubble, Pixie, Caretta, Beyla, NetObserv, Anteon, Odigos
Service Observability: Pixie, Beyla, Anteon
Service Profiling - Parca, Wachy
Security Observability - Tetragon
Cilium is a bit of a beast. Cilium (the organisation) has three main open-source offerings.
Cilium
Hubble
Tetragon
The Cilium project itself is a CNI for Kubernetes. CNIs are plugins that deal with networking in Kubernetes, they’re responsible for connecting pods, provisioning IPs, applying networking configuration, security policies etc. The result is that pods can communicate on a flat L3 network. Cilium heavily leverages eBPF to construct the network.
After you leverage Cilium as the CNI for your cluster, you can then use Hubble. Hubble allows deep visibility into the networking in your cluster which is orchestrated through Cilium. Hubble inspects network traffic to automatically generate a service graph and metrics on networking at a pod level which you can then export to your observability provider of choice.
Tetragon is orthoganal to Cilium and Hubble, you can use it without using Cilium as your cluster’s CNI. Tetragon’s focus is on runtime security. In the context of Kubernetes, this consists of monitoring (and reacting to) events caused by a container. Tetragon can monitor a bunch of things from syscalls, to file accesses to process lifecycle.
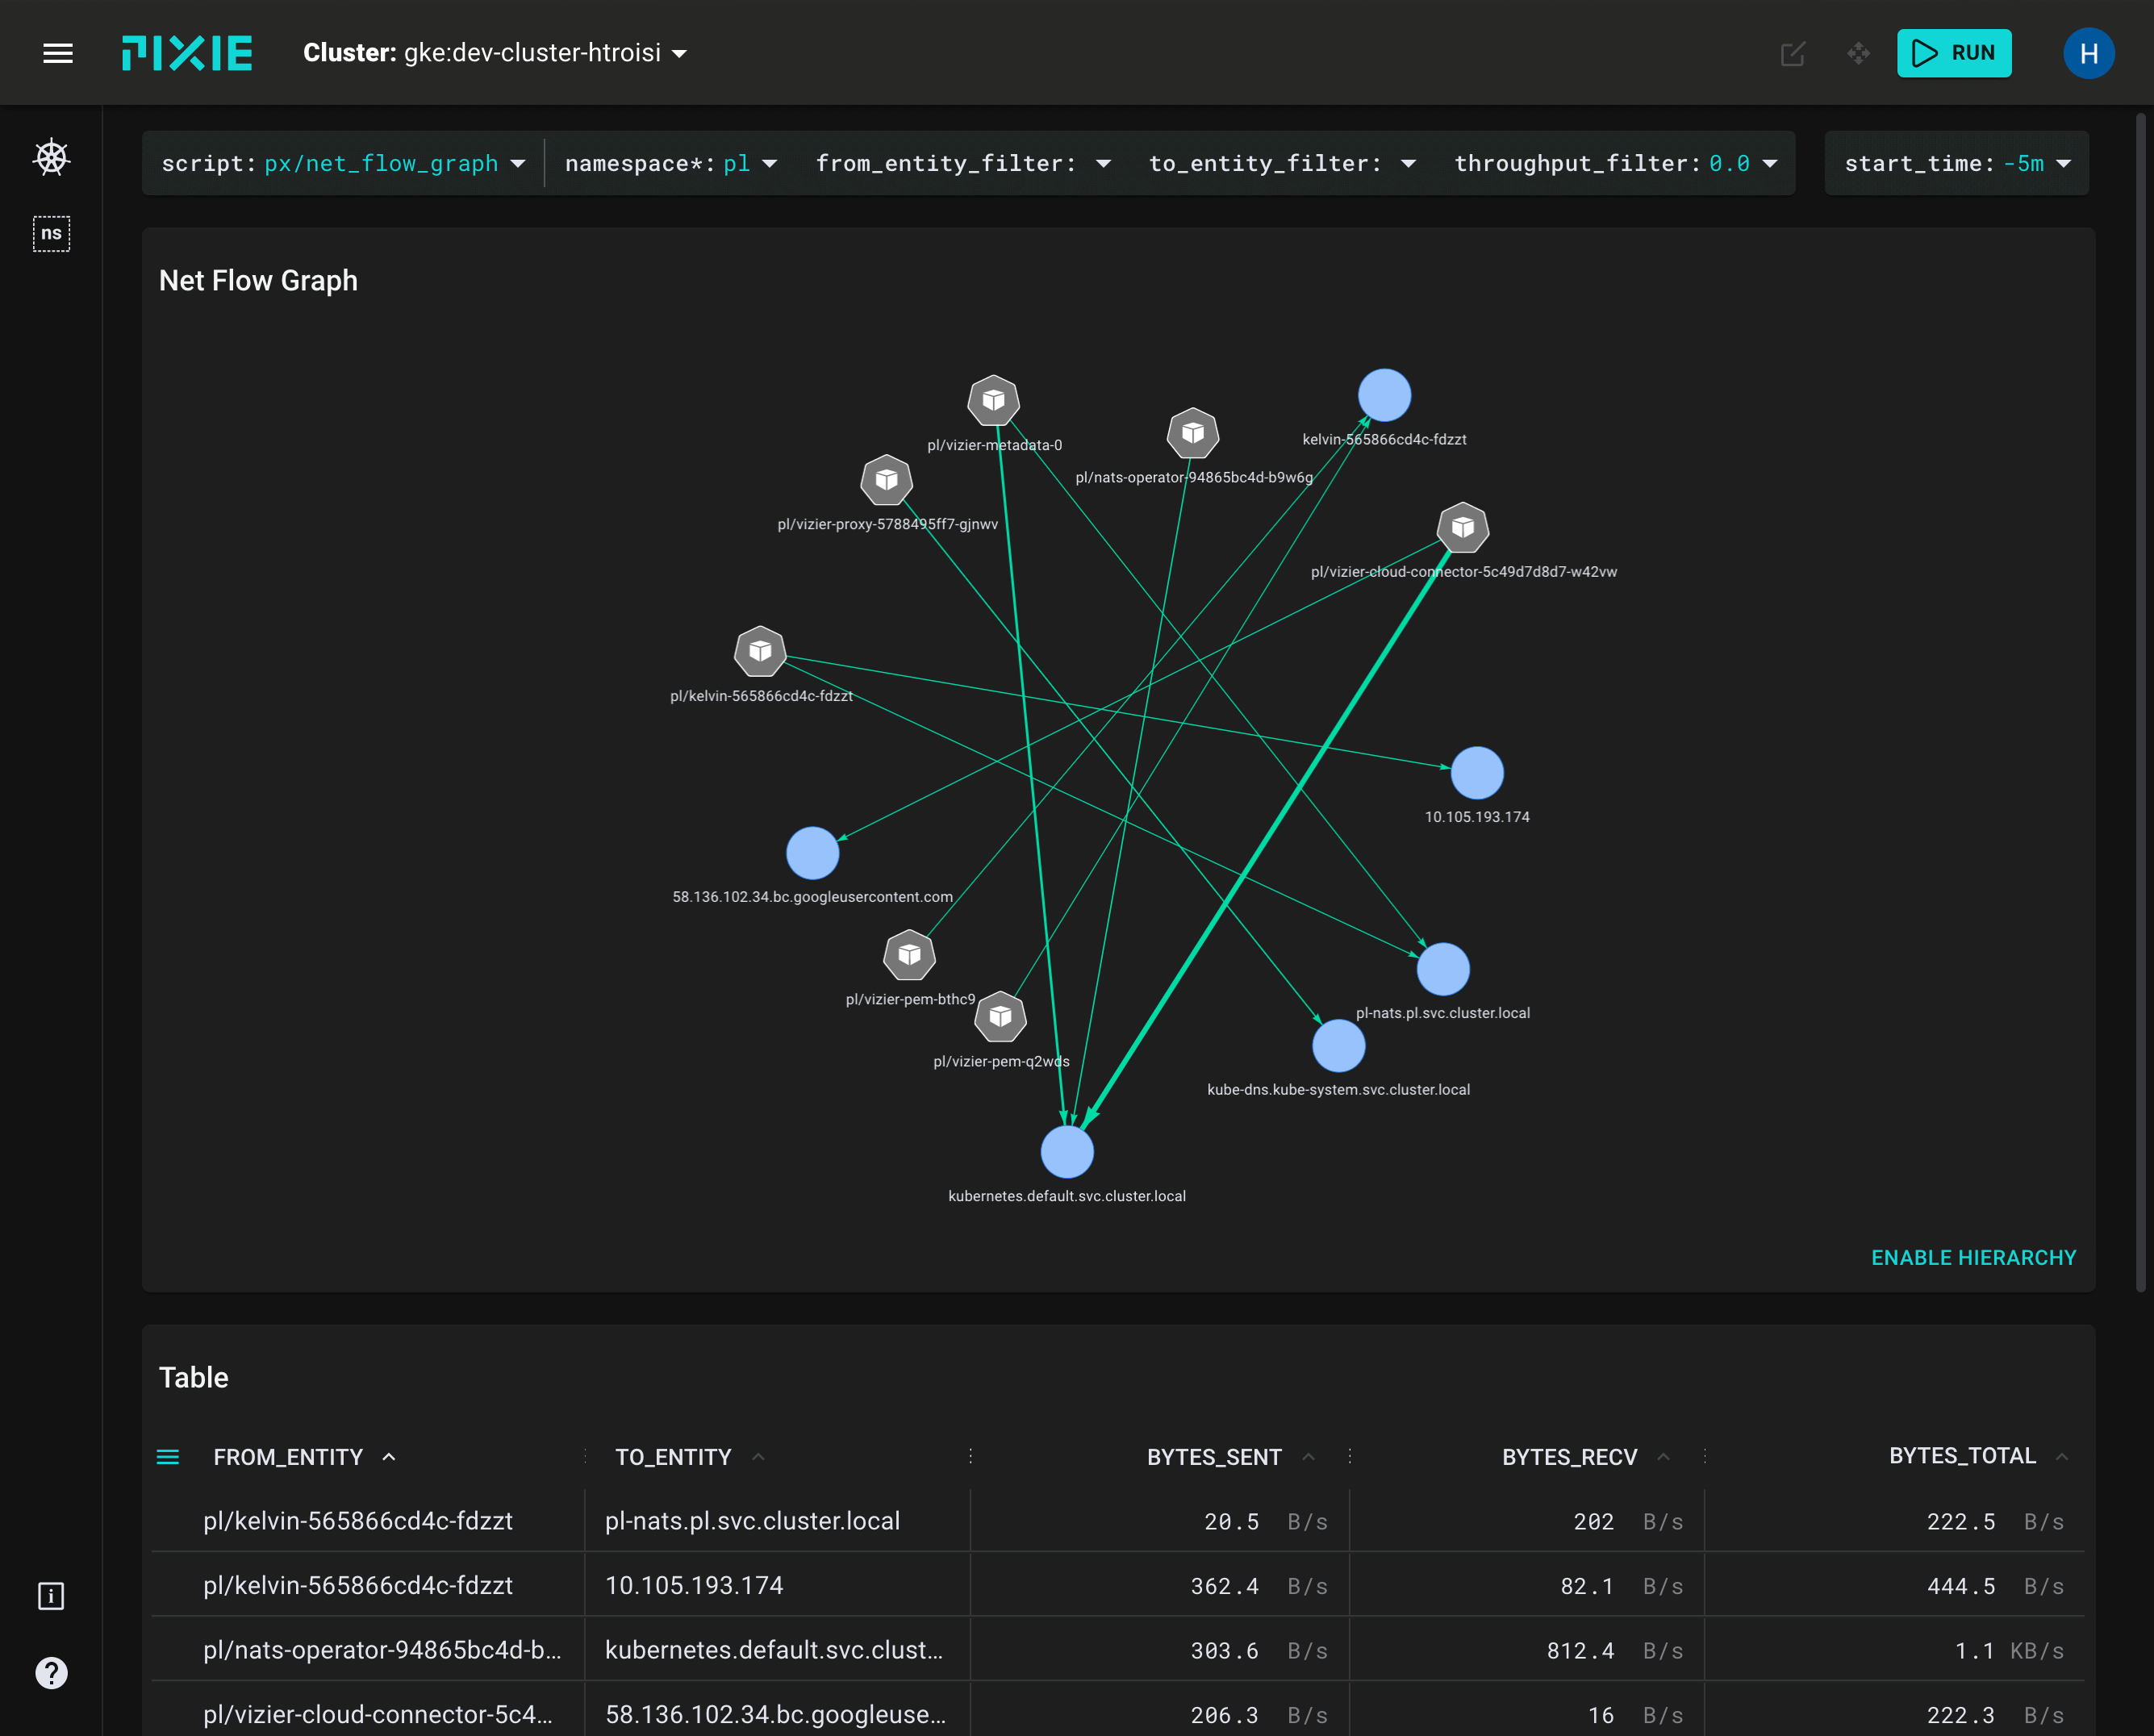
Pixie is an auto-instrumentation tool which automatically instruments k8s pods to capture a bunch of data such as CPU, memory, I/O metrics, pod networking metrics, red metrics, service dependency graph, database query profiling, Kafka monitoring and profiling information and a bundled web frontend.
Natively Pixie stores all this information in the cluster with a short retention time and queries are performed on the data in the cluster, leveraging the clusters compute to serve the queries. However, there is an OTel exporter which allows you to ship Pixie data out of the cluster to the provider of your choice.
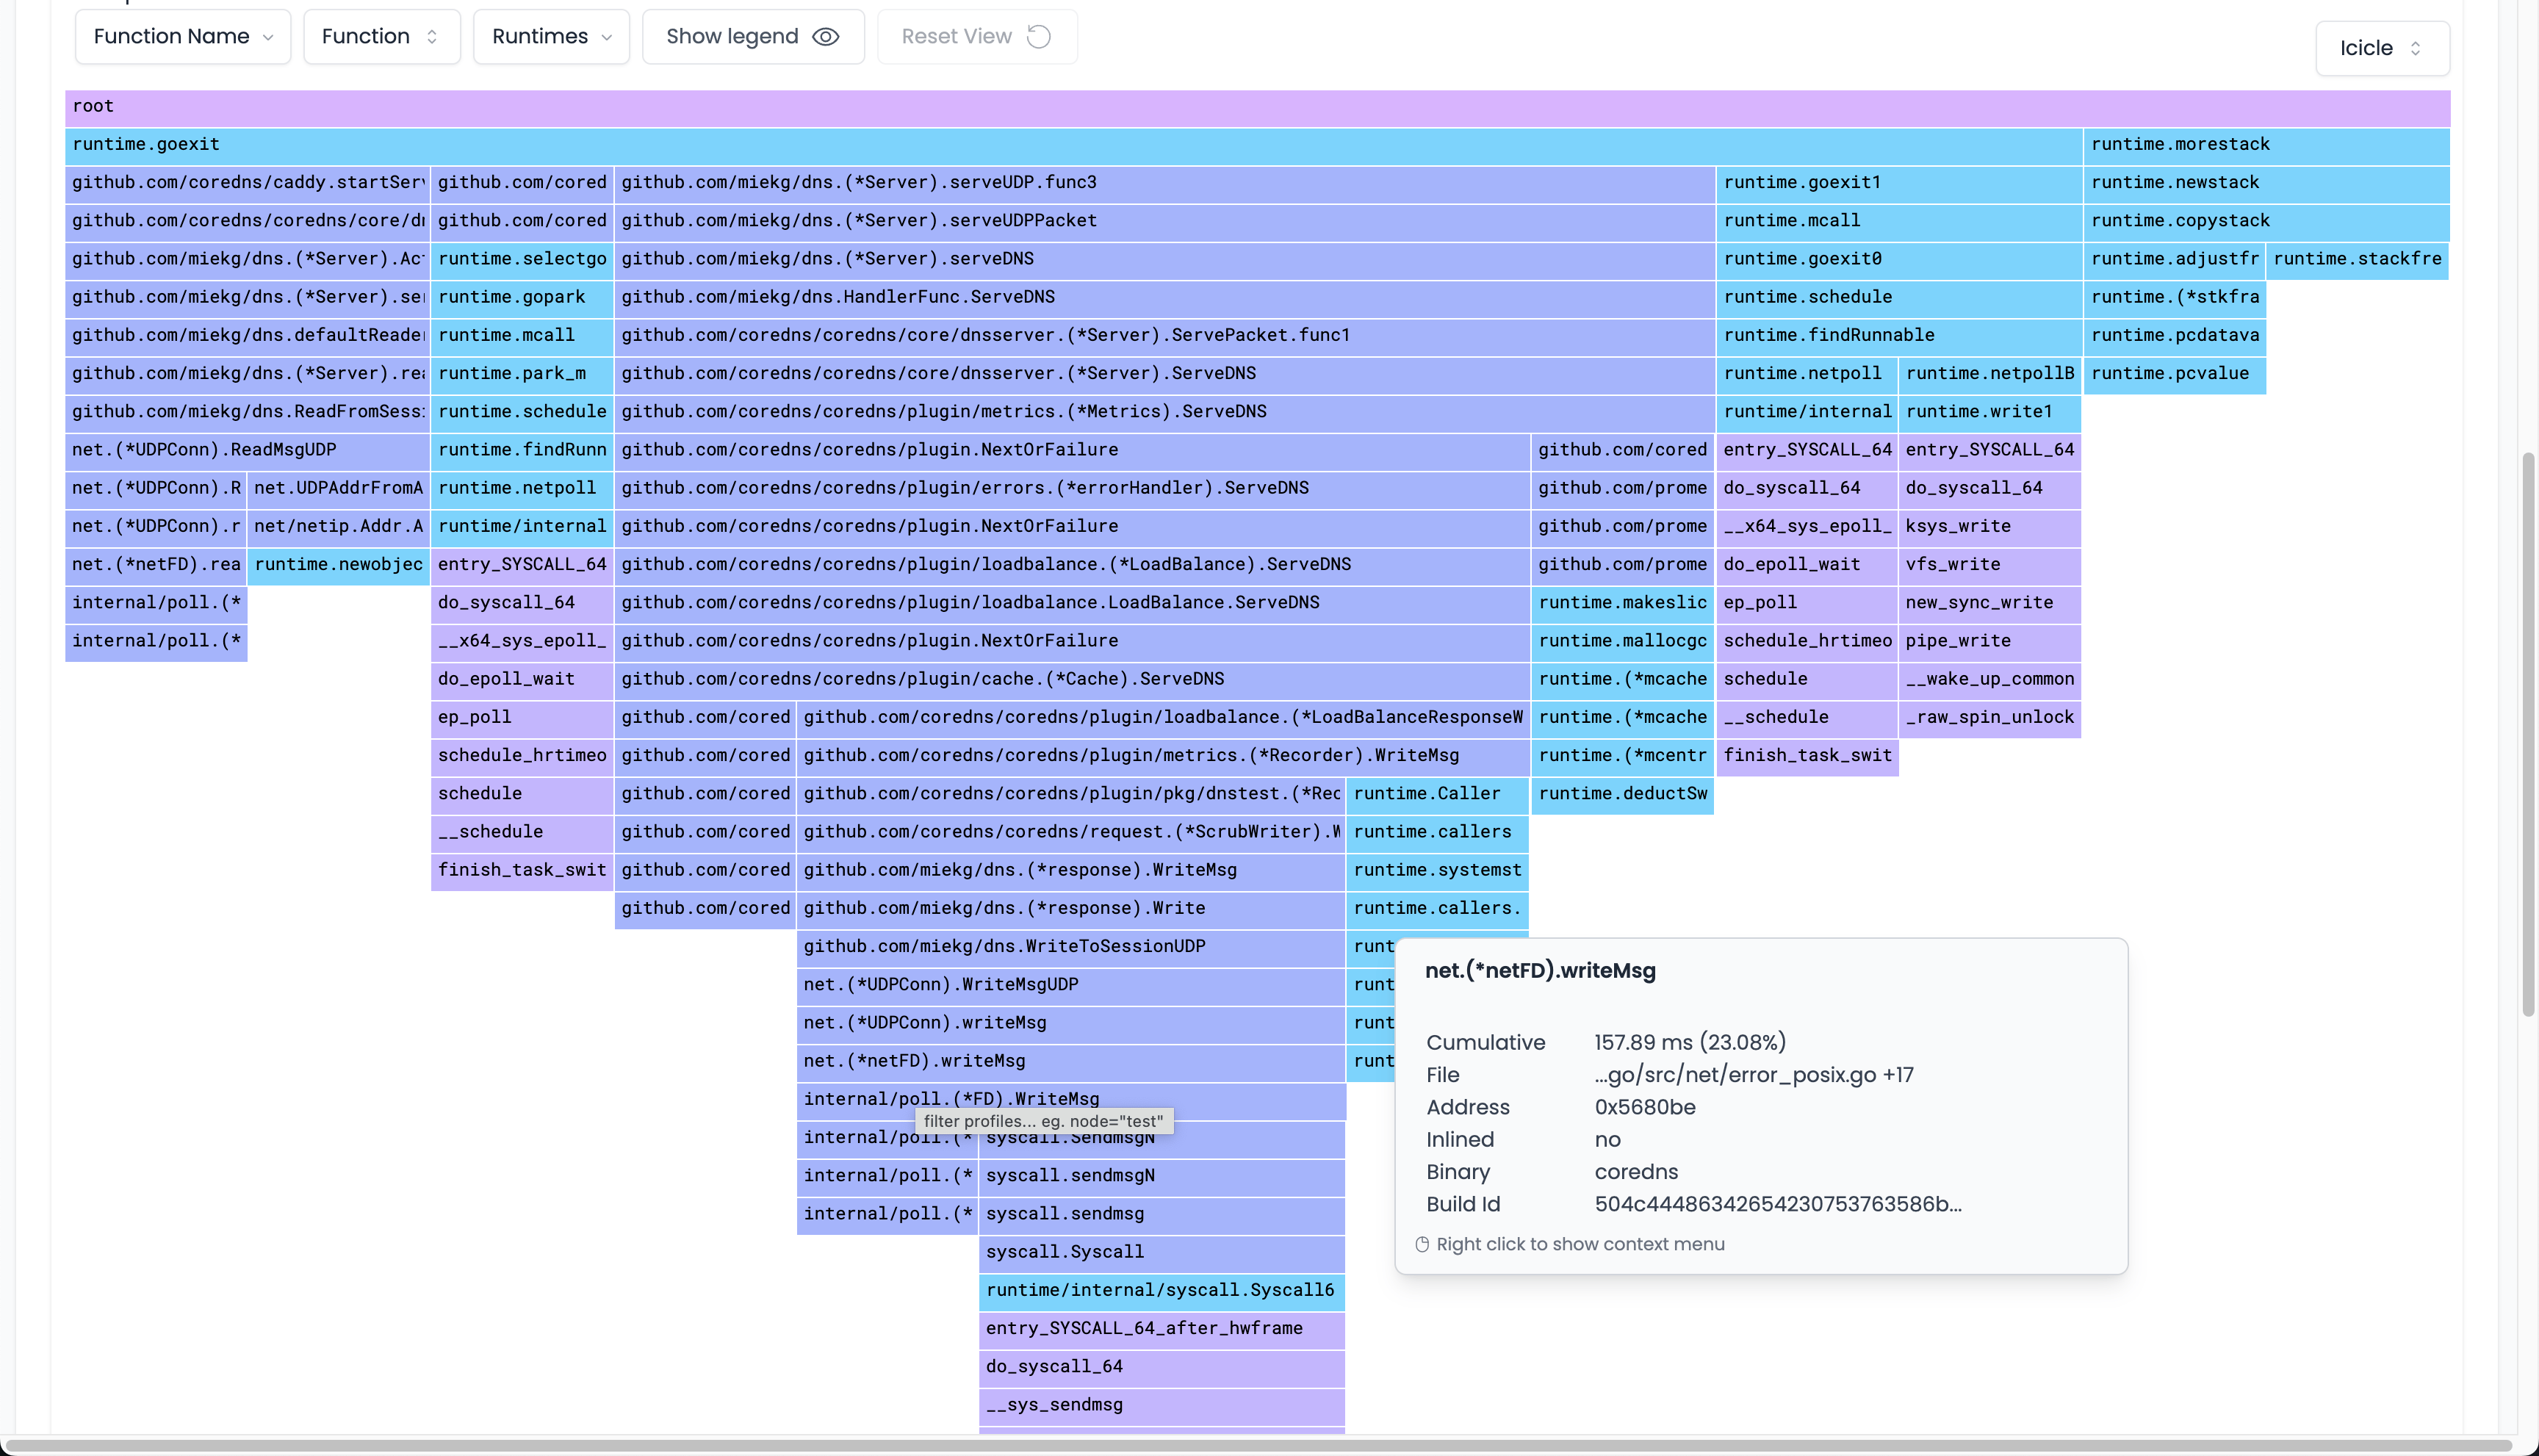
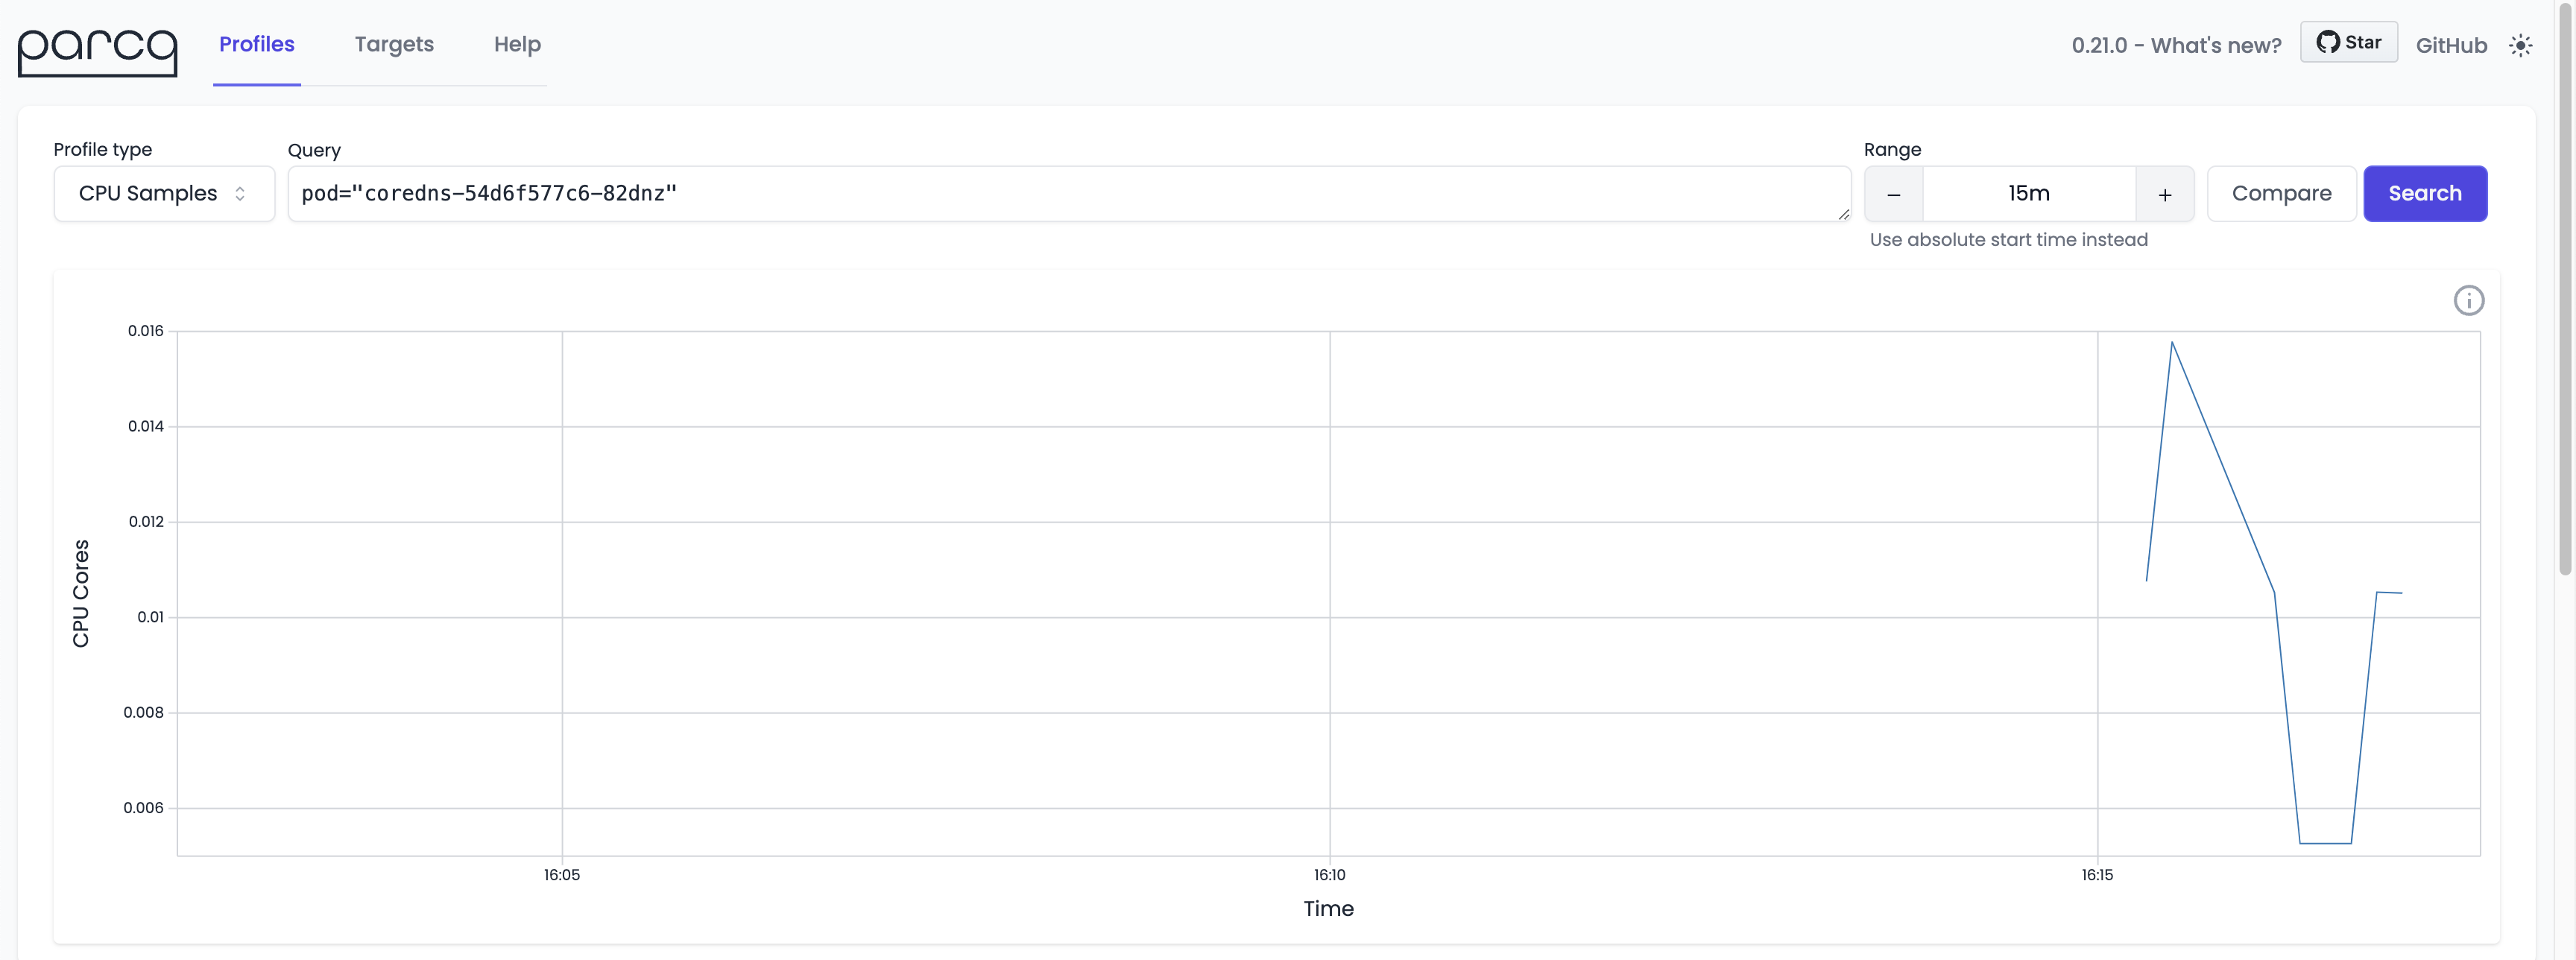
Parca leverages eBPF to perform continuous profiling. Parca agents are installed into the cluster, they sample each cpu core 19 times per second, then export that data. Exports of the data are to pprof format which interops nicely with other providers. Parca supports cpu profiling, memory allocations, network activity and disk I/O. It then has a (beautiful) UI so you can interact and query that data.
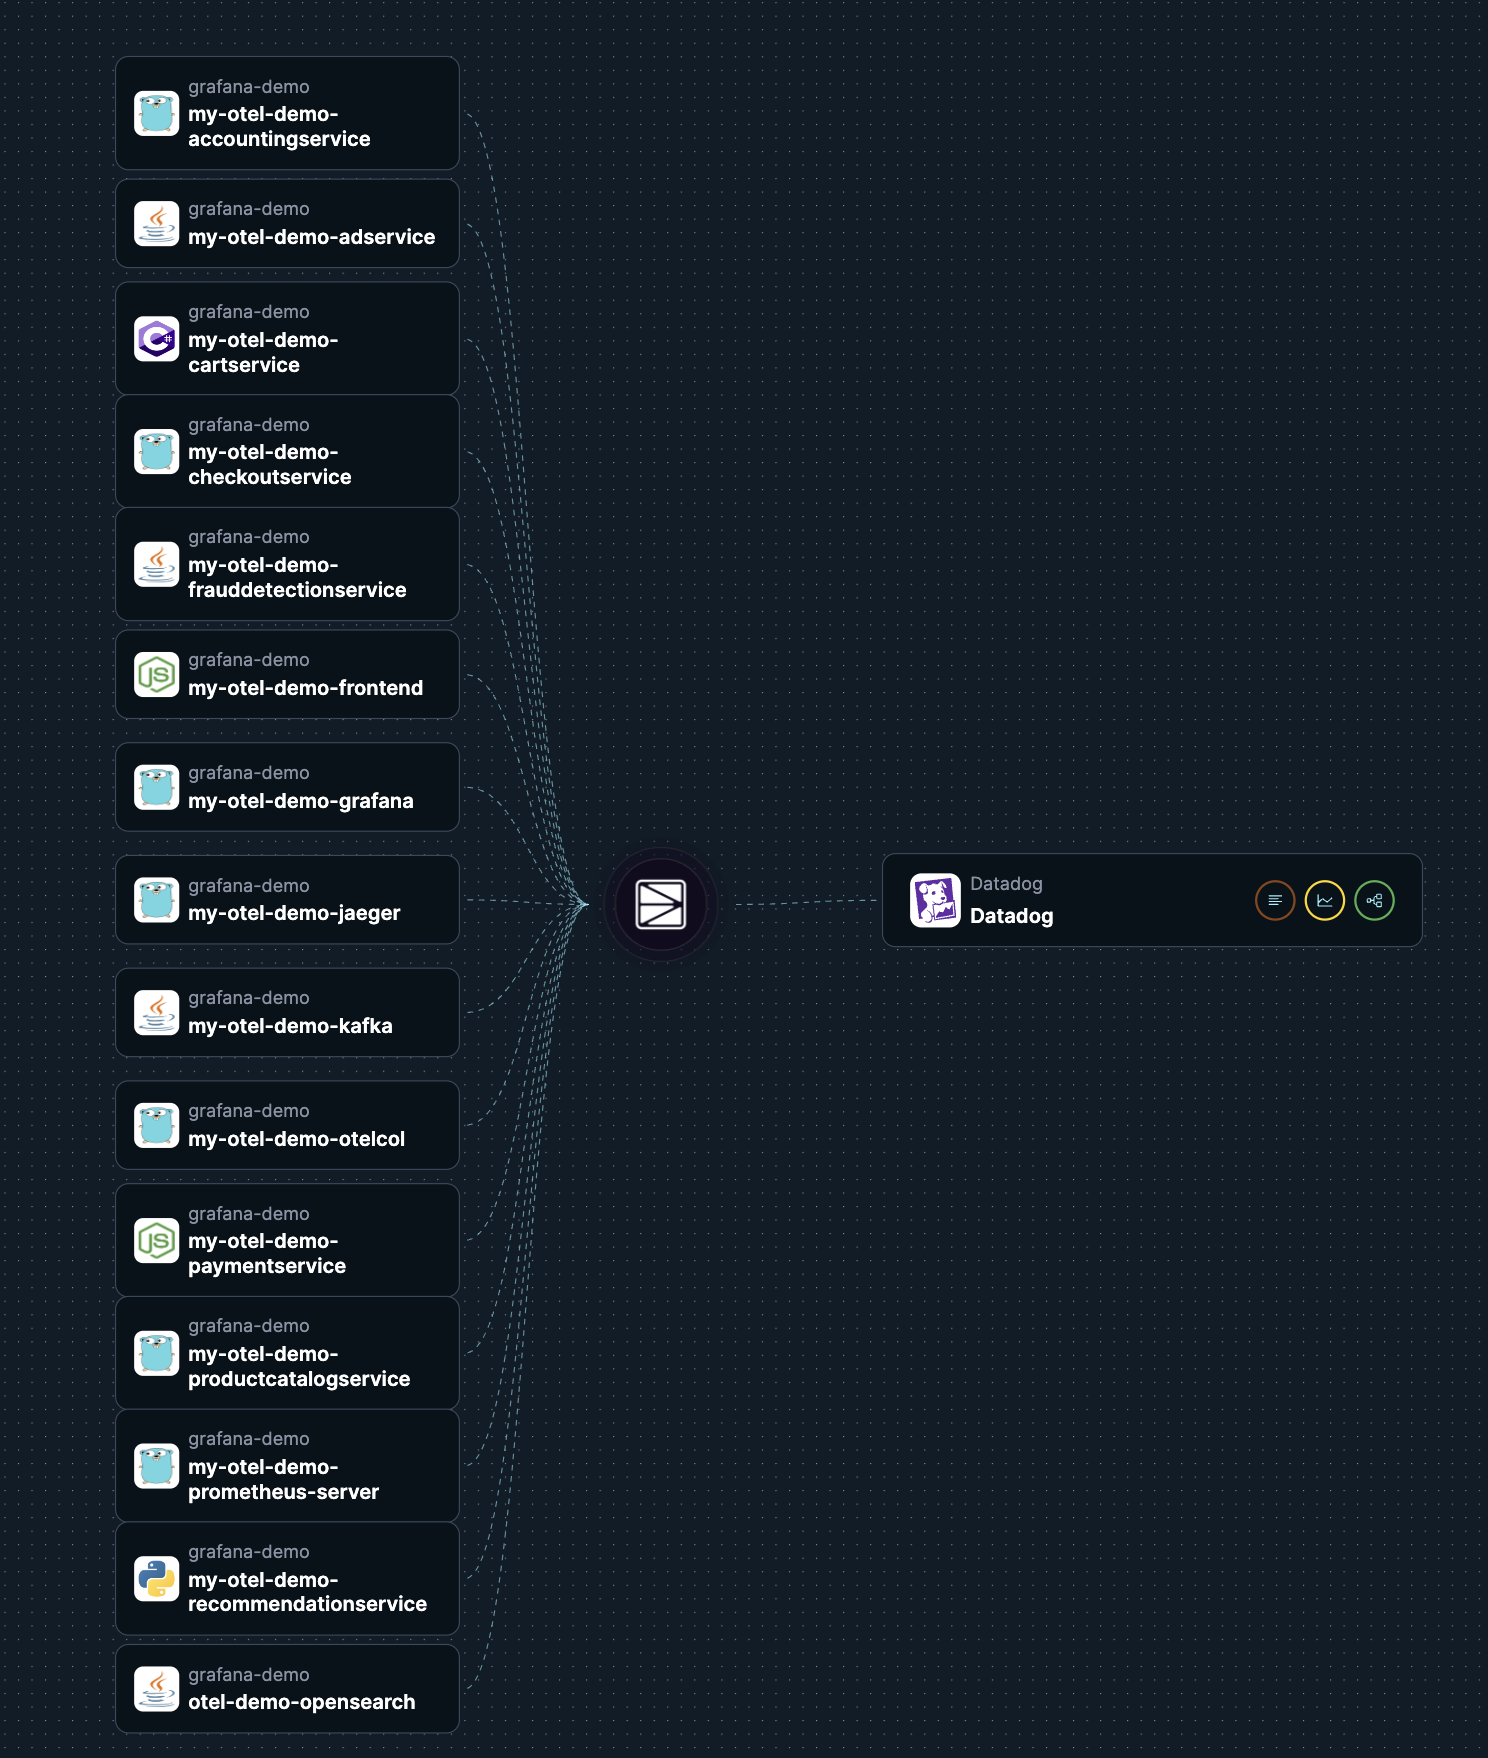
Odigos automatic instruments your application manages the export of that data to an observability backend. Odigos produces traces, metrics, logs into an OTel format and ships them to whichever provider you define. It has a super easy installation via a cli and configuration set up via a web ui. The overall instrumentation functionality includes eBPF based instrumentation and is similar to the otel collector but it’s much much easier to use.
Caretta is a instant service dependency graph for all services running in k8s using eBPF, just install the helm chart and you'll be greeted with a a nice service dependency graph in Grafana.
Beyla is Grafana’s entry into the eBPF world. Beyla allows you to capture RED metrics and traces for services using HTTP or gRPC by inspecting the requests being made via eBPF. It exports this data via the OTEL format so you can hook it up to whichever observability backend you like. It even has some cool features for specific languages. For Go it can automatically propagate or create the traceparent header to downstream applications with no code changes. This means that you can get distributed tracing for free across your whole system if you happen to run a go-only shop.
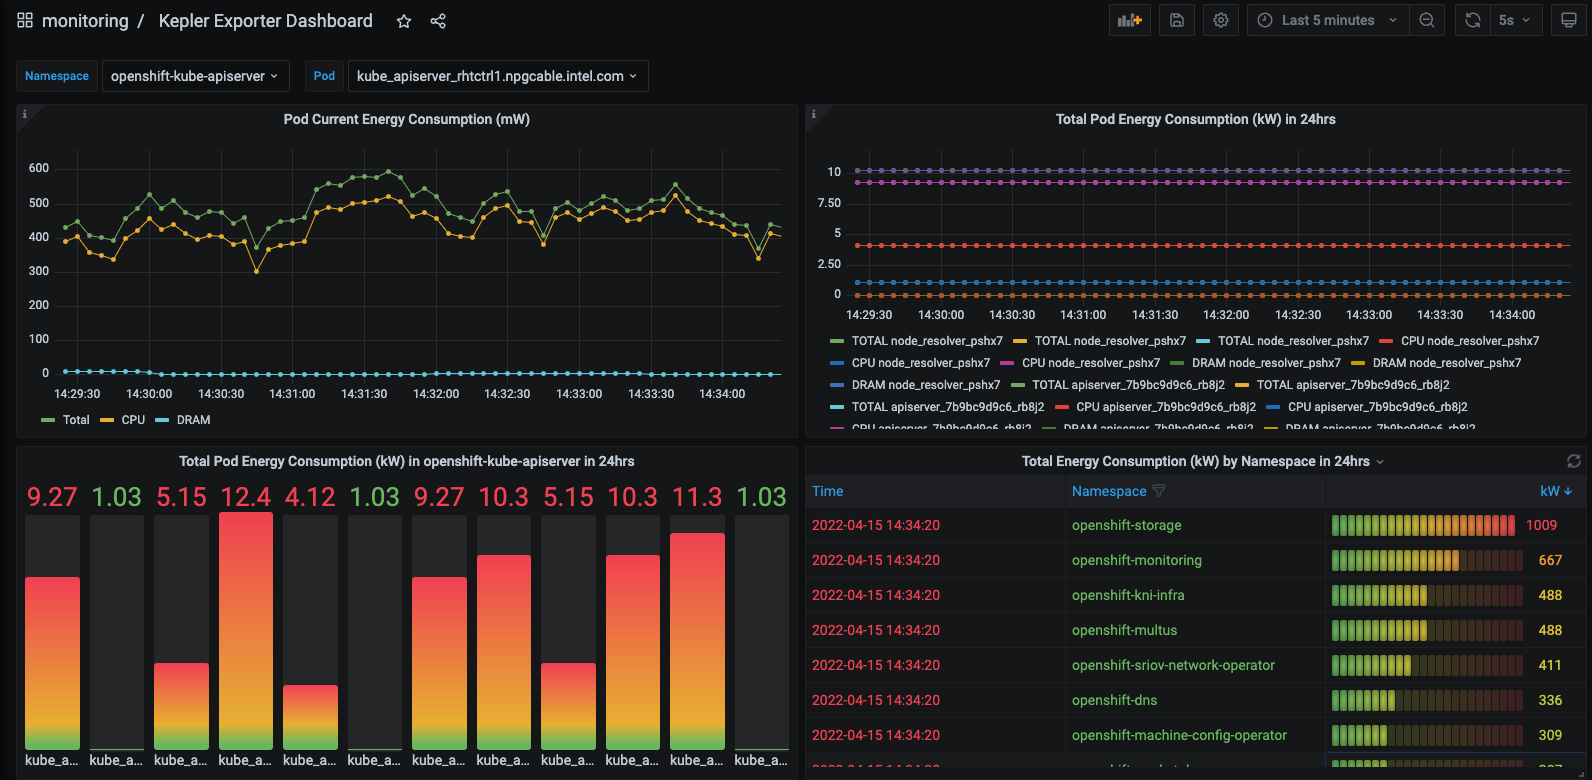
Kepler is a pretty cool project for the energy-conscious amongst us. Kepler leverages eBPF to track energy related metrics for your pods and exports them to the prometheus format. Ever wanted to know how many watts of energy your nginx pod was using? Well now you can!
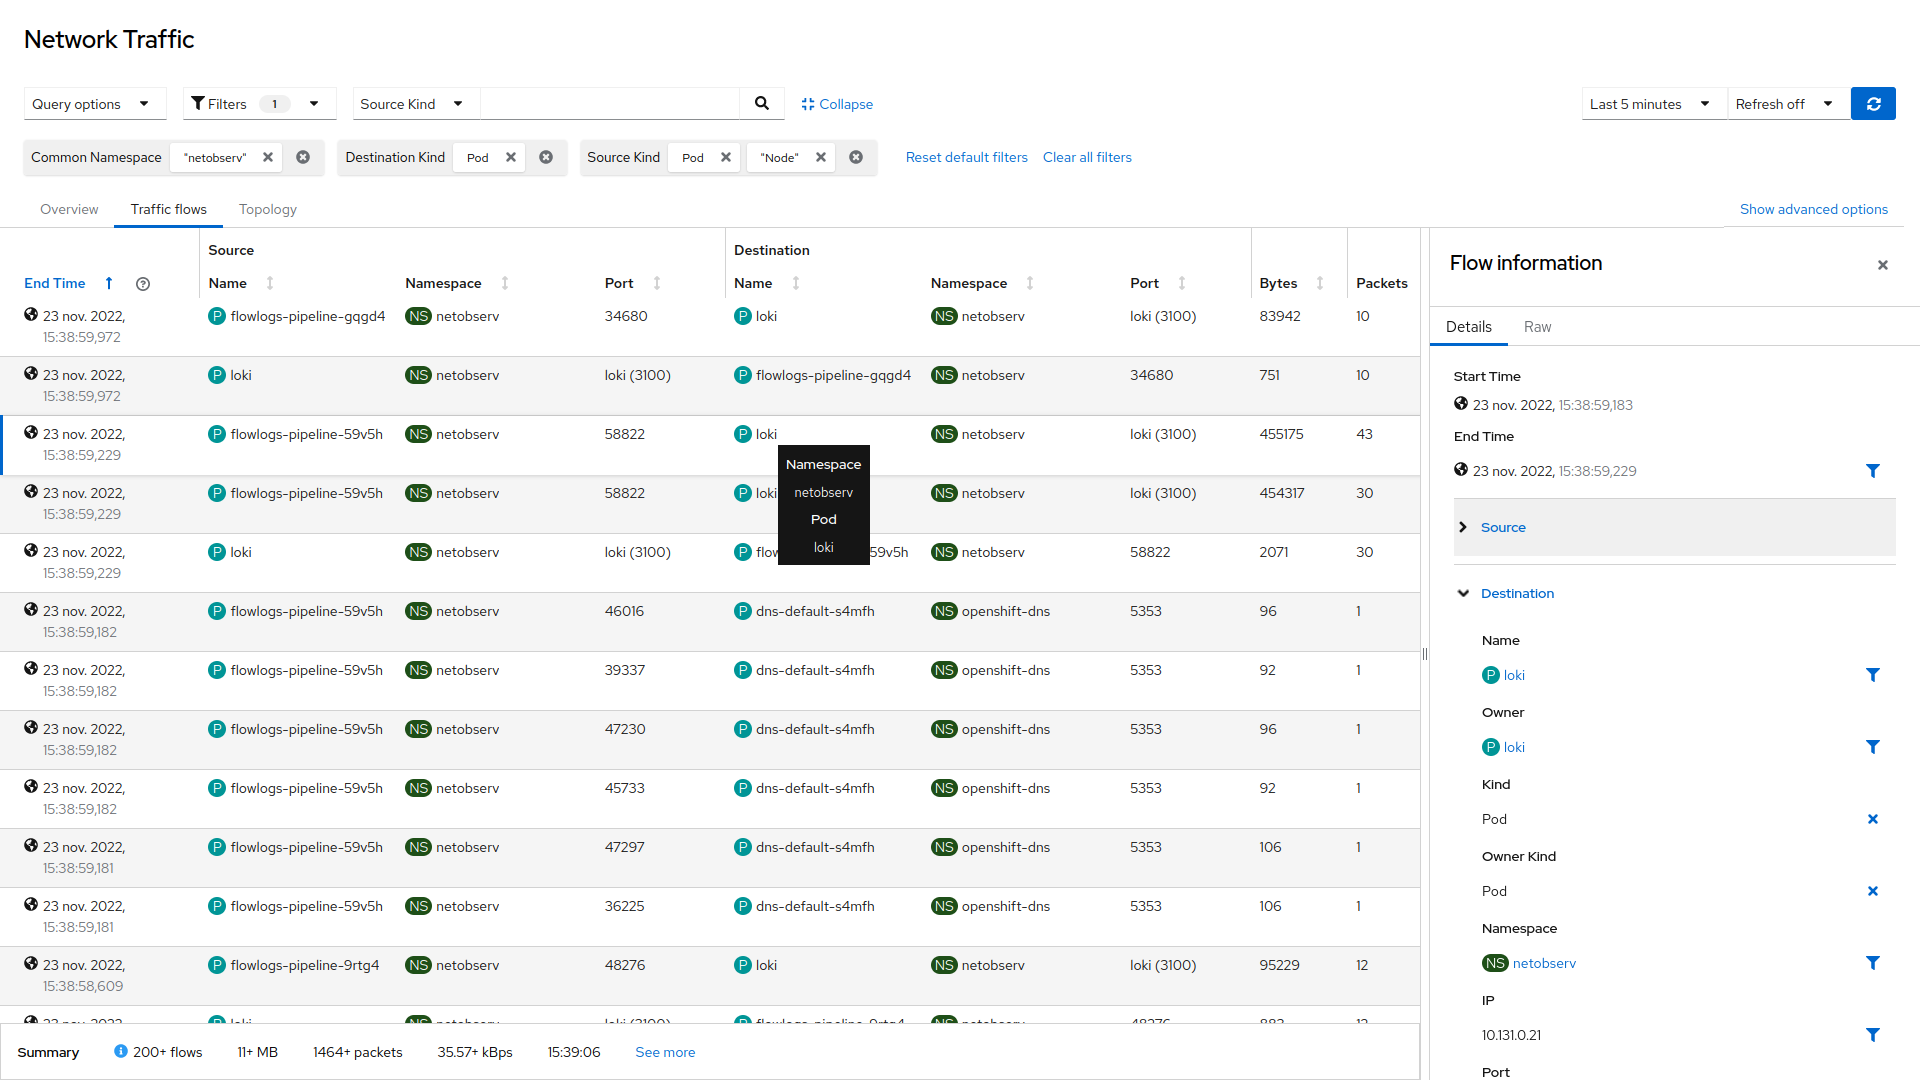
Netobserv allows you to dive deep on networking in your cluster via inspection with eBPF. It gives you a service graph to show flows between pods and nodes and even gives you information down to the individual TCP connection, you can see how long a connection was open for, number of packets transferred, bytes. A great tool for you netops people out there.
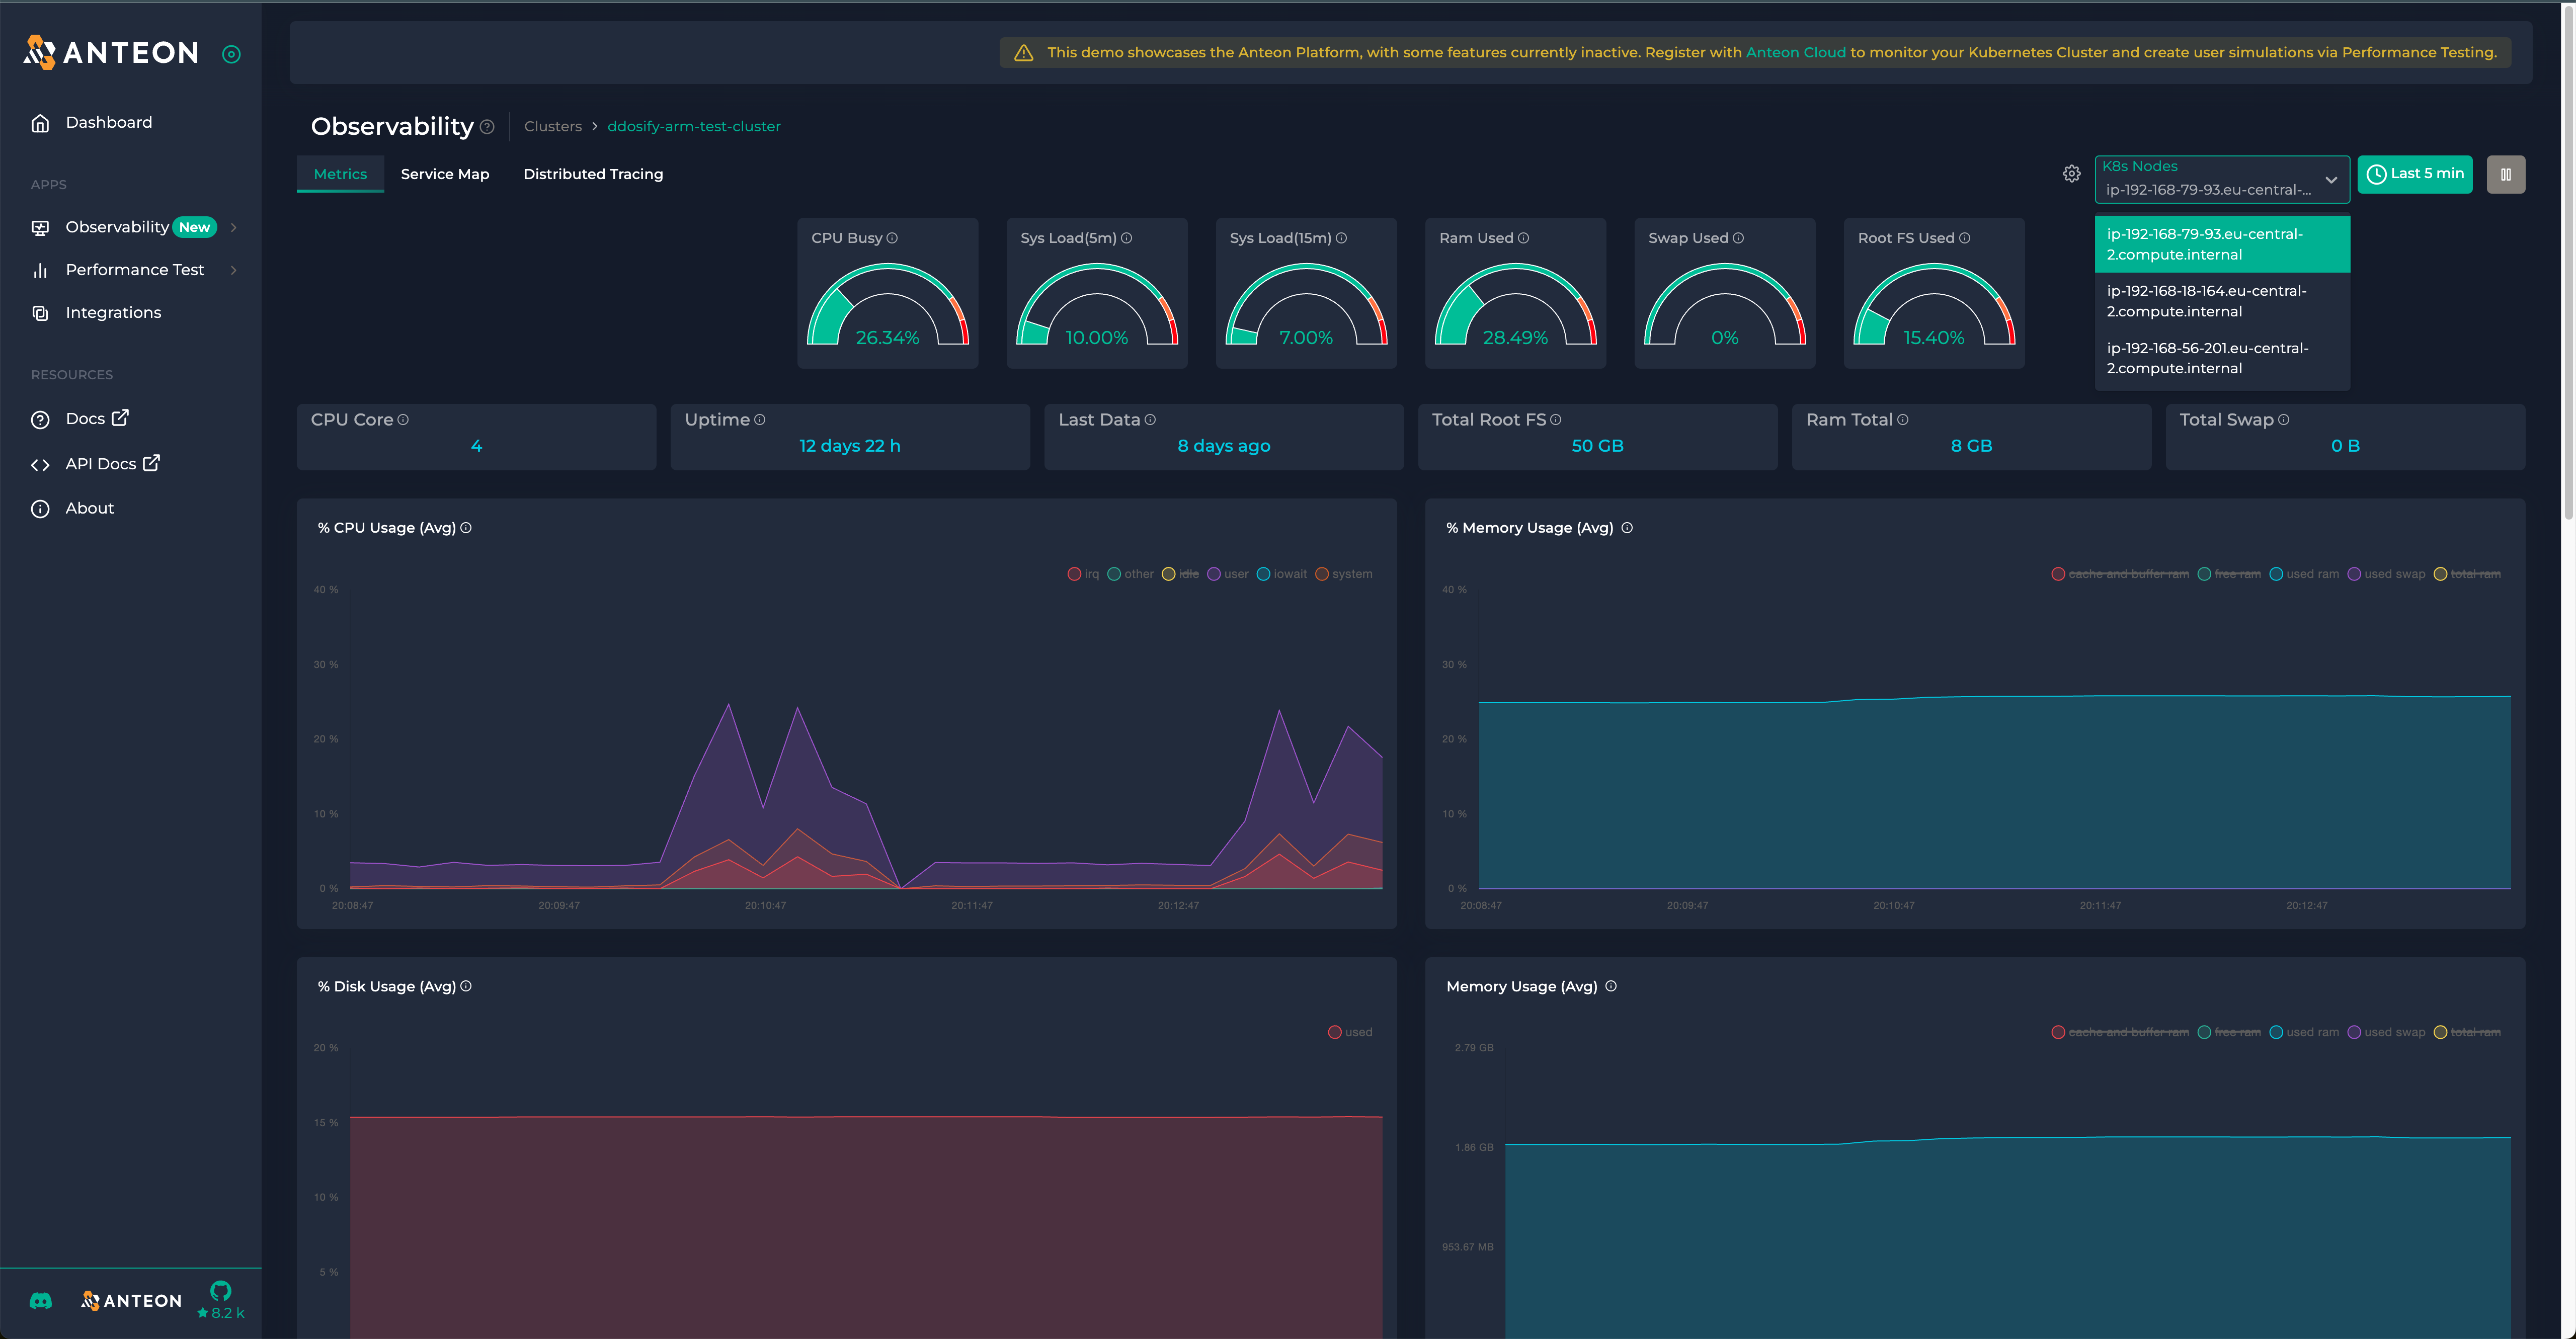
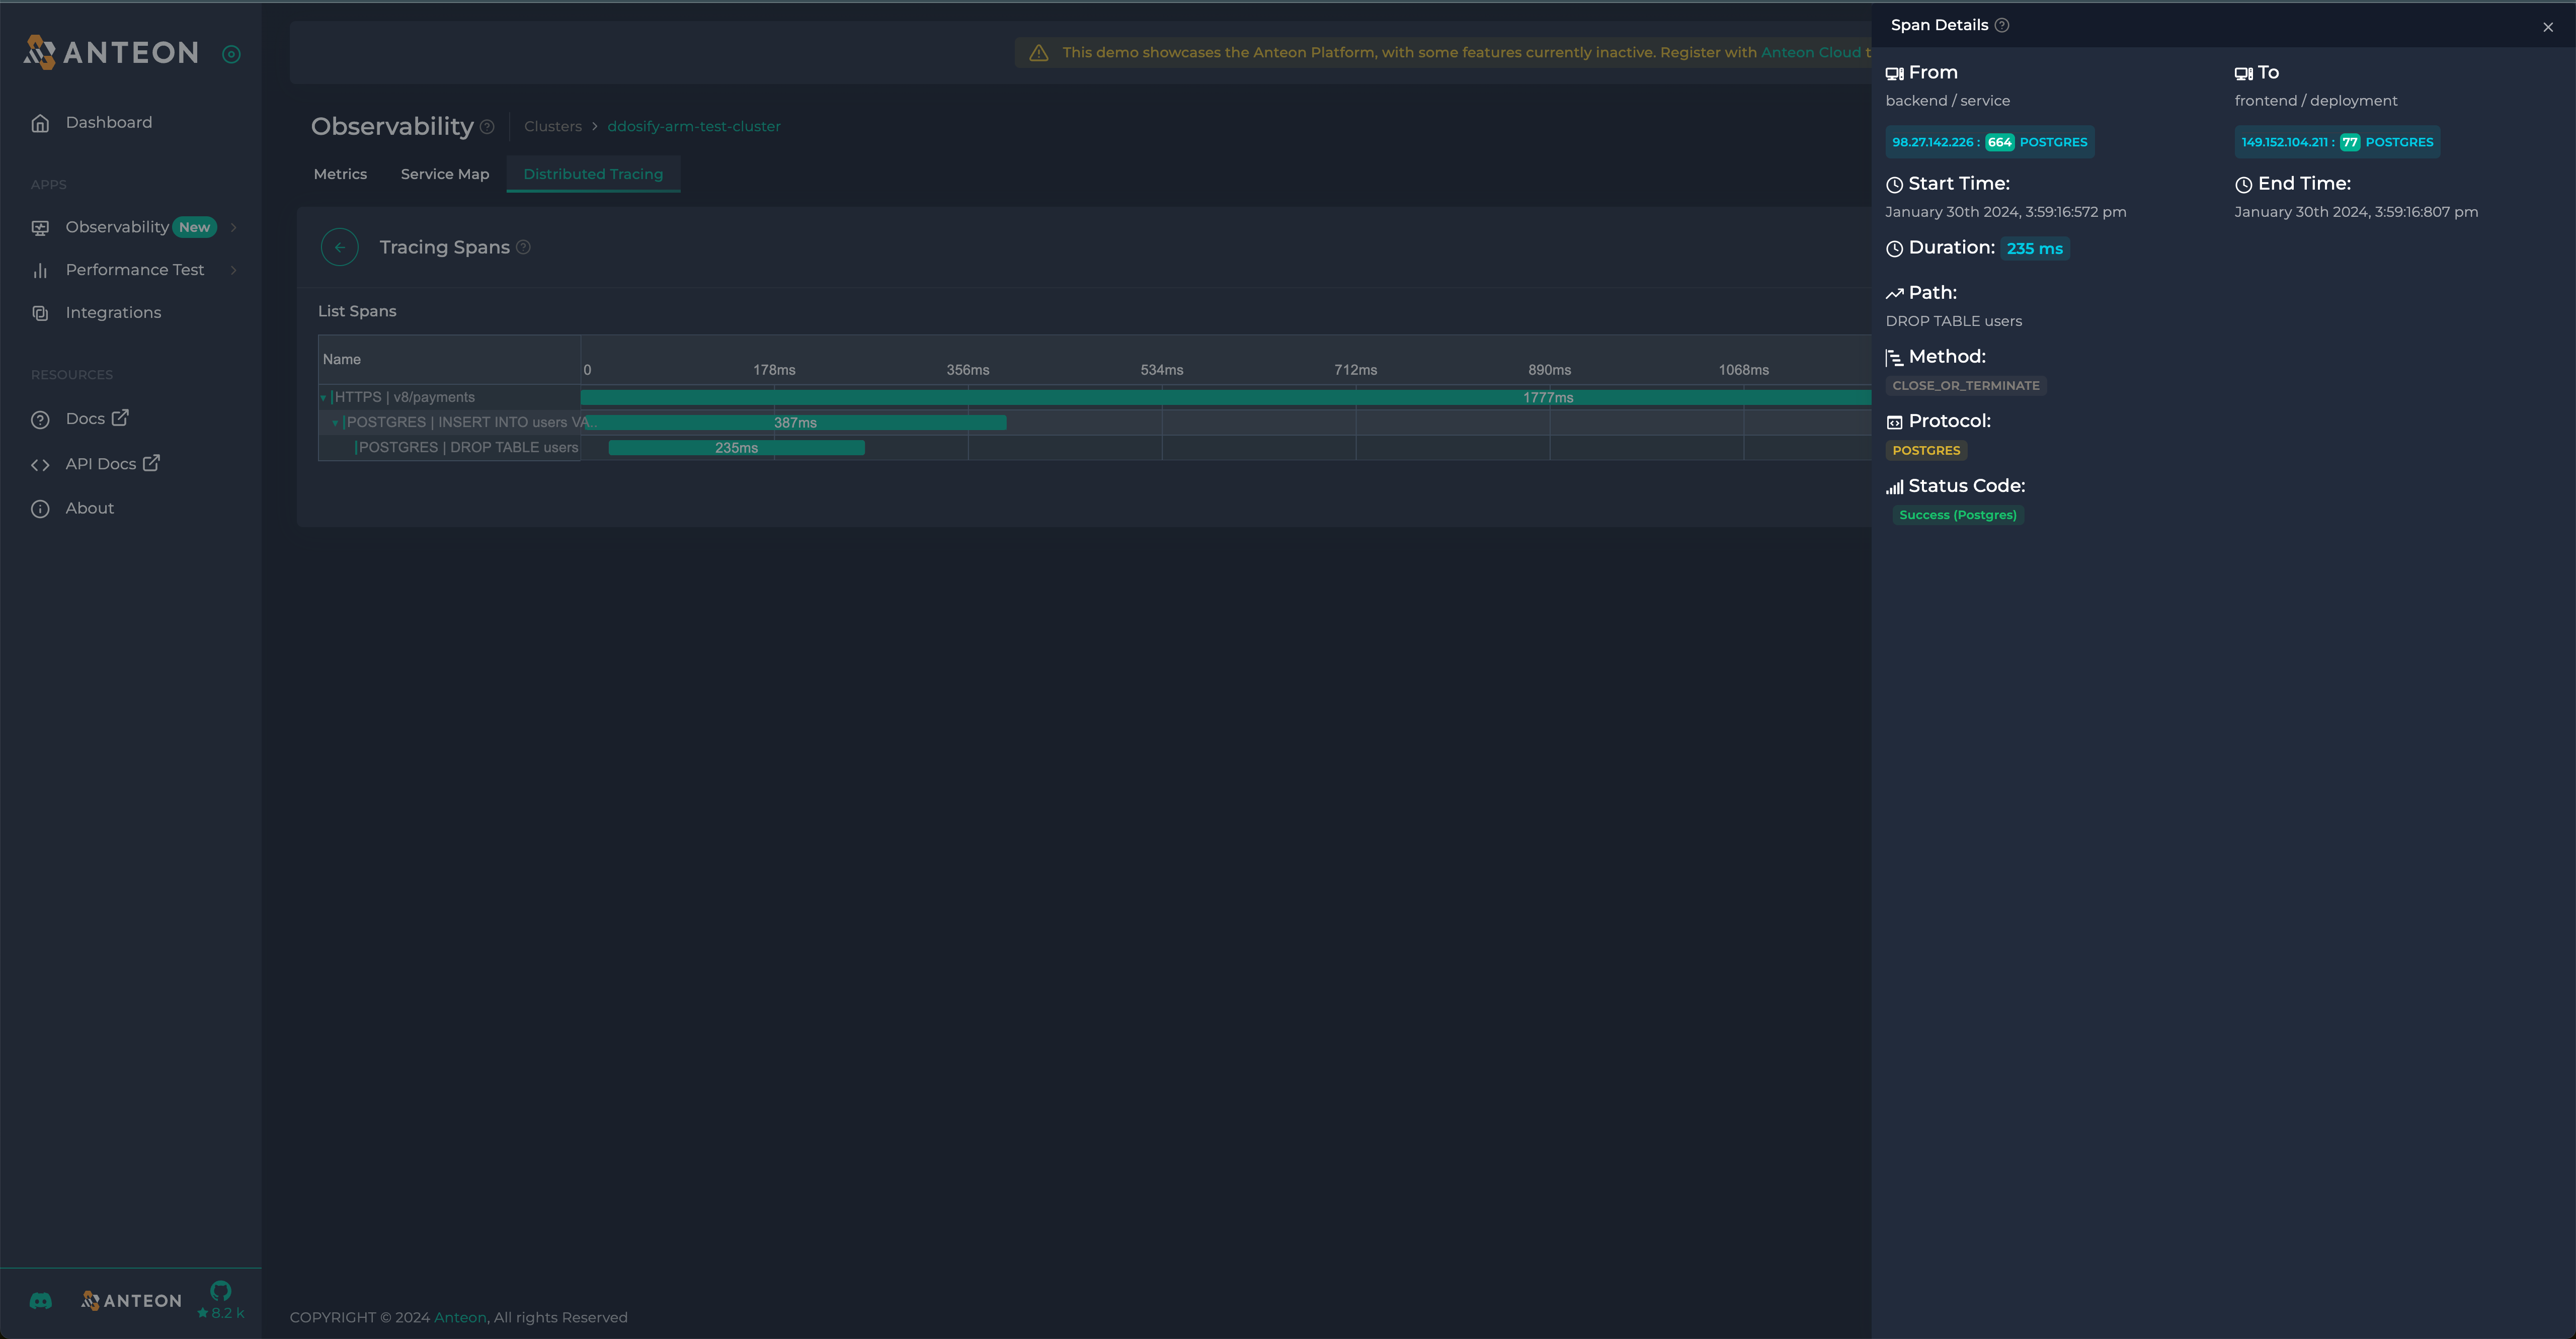
Anteon offers auto instrumentation via eBPF as well as some unrelated performance testing functionality. Anteon automatically generates and exports infrastructure metrics on the hosts in your k8s cluster.
It also automatically generates and propagates trace information throughout your services to generate traces.
I love the idea of Wachy. Wachy gives you a way to interactively explore performance characteristics of compiled programs (unfortunately no dynamic languages) using eBPF. There’s a great 3 minute demo which explains it more here: https://youtu.be/8Pwy-J4e4sQ. But if you don’t want to dive in, think gdb style interface for performance via eBPF. The repo hasn’t been touched in a couple years though and it looks like it hasn’t made it to easy usage in a k8s environment.
There’s a bunch of tools out there to do things with eBPF, a lot of them overlap in scope and serve different needs. I hope this gives you a good jumping-off point!
[1] And windows-ish now too: https://github.com/microsoft/ebpf-for-windows
eBPF website: https://ebpf.io/what-is-ebpf/
Brendan Gregg’s post on eBPF: https://www.brendangregg.com/blog/2019-01-01/learn-ebpf-tracing.html
CGroups Wkipedia page: https://en.wikipedia.org/wiki/Cgroups
eBPF for cgroups: https://lwn.net/Articles/698073/
CNI Explanation: https://www.tigera.io/learn/guides/kubernetes-networking/kubernetes-cni/
Pixie: https://px.dev/
Odigos: https://odigos.io/
Anteon: https://getanteon.com/
NetObserv: https://github.com/netobserv
Cilium: https://github.com/cilium

More Metoro articles that deepen the same topic from another angle.
A technical deep-dive into how Metoro captures L7 protocol traffic and intercepts TLS-encrypted data using eBPF, enabling automatic observability without code changes
Read article →Learn how to solve unexpected performance issues in Go applications by correctly configuring the GOMAXPROCS parameter for optimal CPU usage in containers
Read article →Learn what Kubernetes observability is and how to implement effective observability for your k8s clusters.
Read article →