Published:
11 min read

Know enough to be dangerous in 10 minutes
If you're newer to the architecture side of this problem, pair this with microservice interview questions before diving into tracing internals.
As the number of services in a distributed system increases, so does the difficulty of debugging the system when it fails or degrades. Issues stemming in one part of the system can impact services in an entirely different part of the system.
In the architecture below, we have a request passing through 3 micro-services and finally calling a database. If the database takes a long time to answer service C's query then the entire request would take a long time to return a response. The latency of each downstream service would increase dramatically.
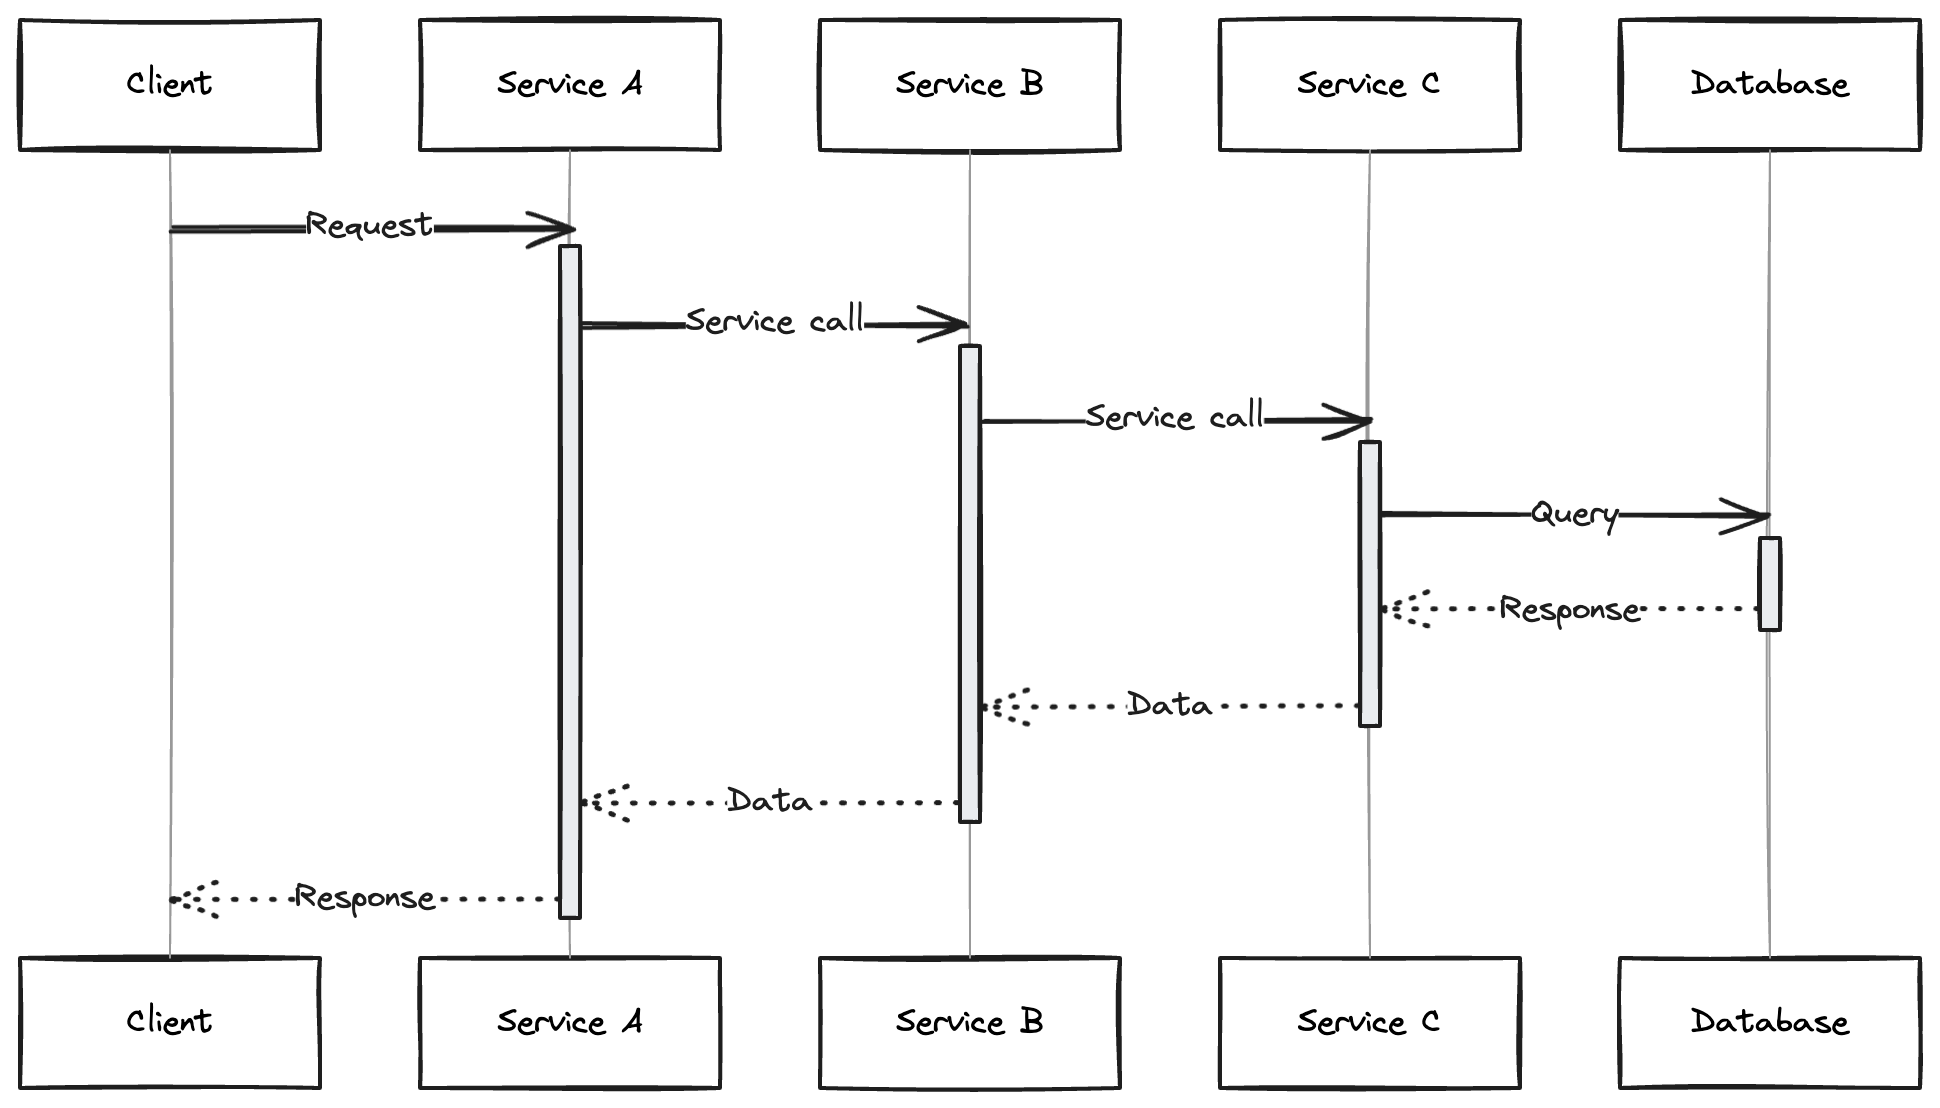
The team responsible for service A may have an alert configured to notify them if the service's latency increases, as high latency results in a poor user experience.
How would that engineer who owns service A start to debug this issue without distributed tracing?
The engineer likely knows that the call to service B is slow, but they might not understand how service B is built or what its dependencies are. They would need to consult with another engineer familiar with service B or examine service B's metrics (or code) to identify issues. This investigation would continue across all related services until they reach the database. Not exactly the most efficient process...
We need a method to track the journey of a request through a distributed system and identify the latency or errors at each stage.
This is the purpose of distributed tracing.
Using data emitted through distributed tracing instrumentation, we can understand the entire lifecycle of the request through all micro-services so any engineer can locate the source of the issue across the entire system quickly.
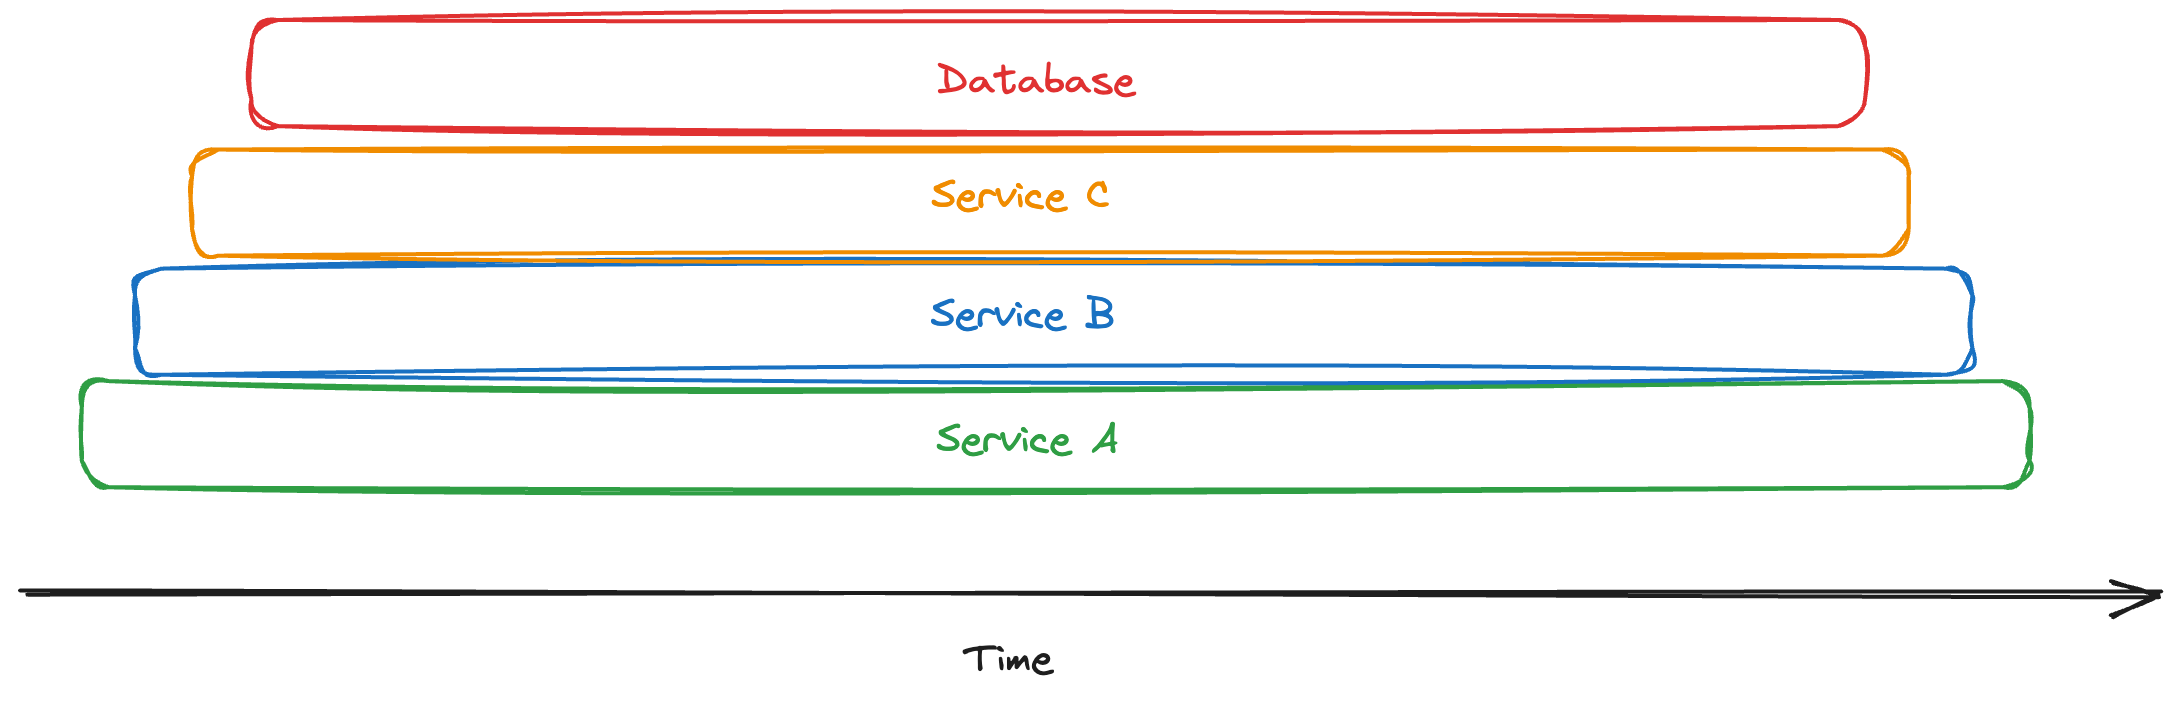
In this scenario, our engineer can examine a flame graph visualisation of a slow trace and quickly identify, as shown in the diagram below, that the database was responsible for the increased latency.
Before understanding how traces are created and used. We first have to understand what a trace is.
There are several projects which have different data models to represent a trace, the most notable ones are Zipkin, Jaeger and OpenTelemetry. Despite some differences, their rough structure is the same. The industry seems to be settling on OpenTelemetry as the standard and so we'll be focusing on OpenTelemetry for the rest of this post.
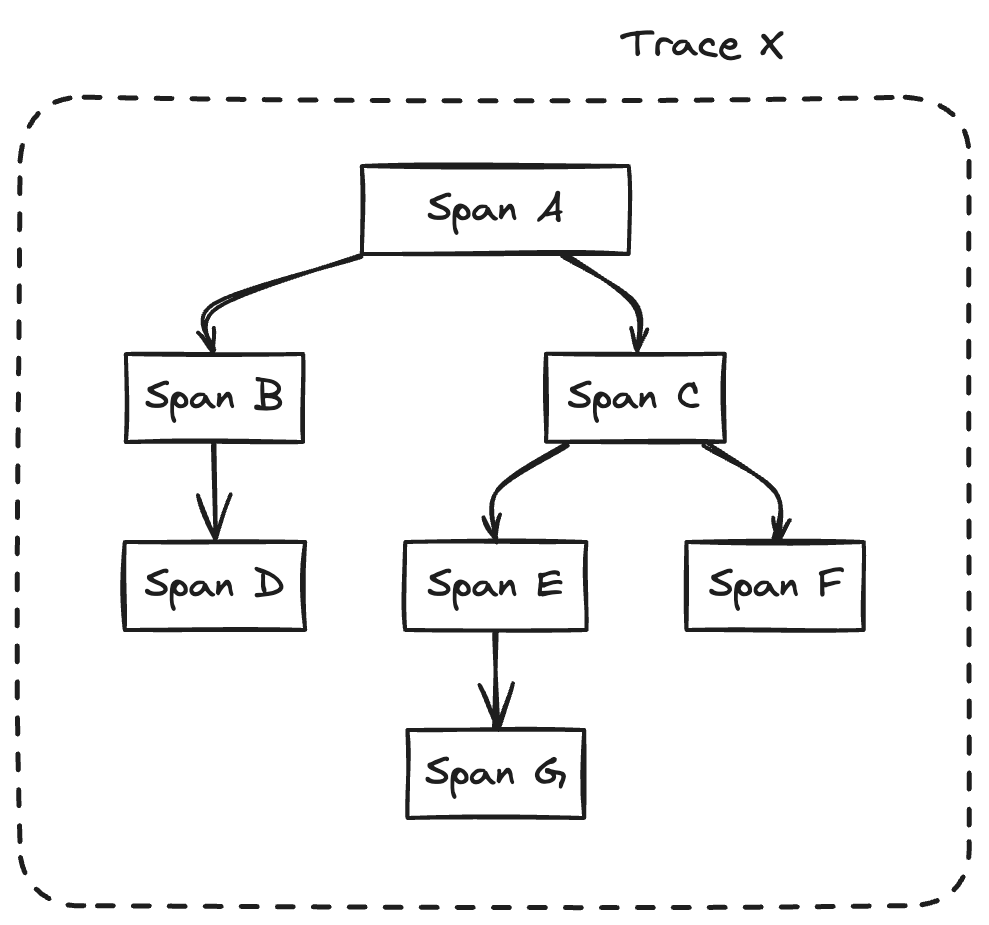
A trace consists of many spans in parent-child relationships. A trace is just a tree of spans.
Each span represents a unit of work and includes the following information (along with a few other details we won't cover here, as they are less important):
Span Name - The name of the operation being performed in the span e.g. HTTP POST
Parent Span Id - The span id of the parent span so that the tree can be reconstructed
Start + End Timestamps - Used to calculate the overall time for the span to complete
TraceId - The overarching identifier that the span is a part of, used to tie together all the spans together
Attributes - Arbitrary key-value pairs used to store metadata about the span. Standardised naming patterns for keys have been defined to ensure information is consistently labeled across libraries. For example, if the operation involves an HTTP request, we can expect the method to be stored under the key http.request.method.
Events - A list of meaningful things that happen at a specific point in time. E.g. Page finished loading at 2024-03-13T18:52:58.114561Z
Links -A list of other span IDs (potentially in other traces) that are causally related to this span. This is useful for connecting operations that are asynchronous. For example, if someone buys an item from our online store, we might want to send them an email later. The email sending is triggered by the purchase request trace but isn't part of the same request, so we can connect them using a link.
You might be thinking, how do I know when to start a new span?
There's no strict rule for the level of detail that would warrant starting a new span. You might have a single span for all the work done in one endpoint, or a span for each function call in your service. In general, the higher the level of detail, the more targeted and useful your traces will be, but a higher level of detail often comes with a larger upfront and ongoing maintenance cost. Different people handle this in various ways, and it often depends on how your service is instrumented. More on this topic later.
And that's pretty much it. A full trace looks something like this.
As we now know, traces are made up of a bunch of related spans. So how are these spans generated?
Let's begin with a simple example: a trace that consists of a single span without any children.
To create a trace with a single span, we need to generate some identifiers, name the operation we're recording, track the duration, and then emit the span (we'll discuss where it goes later). In pseudo Go code, it might look like this.
// Generate identifiers
traceID := generateTraceID()
spanID := generateSpanID()
spanName := "Important Operation To Record"

startTime := time.Now()

// Perform the operation that we want to trace
doOperation()

endTime := time.Now()

emitSpan(Span{
  TraceId: traceId,
  ParentSpanId: nil,
  SpanName: spanName,
  SpanId: spanId,
  StartTime: startTime,
  EndTime: endTime
})
Simple enough right?
But now we want to add child spans to give us a more granular view of what's happening in our service. To emit a child span, we need to know two things:
The traceId generated when we create the first span for the trace
The spanId of the parent span
Okay, so now we need to pass around these two identifiers and we should be good to go. Let's pass around the traceId and current span id around in a context. Now our pseudo span generation code looks something like this.
// Get the traceId if it exists, otherwise generate one
traceId := ctx.Value("traceId")
if traceId == nil {
  traceId = generateTraceID()
}

// Get the parent spanId if it exists
parentSpanId := ctx.Value("spanId")

// Generate the new child spanId
spanId := generateSpanID()
spanName := "Important Operation To Record"

startTime := time.Now()

// Perform the operation that we want to trace
// Pass down the context with the new spanId incase we want to make a new child span where this span is the parent
ctxWithParentSpanId := context.WithValue(ctx, "spanId", spanId)
doOperation(ctxWithParentSpanId)

endTime := time.Now()

emitSpan(Span{
  TraceId: traceId,
  ParentSpanId: parentSpanId,
  SpanName: spanName,
  SpanId: spanId,
  StartTime: startTime,
  EndTime: endTime
})
This works well enough until we need to pass values across the network so that we can create child spans in different services.
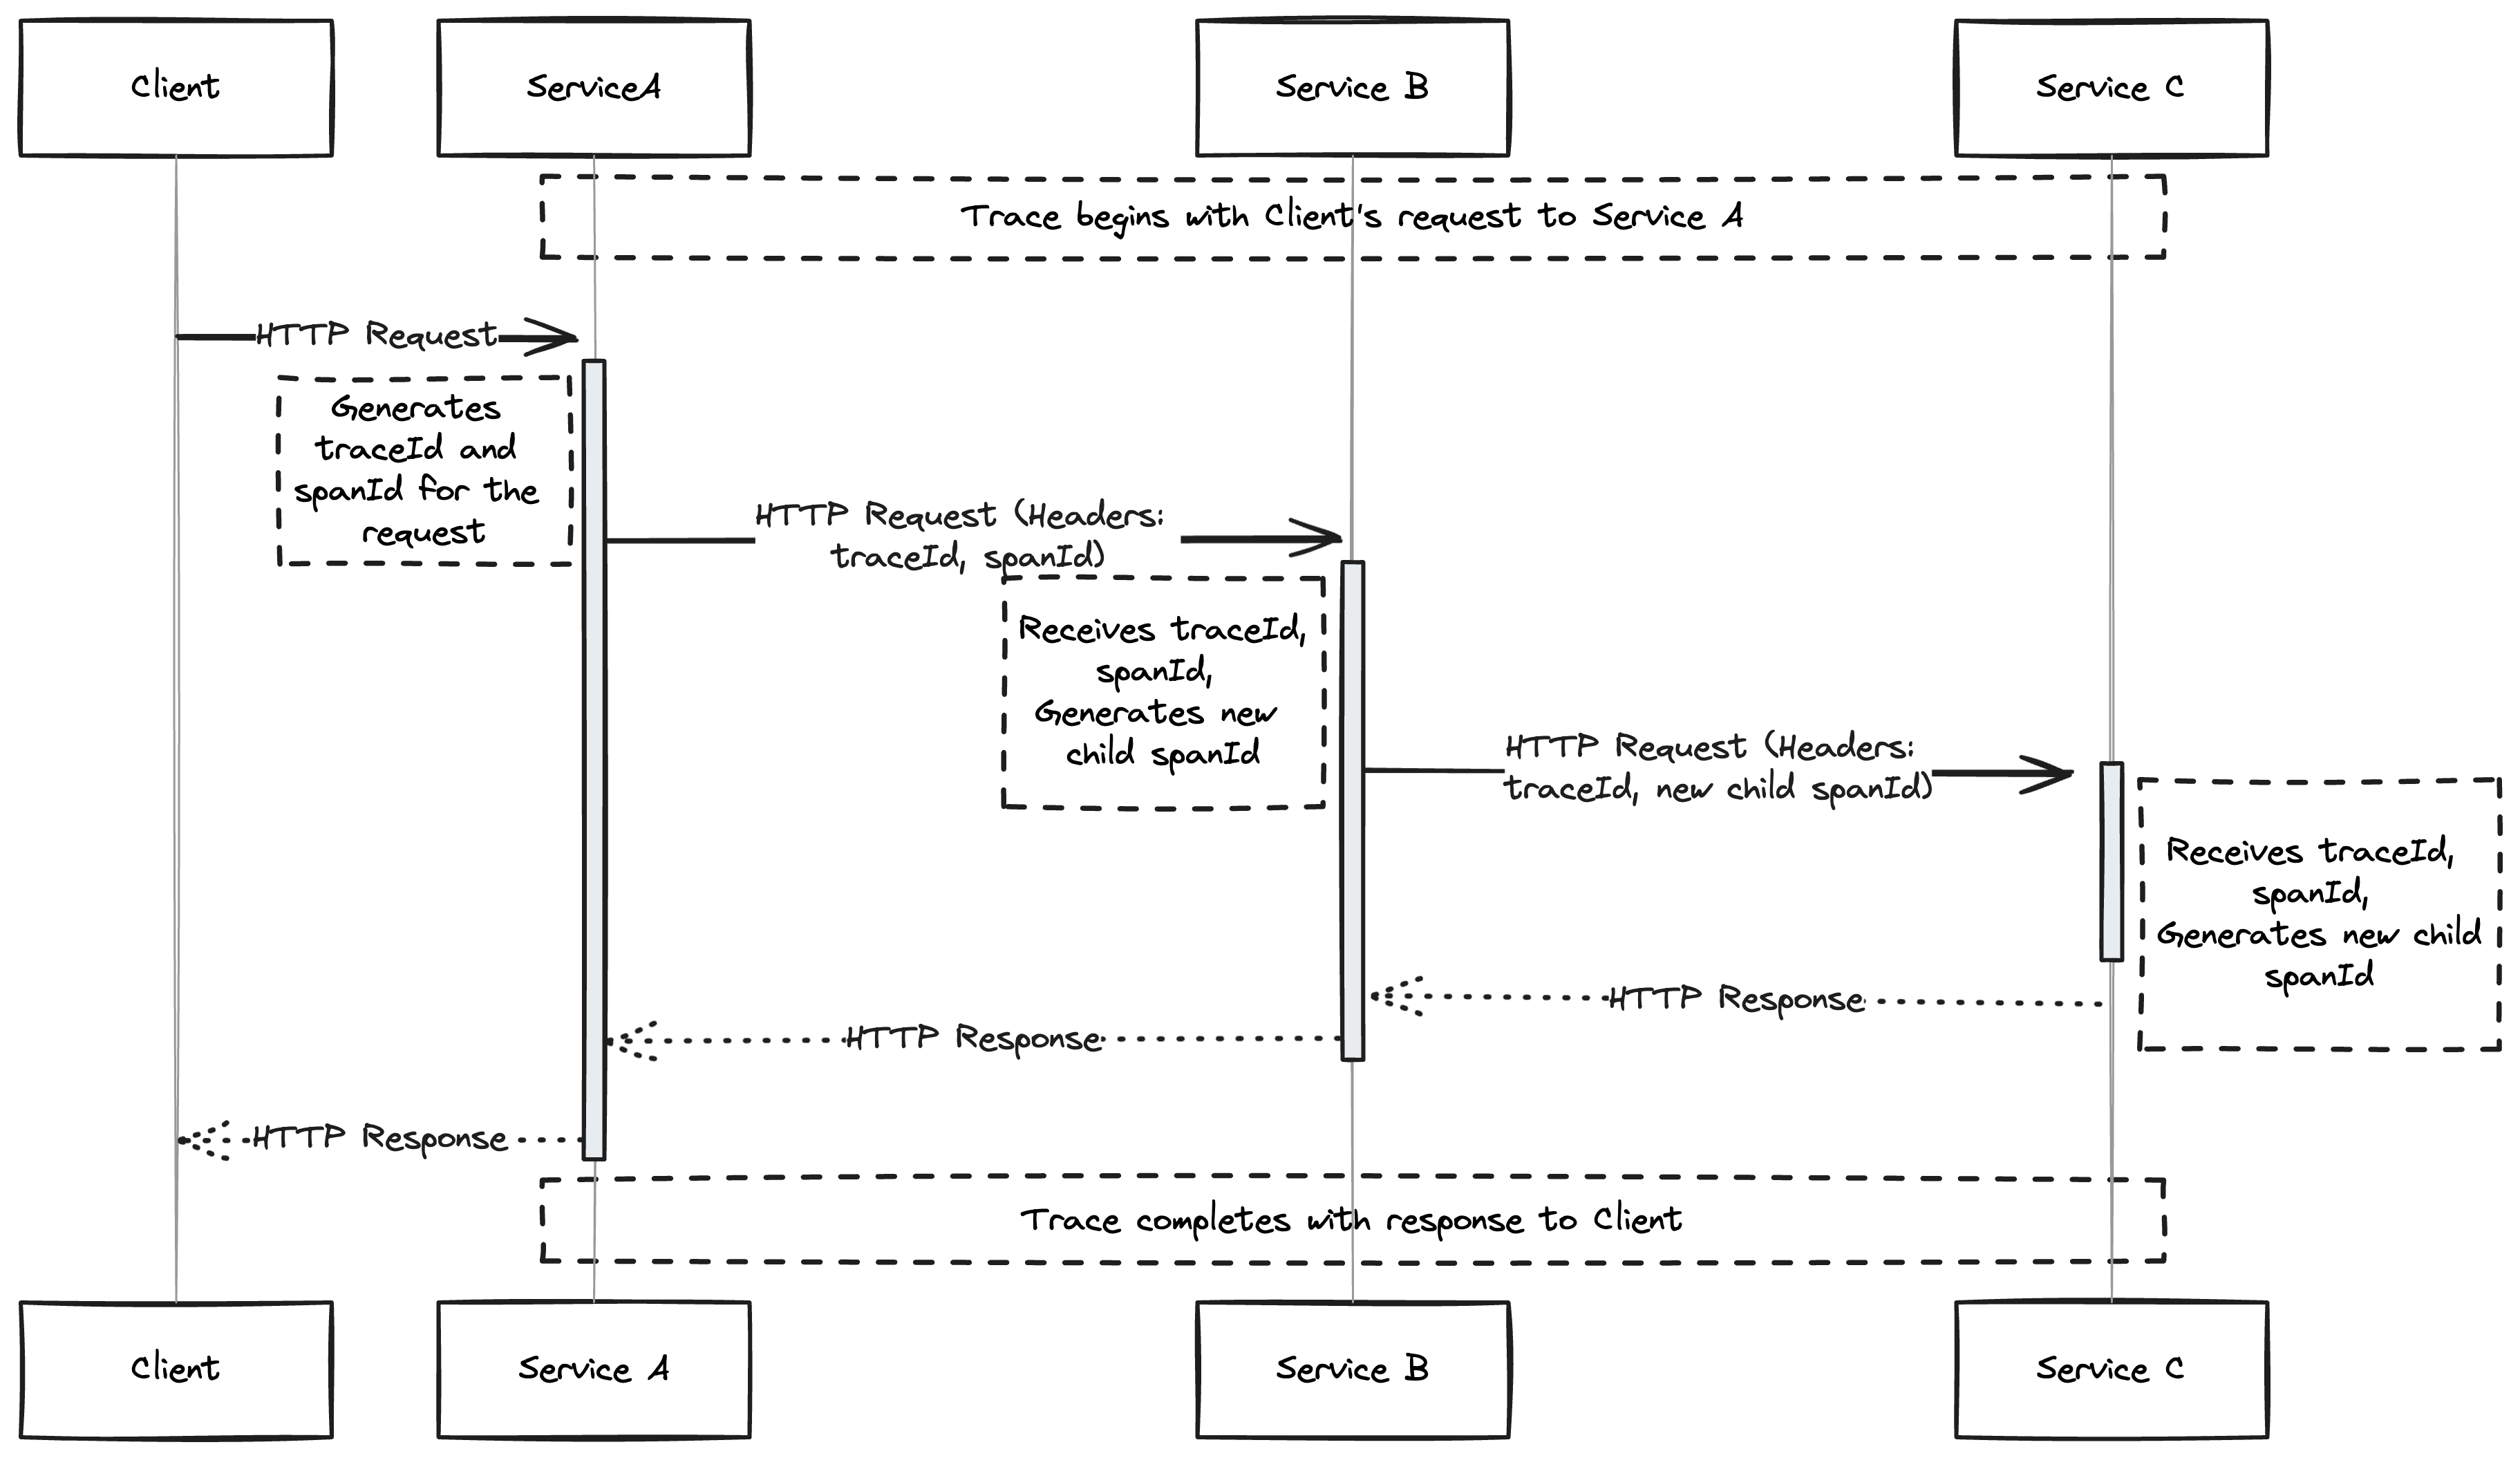
Different protocols have different ways of doing this. For HTTP, W3C recommends that this information is passed around in the traceparent header. It's then up to the service on the other side of the request to pull this information out of http request and propagate it down through all the code handling the request. Giving us something like this for a system with 3 microservices that communicate via HTTP.
So now we need some code which adds the traceparent header to our http requests. It might look like something like this for a request made with the standard go http client
// Get the traceId if it exists, otherwise generate one
traceId := ctx.Value("traceId")
if traceId == nil {
  traceId = generateTraceID()
}

// Generate the new child spanId
spanId := generateSpanID()

// Get the parent spanId if it exists
parentSpanId := ctx.Value("spanId")
spanName := "HTTP Operation"

startTime := time.Now()

// Create a new context with the spanId, indicating this span is now the parent for any child spans
ctxWithSpanId := context.WithValue(ctx, "spanId", spanId)

// Create an HTTP client and request
httpClient := createHttpClient()
httpRequest := createHttpRequest("http://my-upstream-microservice/api/endpoint")

// Add the traceparent header to the HTTP request
// The traceparent header format: traceId-parentSpanId (simplified)
traceparentValue := fmt.Sprintf("%s-%s", traceId, spanId)
httpRequest.Header.Add("traceparent", traceparentValue)

// Perform the HTTP call
response := httpClient.Do(httpRequest, ctxWithSpanId)
We also need code to read the value of the HTTP header when we receive a request in our chosen web framework. This is how it might look using Go's standard library HTTP server.
func handler(w http.ResponseWriter, r *http.Request) {
    // Extract the traceparent header
    traceparentHeader := r.Header.Get("traceparent")

    // Parse the traceparent header
    parts := strings.Split(traceparentHeader, "-")
    traceId := parts[0]
    parentSpanId := parts[1]

    // Pass these around to the rest of our code
}
Now writing all of this code to instrument communication libraries and frameworks and emitting traces seems like a lot of work.
Can we automate this? Why yes, we can.
There are three broad buckets of automated distributed tracing instrumentation. We'll dive deeper into each of these in a subsequent post, but for now here's a quick overview of each of them.
This approach uses libraries or plugins added to existing libraries to incorporate instrumentation into the application. These plugins or libraries are included at compile time and require application level changes.
For example, the otelgin Go library offers middleware that automatically propagates trace metadata for all requests passing through the Gin HTTP server, similar to the process we coded by hand before.
r := gin.New()
r.Use(otelgin.Middleware("my_service_name"))
...
This approach is effective across a wide variety of languages and libraries, offering the most flexibility but also being the most time-consuming.
This approach injects instrumentation into the application at runtime. This is a great option for languages which have a dynamic execution environment like python, java or node.js. An example of tooling targeting this class of instrumentation is the OpenTelemetry kubernetes operator which injects instrumentation libraries into containers at startup depending on their language.
The injected code automatically instruments a number of popular libraries in the specified language so as long as you're using one of the supported libraries then this is a great option which tends to work better than the the kernel level instrumentation and also doesn't require an application level change.
This instrumentation approach adds instrumentation at the level of the Kernel. In linux these tools tend to be based on eBPF like Cilium or Beyla.
They intercept syscalls and automatically emit spans. These tools don't require services (or their runtime) to be modified in any way and work with all languages so they're a great choice to get started with. However, the instrumentation is often coarse as it only has access to a small amount of information about the service.
Okay, now we know what a trace is, how spans link together and how we can get our applications instrumented and producing telemetry without too much manual work.
The next step is to get those spans exported somewhere they can be useful.
In order for trace information to be useful, we need to have a centralised location where we can query them. This location could be a commercial cloud observability provider like DataDog or an internally hosted trace store like Jaeger or Tempo.
When emitting your trace data to a trace store you have a couple of choices.
Ship the data to the store directly from the span creating service
Ship the data to a collector which then ships it to the store
Generally, using an intermediate collector like the OpenTelemetry Collector is a better choice as it gives you access to more advanced techniques like tail sampling and is more robust as your production services can offload the data quickly without worrying about retries, batching and a bunch of other concerns.
Each service establishes a connection with a collector and sends spans over the network as they're generated, open telemetry defines the OTLP protocol for sending telemetry which sits on top of gRPC or HTTP.
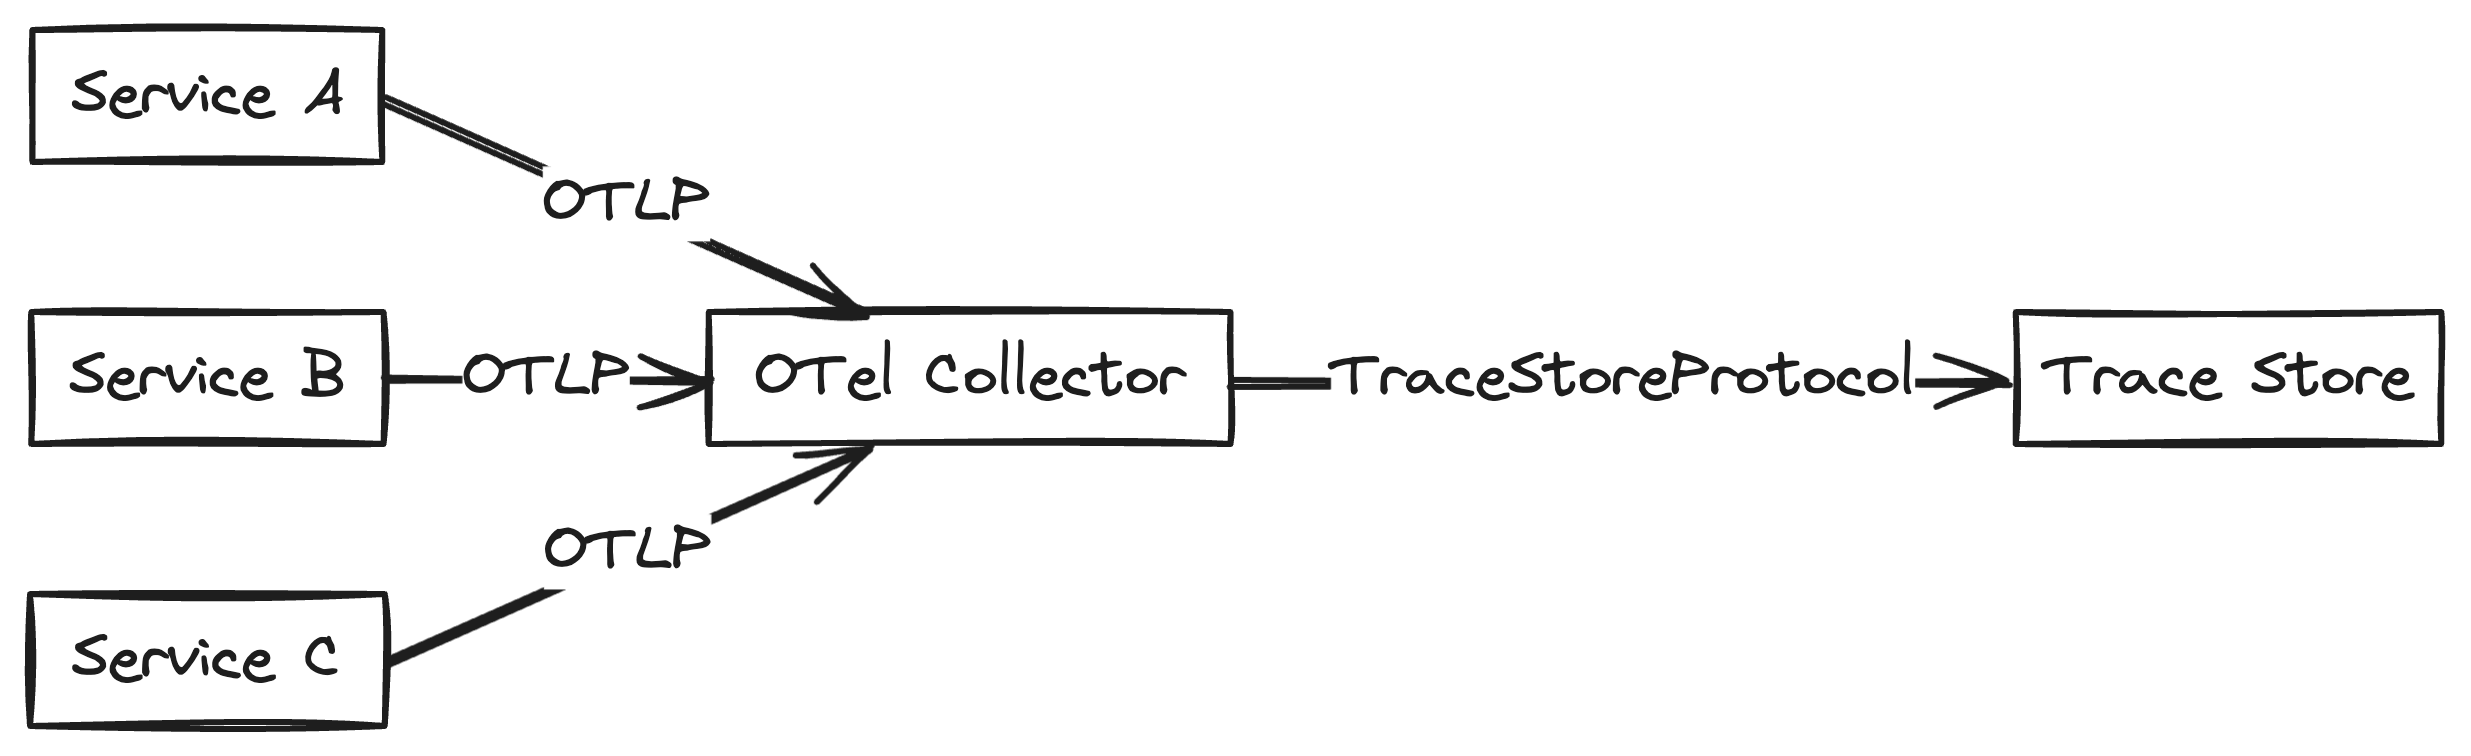
Now we have our services producing spans, they're sent to the collector which forwards them to the trace store. The trace store indexes these spans by the traceId and a bunch of other characteristics so you can run queries to find interesting behaviour in your systems.
Now you have a solid idea of what traces are, how they're generated and an idea of what they can be used for.
I'll be writing a new blog post each week on this space so subscribe to the newsletter if you found this interesting and let me know what topics you'd like to see!

More Metoro articles that deepen the same topic from another angle.
Detailed answers to common questions about microservices, starting from the basics and getting into the details
Read article →A technical deep-dive into how Metoro captures L7 protocol traffic and intercepts TLS-encrypted data using eBPF, enabling automatic observability without code changes
Read article →Learn what Kubernetes observability is and how to implement effective observability for your k8s clusters.
Read article →