> ## Documentation Index
> Fetch the complete documentation index at: https://metoro.io/docs/llms.txt
> Use this file to discover all available pages before exploring further.
# Traces Overview
> Understanding and utilizing traces in Metoro
Traces are a powerful tool to understand the flow of requests through your services. Metoro provides a centralized
location to view and query traces with zero configuration required. Traces are automatically generated for all your
services, including third party services through eBPF.
## How Tracing Works in Metoro
Metoro uses eBPF technology at its core to provide comprehensive tracing capabilities. The Metoro node agent runs on every host in your cluster and monitors all network calls, deserializing them to inspect the underlying protocols and create traces.
This means that you don't need to instrument your code to get tracing data. You can just start using Metoro and get traces for all your services, including third party services.
### Supported Protocols
Metoro currently supports tracing for the following protocols:
* HTTP(s)
* gRPC
* Postgres
* MySQL
* Redis
* Memcache
* MongoDB
* Kafka
* Cassandra
Every request made using these protocols from any container in your cluster is automatically recorded and sent to Metoro's observability backend for inspection.
### HTTPs Support
Metoro supports HTTPS tracing through eBPF instrumentation of SSL libraries (like OpenSSL and BoringSSL) within the binary itself. When calls to read or write TLS are made, Metoro inspects the unencrypted content at the kernel level, without modifying any application code.
## Trace Attributes
Each trace is enriched with various attributes depending on the protocol. Common attributes across all protocols include:
* Client namespace
* Server namespace
* Client container ID
* Server container ID
* Client availability zone
* Server availability zone
* Server service name
* Client service name
Protocol-specific attributes are also captured. For example, HTTP traces include:
* HTTP path
* HTTP status code
* HTTP URL
* HTTP host
* HTTP flavor
* Request duration
For database protocols, Metoro decodes and records the actual queries, providing visibility into every database operation.
## Trace Redaction
Metoro provides comprehensive trace redaction capabilities to protect sensitive information in your traces. For detailed information about configuring and managing trace redaction, see the [Trace Redaction](/docs/traces/redaction) documentation.
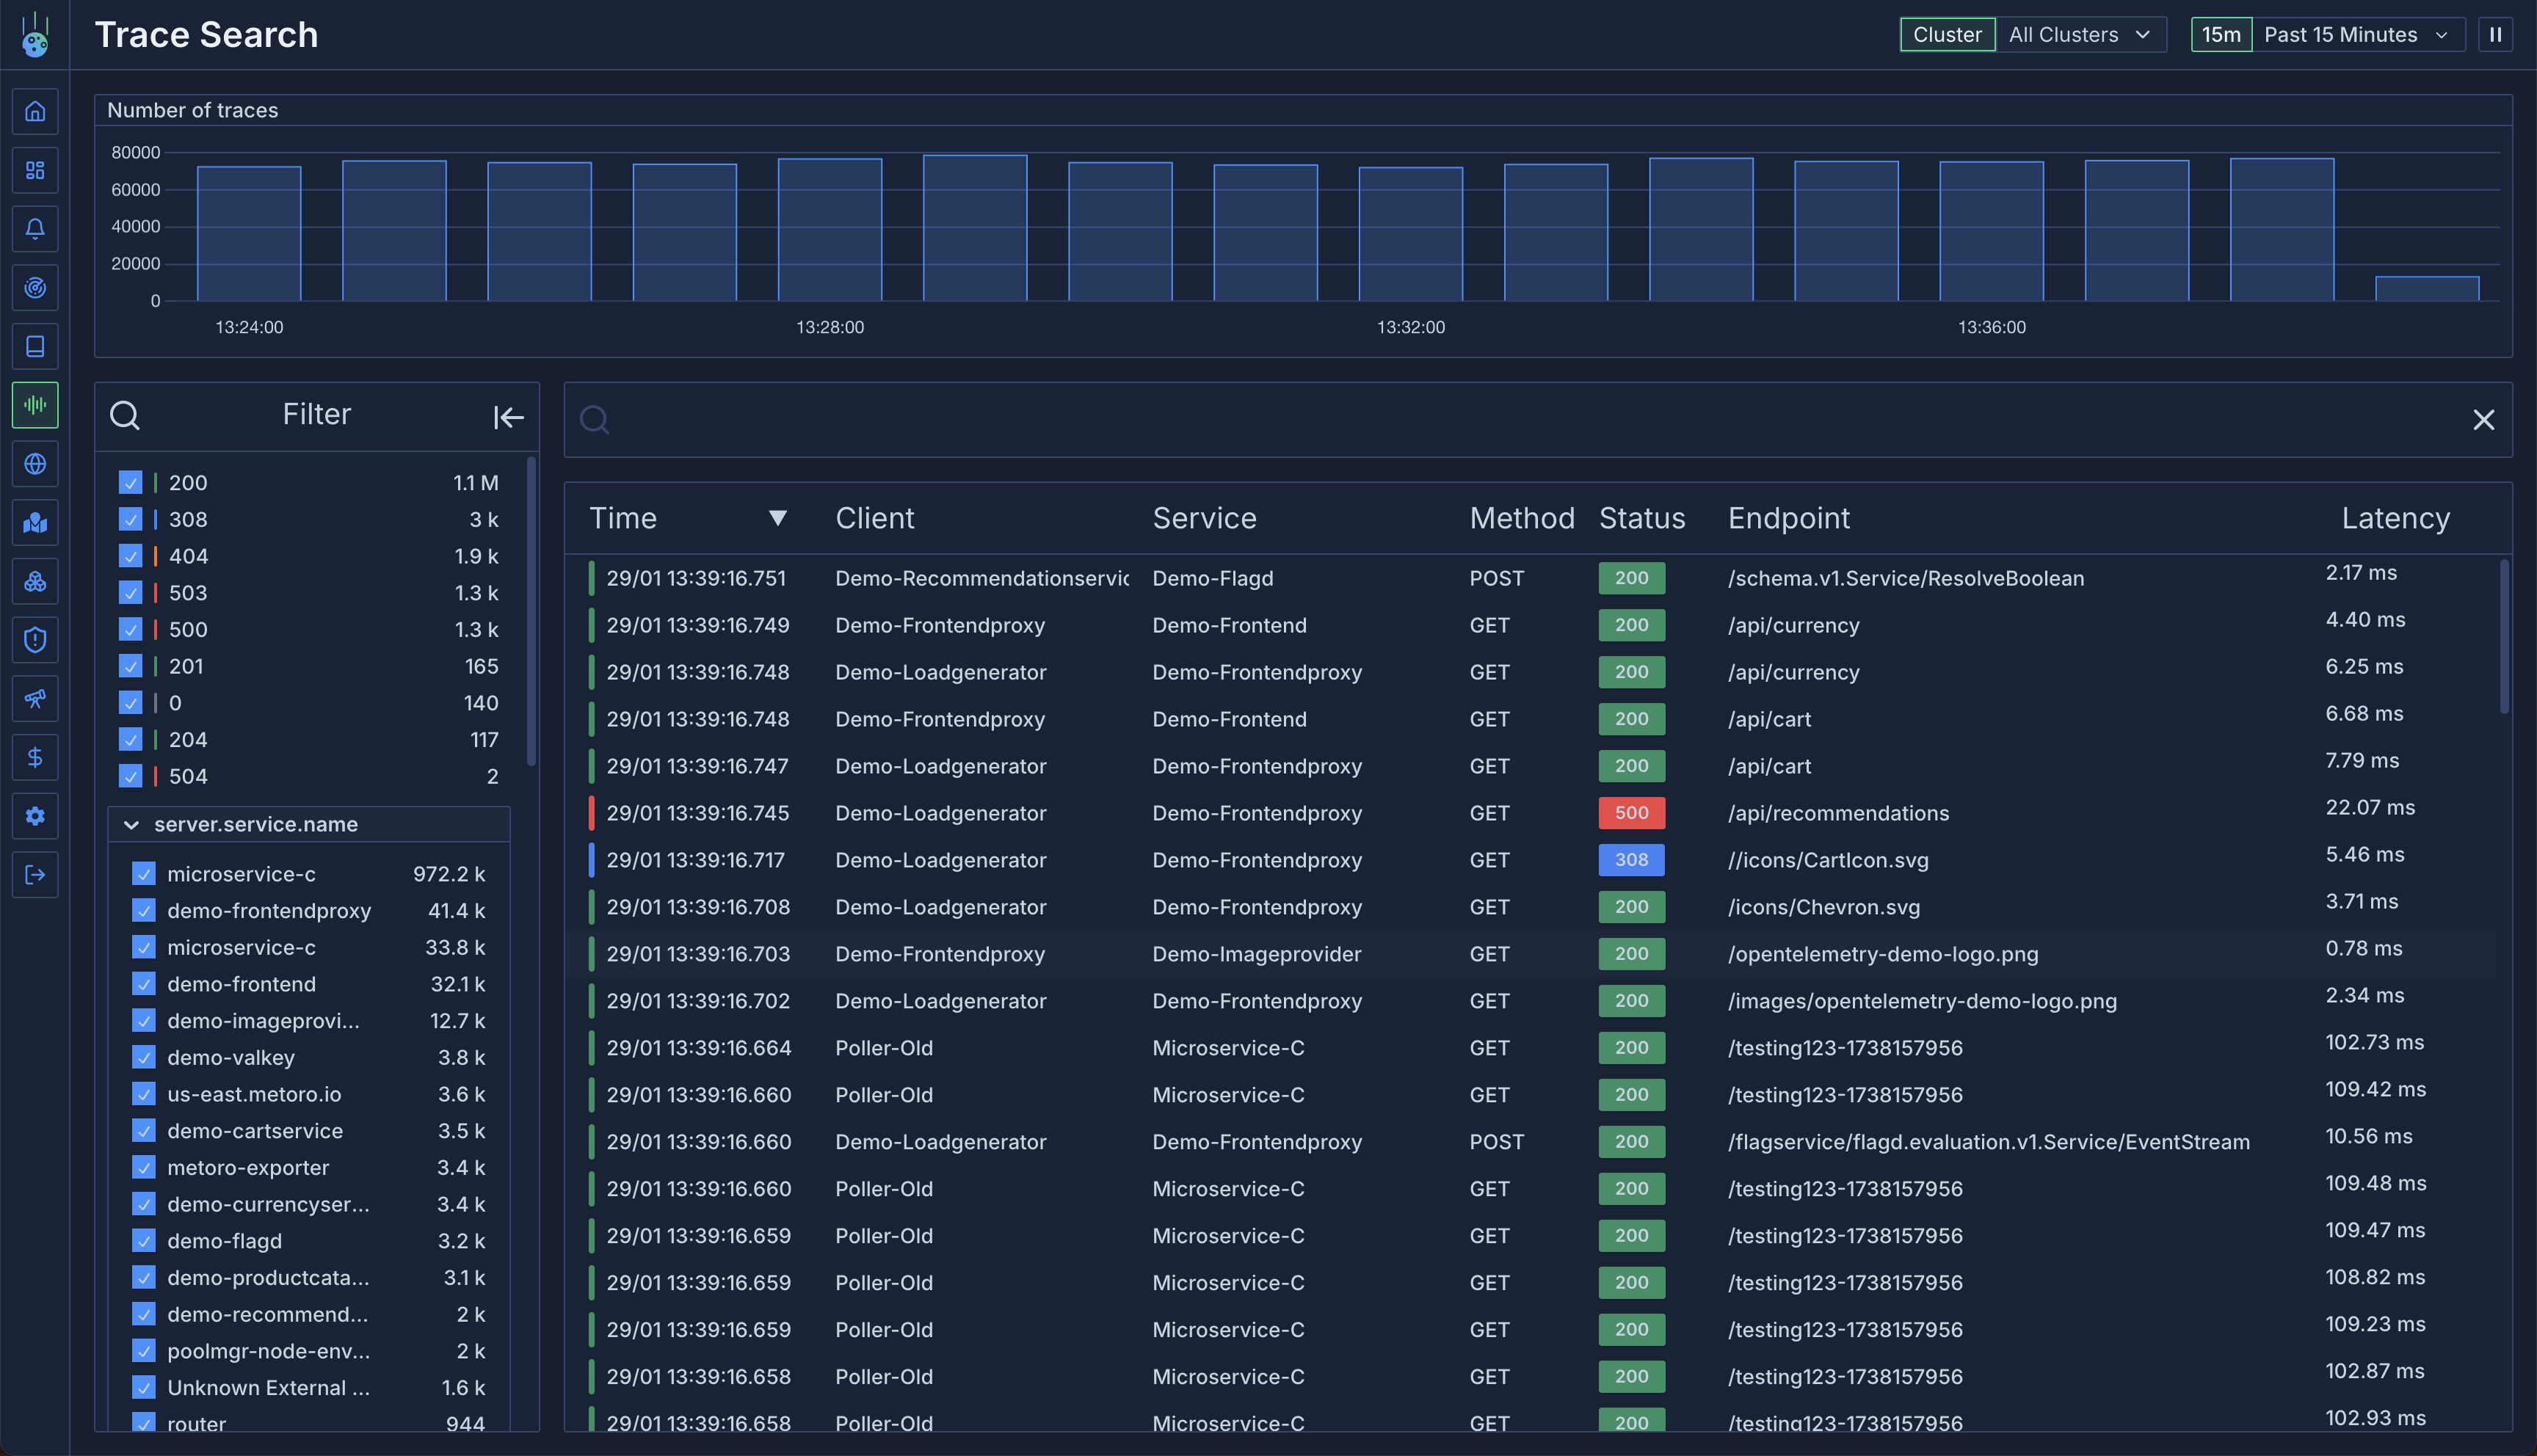
## The Trace View
The trace view provides a powerful interface to explore and analyze your traces across all clusters. You can filter traces using:
* Any trace attribute
* Regex search patterns
* Time-based filtering
You can use regex search on any trace attribute by using the syntax `attribute = regex: `. For example:
* `service.name = regex: .*metoro.*` will match traces from any service containing "metoro"
* `http.path = regex: /api/v1/.*` will match HTTP paths starting with "/api/v1/"
* `http.status_code = regex: ^5.*` will match all 5XX status codes
You can also compare attribute values numerically using the operators `>`, `>=`, `<`, `<=` (via the operator picker on a filter pill, or by prefixing the value), or an inclusive range `range:low..high`. For example:
* `http.status_code >= 500` will match all 5XX responses
* `retry_count = range:1..3` will match retry counts between 1 and 3 inclusive
* `duration > 500000000` will match spans slower than 500ms (the reserved `duration` key is the span duration in nanoseconds)
Attribute values that are missing or not numeric never match a comparison (and are kept by a negated comparison).
The `range:` prefix is required for ranges: a value written as `1..3` without the prefix is a plain string equality match, so attribute values that happen to contain `..` remain searchable as literal strings. To match a value that itself starts with an operator character (e.g. the literal string `>500`), use a regex filter: `regex:>500`.
### Viewing Logs in Context
The trace view now includes integrated log viewing capabilities, allowing you to see logs alongside your traces:
**Trace-Level Logs**: Click the "View Logs" button next to "Share Trace" to see all logs associated with the entire trace. This provides a comprehensive view of what happened during the request flow.
**Span-Level Logs**: Click on any individual span to open the details panel, then switch to the "Logs" tab to see logs specific to that span. This helps you debug issues at a granular level.
**Smart Filtering**: The log view automatically filters by:
* `traceId` when viewing trace-level logs
* `spanId` when viewing logs for a specific span
* Properly handles linked traces (eBPF to OpenTelemetry) by using the appropriate trace ID
This integrated experience eliminates the need to switch between different views when debugging issues, providing all the context you need in one place.
 ## Service Map Generation
Metoro automatically generates [service maps](/docs/concepts/overview) based on the traced communications between services. This provides a visual representation of how your services interact with each other, making it easier to understand your application's architecture and dependencies.
### Bring Your Own Tracing (OpenTelemetry)
eBPF tracing is a powerful tool, but it does have some limitations, it does not support all protocols and does not currently support distributed tracing (ebpf creates individual spans but is unable to track chains of request calls currently). If you are already using OpenTelemetry, you can send your traces to Metoro by configuring the [OpenTelemetry Collector](https://opentelemetry.io/docs/collector/) to send traces to Metoro.
The Metoro exporter is a fully compliant opentelemetry collector, so you can send your traces to Metoro to be queried and visualized.
Follow the guide at [OpenTelemetry Tracing Integration](/docs/traces/opentelemetry)
## RED Metrics Generation
The trace data is used to generate various RED Metrics (Rate, Errors, Duration), including:
* Request metrics
* Error metrics
* Duration metrics
These metrics are available in the [Service View](/docs/concepts/overview) or in [Custom Dashboards](/docs/dashboards/overview) and provide valuable insights into your application's performance and behavior.
Discover how Metoro organizes and visualizes your service data
## Service Map Generation
Metoro automatically generates [service maps](/docs/concepts/overview) based on the traced communications between services. This provides a visual representation of how your services interact with each other, making it easier to understand your application's architecture and dependencies.
### Bring Your Own Tracing (OpenTelemetry)
eBPF tracing is a powerful tool, but it does have some limitations, it does not support all protocols and does not currently support distributed tracing (ebpf creates individual spans but is unable to track chains of request calls currently). If you are already using OpenTelemetry, you can send your traces to Metoro by configuring the [OpenTelemetry Collector](https://opentelemetry.io/docs/collector/) to send traces to Metoro.
The Metoro exporter is a fully compliant opentelemetry collector, so you can send your traces to Metoro to be queried and visualized.
Follow the guide at [OpenTelemetry Tracing Integration](/docs/traces/opentelemetry)
## RED Metrics Generation
The trace data is used to generate various RED Metrics (Rate, Errors, Duration), including:
* Request metrics
* Error metrics
* Duration metrics
These metrics are available in the [Service View](/docs/concepts/overview) or in [Custom Dashboards](/docs/dashboards/overview) and provide valuable insights into your application's performance and behavior.
Discover how Metoro organizes and visualizes your service data