# AWS Marketplace
Source: https://metoro.io/docs/administration/billing-aws-marketplace
Metoro supports both Stripe (default) and AWS Marketplace for billing. You can swap between the different methods at any time.
## Move to AWS Marketplace from Stripe
When switching from AWS Marketplace to Stripe, you will be immediately charged on Stripe for usage accrued in the current billing cycle. A new billing cycle will start in AWS from the day you switch.
1. Log in to the Metoro account you would like to connect your AWS account to.
2. Make sure you are an admin by heading to [settings](https://us-east.metoro.io/settings) and clicking on the **Users** tab.
3. Connect your AWS account to your Metoro account.
1. Head to [https://aws.amazon.com/marketplace/pp/prodview-4v43fz25vi6ug](https://aws.amazon.com/marketplace/pp/prodview-4v43fz25vi6ug)
2. Click **View purchase options**
3. Click **Subscribe**
4. Switch from Stripe to AWS Marketplace
1. Head into [billing](https://us-east.metoro.io/billing) and click on `Update your billing location`.
2. Select **AWS Marketplace**.
3. Click **Switch to AWS Marketplace billing**
## Move from AWS Marketplace to Stripe
When switching from AWS to Stripe, you will be charged both on AWS and on Stripe. You will be charged for all usage accrued up to the current time on AWS Marketplace.
A new billing cycle will start in Stripe from the day you switch and all subsequent usage will be charged to Stripe
1. Head into [billing](https://us-east.metoro.io/billing) and click on `Update your billing location`.
2. Select **AWS Marketplace**.
3. Click **Switch to AWS Marketplace billing**
## Viewing Metoro usage in the AWS Console
Head to **Cost Explorer** in the AWS Console, you will see a line item for Metoro usage.
Metoro reports usage to AWS Marketplace every hour on the hour however AWS Marketplace may only show this after a day.
## Cancellation
To cancel your Metoro susbscription, [move to Stripe billing](#move-from-aws-marketplace-to-stripe) and then move yourself to the hobby tier by following the instructions at \[/docs/billing-stripe#cancellation]
## Differences in billing
When billing through Stripe, Metoro charges per node-minute, each hour the total number of node minutes is reported to Stripe. At the end of the billing cycle, Stripe charges your card at for the total number of accrued node minutes throughout the month.
When billing through AWS Marketplace, Metoro charges per node-hour due to a limitation in AWS Marketplace, reported every hour. The number of node hours is rounded down to nearest hour. So in the case of 1.1 node hours, Metoro will charge for only 1 node hour.
# Billing
Source: https://metoro.io/docs/administration/billing-overview
Metoro bills on a usage model. The amount charged is based on the number of nodes that Metoro is monitoring.
Metoro records the number of nodes that are being monitored every minute and records the total number of node minutes used every hour.
Every hour, Metoro reports that sends that information to a billing provider. Each billing provider aggregates that usage and charges you at the end of the billing cycle.
All billing cycles in Metoro are monthly unless you are on the Enterprise plan in which case billing cycles are on a case by case basis.
Metoro curently supports two billing providers, go to their respective docs to see more information.
* [Stripe](/administration/billing-stripe)
* [AWS Marketplace](/administration/billing-aws-marketplace)
## Trial Period
All Metoro subscriptions come with a 14-day trial period. This applies regardless of the number of nodes.
## Viewing usage information
To view usage information, you can head to [billing](https://us-east.metoro.io/billing). At the bottom of the page, you will see a table of usage information for the last 14 days.

# Stripe
Source: https://metoro.io/docs/administration/billing-stripe
Stripe is the default billing method for Metoro. If you haven't explicitly changed to something else then you will be useing Stripe.
## Upgrading to the Scale plan
To upgrade to the Scale plan, just click on the Scale plan in [billing](https://us-east.metoro.io/billing).
You will then be taken to stripe where you can enter a credit card to be charged.
Alternatively, you can choose to pay through AWS Marketplace. See instructions [here](/administration/billing-aws-marketplace).
## Updating payment method
To update your payment details:
1. Head to [billing](https://us-east.metoro.io/billing)
2. Click **Update your billing details**. You will then be redirected to Stripe.
3. In stripe you can update your payment method
## Getting previous invoices
To get previous invoices:
1. Head to [billing](https://us-east.metoro.io/billing)
2. Click **Update your billing details**. You will then be redirected to Stripe.
3. In Stripe, you can download any of your last invoices to get an itemised receipt.
## Cancellation
To cancel your Metoro membership, move yourself to the hobby tier by clicking on the plan in [billing](https://us-east.metoro.io/billing).
When you move to the hobby plan, you will immediately be charged for the amount used in the current billing cycle on your existing plan. No further charges will be made.
# On-Premises Installation & Management
Source: https://metoro.io/docs/administration/on-premises
Guide for installing and managing Metoro in an on-premises environment
This guide provides detailed instructions for installing and managing Metoro in an on-premises environment.
It covers system requirements, installation steps, and best practices for maintaining your deployment.
## Prerequisites
Before beginning the installation, ensure your environment meets the following requirements:
* Kubernetes cluster (v1.19 or later)
* Helm 3.x installed
* Resource requirements per node for the Metoro Agent:
* CPU: 0.3 cores
* Memory: 300MB RAM
* Total resource requirements for the Metoro Hub:
* CPU: 4 cores
* Memory: 8GB RAM
* Network requirements:
* Access to quay.io/metoro repositories for pulling images (optional if using your own private registry)
* Internal network connectivity between cluster nodes
* Ingress controller for external access (recommended)
## Quick Start
### 1. Get Access to Required Resources
Contact us to get access to the Helm charts and private image repositories:
* Join our [Community Slack Channel](https://join.slack.com/t/metorocommunity/shared_invite/zt-2makpjl5j-F0WcpGnPcdc8anbNGcewqw)
* Email us at [support@metoro.io](mailto:support@metoro.io)
You will receive:
* Helm repository (zipped)
* Image repository pull secret
### 2. Prepare the Installation
1. Extract the helm chart:
```bash
unzip helm.zip && cd helm
```
2. Set your kubectl context:
```bash
kubectl config use-context CLUSTER_YOU_WANT_TO_INSTALL_INTO
```
### 3. Install Metoro Hub
Install the Metoro hub using Helm:
```bash
helm upgrade --install \
--namespace metoro-hub \
--create-namespace \
metoro ./ \
--set clickhouse.enabled=true \
--set postgresql.enabled=true \
--set onPrem.isOnPrem=true \
--set imagePullSecret.data= \
--set apiserver.replicas=1 \
--set ingester.replicas=1 \
--set temporal.enabled=true \
--set ingester.autoscaling.horizontalPodAutoscaler.enabled=false \
--set apiserver.autoscaling.horizontalPodAutoscaler.enabled=false
```
If the Clickhouse pod remains in pending state, it's likely due to insufficient cluster resources. You can adjust the resource limits in the Clickhouse StatefulSet definition.
### 4. Access the UI
1. Port forward the API server:
```bash
kubectl port-forward -n metoro-hub service/apiserver 8080:80
```
2. Create an account:
* Navigate to [http://localhost:8080](http://localhost:8080)
* Create a new account (do not use SSO options for on-prem installations)
### 5. Install the Metoro Agent
1. After logging in, select "Existing Cluster" and enter your cluster's name
2. Copy the `exporter.secret.bearerToken` value from the installation screen
3. Run the installation command:
```bash
bash -c "$(curl -fsSL http://localhost:8080/install.sh)" -- \
TOKEN_HERE \
http://ingester.metoro-hub.svc.cluster.local/ingest/api/v1/otel \
http://apiserver.metoro-hub.svc.cluster.local/api/v1/exporter \
--existing-cluster \
--on-prem
```
## Advanced Configuration - Production
### Minimal Production Configuration
For the metoro-hub values.yaml:
```yaml
clickhouse:
enabled: true
auth:
password: "CHANGE_ME_CLICKHOUSE_PASSWORD" # Use a random password
postgresql:
enabled: true
auth:
password: "CHANGE_ME_POSTGRES_PASSWORD" # Use a random password
onPrem:
isOnPrem: true
imagePullSecret:
data: "IMAGE_PULL_SECRET"
authSecret:
authMaterial: "CHANGE_ME_AUTH_MATERIAL" # Use a random string
apiserver:
replicas: 2
autoscaling:
horizontalPodAutoscaler:
enabled: false
defaultOnPremAdmin:
email: "YOUR_EMAIL_CHANGE_ME"
password: "YOUR_PASSWORD_CHANGE_ME"
name: "YOUR NAME_CHANGE_ME"
organization: "YOUR_ORGANIZATION_CHANGE_ME"
environmentName: "YOUR_ENVIRONMENT_NAME_CHANGE_ME"
temporal:
enabled: true
server:
config:
persistence:
default:
sql:
password: "CHANGE_ME_POSTGRES_PASSWORD" # Use the same password as the postgres above
visibility:
sql:
password: "CHANGE_ME_POSTGRES_PASSWORD" # Use the same password as the postgres above
ingester:
replicas: 2
autoscaling:
horizontalPodAutoscaler:
enabled: false
```
Then install with the following command:
```bash
helm upgrade --install --namespace metoro-hub --create-namespace metoro ./ -f values.yaml
```
For the metoro-exporter values.yaml:
```yaml
exporter:
image:
tag: "0.841.0"
envVars:
mandatory:
otlpUrl: "http://ingester.metoro-hub.svc.cluster.local/ingest/api/v1/otel"
apiServerUrl: "http://apiserver.metoro-hub.svc.cluster.local/api/v1/exporter"
secret:
externalSecret:
enabled: true
name: "on-prem-default-exporter-token-secret"
secretKey: "token"
nodeAgent:
image:
tag: "0.65.0"
```
Then install with the following command:
```bash
helm repo add metoro-exporter https://metoro-io.github.io/metoro-helm-charts/ ;
helm repo update metoro-exporter;
helm upgrade --install --create-namespace --namespace metoro metoro-exporter metoro-exporter/metoro-exporter -f values.yaml
```
### Securing the Metoro Hub
Before deploying in production, you should change at least the following settings in the Metoro Hub Helm chart:
```yaml
apiserver:
defaultOnPremAdmin:
password: "CHANGE_ME_TO_SECURE_PASSWORD" # Change this to a secure password, you'll use this to log in to the UI for the first time
postgresql:
auth:
password: "CHANGE_ME_POSTGRES_PASSWORD" # Use a random password
clickhouse:
auth:
password: "CHANGE_ME_CLICKHOUSE_PASSWORD" # Use a random password
authSecret:
authMaterial: "CHANGE_ME_AUTH_MATERIAL" # Use a random string
temporal:
server:
config:
persistence:
default:
sql:
password: "CHANGE_ME_POSTGRES_PASSWORD" # Use the same password as above
visibility:
sql:
password: "CHANGE_ME_POSTGRES_PASSWORD" # Use the same password as above
onPrem:
isOnPrem: true
```
### Connecting the exporter to the Metoro Hub via helm
The exporter needs to be configured to connect to the Metoro hub. This can either be done through the UI or by setting the following values in the hub helm chart:
```yaml
apiserver:
defaultOnPremAdmin:
email: "YOUR_EMAIL"
password: "YOUR_PASSWORD"
name: "YOUR NAME"
organization: "YOUR ORGANIZATION"
environmentName: "YOUR ENVIRONMENT NAME"
```
Then when installing the exporter, you can set the following values:
```yaml
exporter:
secret:
externalSecret:
enabled: true
name: "on-prem-default-exporter-token-secret"
secretKey: "token"
```
### Using a different image registry
If you want to use a different image registry, you can set the `imagePullSecret` field in the Helm chart values file to a secret containing the pull secret.
```yaml
imagePullSecret:
name: "my-registry-credentials"
data: "dockerconfigjson-encoded-value"
```
### High Availability Setup
For production environments requiring high availability.
We also recommend using external databases for increased availability and performance. Check out the [external database configuration](#external-database-configuration) section for more details.
The postgres chart doesn't have great support for HA.
The Clickhouse chart has built-in HA support.
```yaml
ingester:
replicas: 2
autoscaling:
horizontalPodAutoscaler:
enabled: true
minReplicas: 2
maxReplicas: 4
targetCPUUtilizationPercentage: 60
apiserver:
replicas: 2
autoscaling:
horizontalPodAutoscaler:
enabled: true
minReplicas: 2
maxReplicas: 4
targetCPUUtilizationPercentage: 60
clickhouse:
enabled: true
persistence:
size: 100Gi
replicaCount: 3
postgresql:
enabled: true
persistence:
size: 20Gi
primary:
replicaCount: 3
```
### External Database Configuration
To use external databases instead of the built-in ones:
```yaml
clickhouse:
enabled: false
clickhouseSecret:
name: "clickhouse-secret"
clickhouseUrl: "clickhouse://xxxxxxx.us-east-1.aws.clickhouse.cloud:9440"
clickhouseUser: "username"
clickhousePassword: "password"
clickhouseDatabase: "metoro"
postgresql:
enabled: false
postgresSecret:
name: "postgres-secret"
postgresHost: "prod-us-east.cluster-xxxxxxx.us-east-1.rds.amazonaws.com"
postgresPort: "5432"
postgresUser: "postgres"
postgresPassword: "password"
postgresDatabase: "metoro"
# This needs to be matched with the postgresSecret values
temporal:
server:
config:
persistence:
default:
driver: sql
sql:
driver: postgres12
database: temporal
user: postgres
password: password
host: "prod-us-east.cluster-xxxxxxx.us-east-1.rds.amazonaws.com"
port: 5432
visibility:
driver: sql
sql:
driver: postgres12
database: temporal_visibility
user: postgres
password: CHANGE_ME
host: "prod-us-east.cluster-xxxxxxx.us-east-1.rds.amazonaws.com"
port: 5432
```
### Ingress Configuration
Enable ingress for external access:
```yaml
apiserver:
# Match this with the hostname of the ingress
deploymentUrl: http(s)://metoro.yourdomain.com
ingress:
enabled: true
className: "nginx"
annotations:
kubernetes.io/ingress.class: nginx
cert-manager.io/cluster-issuer: "letsencrypt-prod"
hosts:
- host: "metoro.yourdomain.com"
paths:
- path: /
pathType: Prefix
tls:
- secretName: metoro-tls
hosts:
- metoro.yourdomain.com
ingester:
ingress:
enabled: true
className: "nginx"
annotations:
kubernetes.io/ingress.class: nginx
cert-manager.io/cluster-issuer: "letsencrypt-prod"
hosts:
- host: "ingest.metoro.yourdomain.com"
paths:
- path: /
pathType: Prefix
tls:
- secretName: metoro-ingester-tls
hosts:
- ingest.metoro.yourdomain.com
```
## Maintenance
### Upgrading Metoro
Minor version upgrades can just be installed using a helm upgrade command.
```bash
helm upgrade --install --namespace metoro-hub ./ -f values.yaml
```
Major version upgrades will require a more in-depth migration process. Each major release will have a migration guide available on the Metoro website and in the helm chart itself.
## Support and Resources
For additional support:
* Reach out to us directly via your dedicated slack connect channel
* Join our [Slack community](https://join.slack.com/t/metorocommunity/shared_invite/zt-2makpjl5j-F0WcpGnPcdc8anbNGcewqw)
* Contact us at [support@metoro.io](mailto:support@metoro.io)
* Live chat via intercom on [metoro.io](https://metoro.io) (bottom right of the page)
## Configuration Reference
| Key | Type | Default | Description |
| --------------------------------------------------------------------------- | ------------- | ------------------------------------------- | --------------------------------------------------- |
| apiserver.defaultOnPremAdmin.email | string | "[admin@metoro.io](mailto:admin@metoro.io)" | Default admin email address set up on first login |
| apiserver.defaultOnPremAdmin.environmentName | string | "Default Environment" | Default environment name set up on first login |
| apiserver.defaultOnPremAdmin.name | string | "Admin" | Default admin name set up on first login |
| apiserver.defaultOnPremAdmin.organization | string | "Default Organization" | Default organization name set up on first login |
| apiserver.defaultOnPremAdmin.password | string | "admin123" | Default admin password set up on first login |
| apiserver.defaultOnPremAdmin.serviceAccount.annotations | object | `{}` | Service account annotations |
| apiserver.defaultOnPremAdmin.serviceAccount.create | boolean | `true` | Whether to create a service account |
| apiserver.deploymentUrl | string | `"https://somedeploymenturl.tld..."` | Deployment URL for the API server |
| apiserver.image.pullPolicy | string | `"IfNotPresent"` | Image pull policy for API server container |
| apiserver.image.repository | string | `"quay.io/metoro/metoro-apiserver"` | Docker image repository for API server |
| apiserver.ingress.annotations | object | `{"kubernetes.io/ingress.class": "nginx"}` | Ingress annotations for API server |
| apiserver.ingress.className | string | `"nginx"` | Ingress class name for API server |
| apiserver.ingress.enabled | boolean | `false` | Enable/disable ingress for API server |
| apiserver.ingress.hosts\[0].host | string | `"api.local.test"` | Ingress hostname for API server |
| apiserver.ingress.hosts\[0].paths\[0].path | string | `"/"` | Path for ingress rule |
| apiserver.ingress.hosts\[0].paths\[0].pathType | string | `"Prefix"` | Path type for ingress rule |
| apiserver.name | string | "apiserver" | Name of the API server component |
| apiserver.replicas | integer | 4 | Number of API server replicas |
| apiserver.resources.limits.cpu | string/number | 4 | CPU resource limit for API server |
| apiserver.resources.limits.memory | string | "16Gi" | Memory resource limit for API server |
| apiserver.resources.requests.cpu | string/number | 1 | Requested CPU resources for API server |
| apiserver.resources.requests.memory | string | "2Gi" | Requested memory resources for API server |
| apiserver.service.name | string | "apiserver" | Name of the API server service |
| apiserver.service.port | integer | 80 | Service port for API server |
| apiserver.service.targetPort | integer | 8080 | Target port for API server service |
| apiserver.service.type | string | "ClusterIP" | Kubernetes service type for API server |
| authSecret.authMaterial | string | "SOME\_AUTH\_MATERIAL" | Authentication material used to sign JWTs |
| authSecret.name | string | "auth-secret" | Name of the authentication secret |
| clickhouse.containerPorts.tcp | integer | 9440 | TCP container port for in-cluster ClickHouse |
| clickhouse.containerPorts.tcpSecure | integer | 20434 | Secure TCP container port for in-cluster ClickHouse |
| clickhouse.enabled | boolean | false | Enable/disable in-cluster ClickHouse installation |
| clickhouse.persistence.size | string | "100Gi" | Storage size for in-cluster ClickHouse |
| clickhouse.replicaCount | integer | 1 | Number of ClickHouse replicas |
| clickhouse.resourcesPreset | string | "2xlarge" | Resource preset for ClickHouse |
| clickhouse.secret.clickhouseDatabase | string | "SOME\_CLICKHOUSE\_DATABASE" | ClickHouse database name |
| clickhouse.secret.clickhousePassword | string | "SOME\_CLICKHOUSE\_PASSWORD" | ClickHouse password |
| clickhouse.secret.clickhouseUrl | string | "SOME\_CLICKHOUSE\_HOST" | ClickHouse URL |
| clickhouse.secret.clickhouseUser | string | "SOME\_CLICKHOUSE\_USER" | ClickHouse user |
| clickhouse.secret.name | string | "clickhouse-secret" | Name of the ClickHouse secret |
| clickhouse.service.ports.tcp | integer | 9440 | TCP port for ClickHouse |
| clickhouse.service.ports.tcpSecure | integer | 20434 | Secure TCP port for ClickHouse |
| clickhouse.shards | integer | 1 | Number of ClickHouse shards |
| clickhouse.zookeeper.enabled | boolean | false | Enable/disable ZooKeeper for ClickHouse |
| environment | string | "none" | Environment for the deployment |
| imagePullSecret.data | string | "SOME\_DOCKERHUB\_CREDENTIAL" | Registry credentials in dockerconfigjson format |
| imagePullSecret.name | string | "dockerhub-credentials" | Name of the Docker registry credentials secret |
| ingester.autoscaling.horizontalPodAutoscaler.enabled | boolean | true | Enable/disable HPA for ingester |
| ingester.autoscaling.horizontalPodAutoscaler.maxReplicas | integer | 10 | Maximum number of replicas for HPA |
| ingester.autoscaling.horizontalPodAutoscaler.minReplicas | integer | 4 | Minimum number of replicas for HPA |
| ingester.autoscaling.horizontalPodAutoscaler.name | string | "metoro-ingester-hpa" | Name of the HPA |
| ingester.autoscaling.horizontalPodAutoscaler.targetCPUUtilizationPercentage | integer | 60 | Target CPU utilization percentage |
| ingester.configMap.name | string | "ingester-config" | Name of the ingester ConfigMap |
| ingester.image.pullPolicy | string | "IfNotPresent" | Image pull policy for ingester container |
| ingester.image.repository | string | "quay.io/metoro/metoro-ingester" | Docker image repository for ingester |
| ingester.name | string | "ingester" | Name of the ingester component |
| ingester.replicas | integer | 4 | Number of ingester replicas |
| ingester.resources.limits.cpu | string/number | 4 | CPU resource limit for ingester |
| ingester.resources.limits.memory | string | "16Gi" | Memory resource limit for ingester |
| ingester.resources.requests.cpu | string/number | 1 | Requested CPU resources for ingester |
| ingester.resources.requests.memory | string | "2Gi" | Requested memory resources for ingester |
| onPrem.isOnPrem | boolean | false | Flag for on-premises deployment |
| postgresql.enabled | boolean | false | Enable/disable in-cluster PostgreSQL |
| postgresql.auth.postgresPassword | string | "CHANGE\_ME" | PostgreSQL password |
| postgresql.persistence.size | string | "2Gi" | Storage size for PostgreSQL |
| temporal.enabled | boolean | false | Enable/disable Temporal |
| temporal.server.replicaCount | integer | 1 | Number of Temporal server replicas |
| versions.onprem.apiserver | string | "0.856.0" | API server version |
| versions.onprem.ingester | string | "0.856.0" | Ingester version |
# Alerts Overview
Source: https://metoro.io/docs/alerts-monitoring/alerts-overview
Set up alerts and monitoring in Metoro
Metoro provides comprehensive alerting and monitoring capabilities to help you stay on top of your Kubernetes infrastructure and applications. You can set up alerts based on various metrics, logs, traces and details/configuration of your kubernetes resources to get notified when something needs attention.
## Alert Types
Metoro supports several types of alerts:
1. **Metric Alerts**: Monitor any metric collected by Metoro, including:
* CPU and memory usage
* Network traffic
* Custom metrics from your applications
* Container metrics
* Node metrics
2. **Log Alerts**: Set up alerts based on log patterns or frequencies:
* Error frequency
* Specific log patterns using regex (re2 format)
* Log volume anomalies with log attribute filtering
* Custom log queries
3. **Trace Alerts**: Monitor your application's performance:
* Latency thresholds
* Error rates
* Request volume
* Service dependencies
4. **Kubernetes Resource Alerts**: Monitor the state of your Kubernetes resources:
* Pod status (e.g., CrashLoopBackOff, Pending)
* Number of replicas
* Resource limits and requests
## Managing Alerts
There are two ways to manage your alerts in Metoro:
1. Using the **Alerts page** in the Metoro UI.
* You can create, edit, and delete alerts directly from the UI.
* The UI provides a user-friendly interface for configuring alert conditions and notifications.
2. Defining your alerts in a Kubernetes ConfigMap.
* This is useful for version control and managing alerts as code.
* Every hour, Metoro will check for changes in the ConfigMap and update the alerts accordingly.
## Alert Resolution
When an alert is triggered:
1. The alert status changes to "Firing"
2. Notifications are sent to configured destinations (if not muted)
3. The alert remains active until:
* The condition returns to normal
* The alert is deleted
# Creating/Updating an Alert
Source: https://metoro.io/docs/alerts-monitoring/create_alert
Set up alerts in Metoro
# Creating and Managing Alerts in Metoro
Metoro provides two methods for creating and managing alerts:
1. Using the Metoro UI
2. Using Kubernetes ConfigMaps
## Managing Alerts Using the UI
To create a new alert using the Metoro UI:
1. Navigate to the [Alerts page](https://us-east.metoro.io/alerts)
2. Click on the **Create Alert** button
3. Configure your alert conditions. For more information about alert configuration, please check the [API documentation](https://metoro.io/docs/api-reference/alerts/createupdate-alert#body-alert-metadata).

You can update existing alerts by clicking on the alert name in the list. This will take you to the alert details page.
You can click `Edit` to modify alert configuration.
You need 'update' permissions on alerts to edit an alert. If you don't have these permissions, the `Edit` button will be disabled.

## Managing Alerts Using Kubernetes ConfigMaps
For organizations that prefer Infrastructure as Code (IaC) practices, Metoro supports creating and managing alerts using Kubernetes ConfigMaps.
### ConfigMap Requirements
1. ConfigMaps must include the label `metoro.io/alert: "true"` to be recognized by Metoro as an alert definition.
* ConfigMaps without this label will be ignored by Metoro.
2. The ConfigMap data must include a key named `alert.yaml` with `alerts` and the toplevel key containing the alert definition(s).
3. The alert definition must follow the format specified in the [API documentation](https://metoro.io/docs/api-reference/alerts/createupdate-alert#body-alert-metadata).
### Alert Synchronization
* Alerts defined in ConfigMaps are automatically synced with Metoro **once every hour**.
* Alerts managed via ConfigMaps cannot be edited through the UI to prevent conflicts.
* Any changes made via the API would be overwritten during the next sync cycle.
* If you delete a ConfigMap, the corresponding alert will *not* be deleted in Metoro. This is to prevent cluster outages deleting alerts etc. After removing the configmap you should subsequently delete the alert in the UI. Subsequent syncs will not recreate the alert.
### Manual Synchronization
If you don't want to wait for the hourly sync, you can:
* Use the "Sync Alerts" button on the Alerts page in the Metoro UI
* Call the endpoint `GET "/api/v1/alerts/sync"` with your auth token. For more information, please check the [API documentation](https://metoro.io/docs/api-reference/alerts/sync-alerts-from-configmaps).

### Example ConfigMap
Please check the API documentation for the full alert definition format. Below is a simple example of a ConfigMap that defines an alert:
You have to provide an unique id for the alert to ensure that the alert can be referenced in the future.
```yaml
kind: ConfigMap
apiVersion: v1
metadata:
name: alert-config
labels:
metoro.io/alert: "true"
data:
alert.yaml: |
alerts:
- metadata:
id: "trace-count-alert-001"
name: "Trace Count Upper Bound"
description: "Alert when there are too many traces"
type: timeseries
timeseries:
expression:
metoroQLTimeseries:
query: "count(traces)"
bucketSize: 60
evaluationRules:
- name: critical
type: static
static:
operators:
- operator: greaterThan
threshold: 15
persistenceSettings:
datapointsToAlarm: 3
datapointsInEvaluationWindow: 5
missingDatapointBehavior: notBreaching
```
For more examples, please check the [Example Alerts](https://metoro.io/docs/alerts-monitoring/example_alerts) section.
### Troubleshooting ConfigMap Alert Synchronization
If you don't see your alerts being created or updated from ConfigMaps, the issue is most likely due to one of the following reasons:
1. **Ingestion Delay**: Allow at least one full minute for your new ConfigMap definition to be ingested by Metoro. After this period, try to sync alerts manually either via the UI or the API.
2. **Missing or Incorrect Labels**: Double-check that your ConfigMap has the necessary label `metoro.io/alert: "true"` as described in the [ConfigMap Requirements](#configmap-requirements) section.
**Invalid Alert Definition**: If your alert is still not appearing, the most likely cause is an invalid alert definition format. In this case, Metoro will log an error in your account. You can find these error logs by filtering for:
* Environment: `metoro-internal`
* Service name: `configmap-to-alert`
These logs will contain the specific reason why your alert definition could not be processed.

# Alert Examples
Source: https://metoro.io/docs/alerts-monitoring/example_alerts
List of example alerts
Here are some example alerts you can set up in Metoro to monitor your Kubernetes infrastructure and applications. These examples cover various scenarios, including CPU usage, error rates, and latency.
If you are using Kubernetes ConfigMaps to manage your alerts, you can define these alerts in a ConfigMap and apply it to your cluster. Make sure to include the label `metoro.io/alert: "true"` in your ConfigMap.
## Complete Example ConfigMap
You can use the following ConfigMap to set up all example alerts at once:
```yaml
kind: ConfigMap
apiVersion: v1
metadata:
name: alert-config
labels:
metoro.io/alert: "true"
data:
alert.yaml: |
alerts:
- metadata:
id: "cpu-usage-alert-001"
name: "High CPU Usage"
description: "Alert when CPU usage exceeds 80% for 5 minutes"
type: timeseries
timeseries:
expression:
metoroQLTimeseries:
query: sum(container_resources_cpu_usage_seconds_total{service_name="/k8s/default/myimportantservice"}) / 60 / sum(container_resources_cpu_limit_cores{service_name="/k8s/default/myimportantservice"})
bucketSize: 60
evaluationRules:
- name: "warning"
type: static
static:
operators:
- operator: greaterThan
threshold: 80
persistenceSettings:
datapointsToAlarm: 5
datapointsInEvaluationWindow: 5
missingDatapointBehavior: notBreaching
- metadata:
id: "error-log-alert-001"
name: "High Error Rate"
description: "Alert when error logs exceed 100 in 15 minutes"
type: timeseries
timeseries:
expression:
metoroQLTimeseries:
query: count(logs{log_level="error"})
bucketSize: 60
evaluationRules:
- name: "critical"
type: static
static:
operators:
- operator: greaterThan
threshold: 100
persistenceSettings:
datapointsToAlarm: 15
datapointsInEvaluationWindow: 15
missingDatapointBehavior: notBreaching
- metadata:
id: "high-latency-alert-001"
name: "High Latency"
description: "Alert when HTTP request duration exceeds 2 seconds for 5 minutes"
type: timeseries
timeseries:
expression:
metoroQLTimeseries:
query: trace_duration_quantile(0.99, traces)
bucketSize: 60
evaluationRules:
- name: "warning"
type: static
static:
operators:
- operator: greaterThan
threshold: 2
persistenceSettings:
datapointsToAlarm: 5
datapointsInEvaluationWindow: 5
missingDatapointBehavior: notBreaching
- metadata:
id: "latency-with-notifications-001"
name: "High Latency with Notifications"
description: "Alert when HTTP request duration exceeds 2 seconds for 5 minutes with notifications"
type: timeseries
timeseries:
expression:
metoroQLTimeseries:
query: trace_duration_quantile(0.99, traces)
bucketSize: 60
evaluationRules:
- name: "Warning"
type: static
static:
operators:
- operator: greaterThan
threshold: 2
persistenceSettings:
datapointsToAlarm: 5
datapointsInEvaluationWindow: 5
missingDatapointBehavior: notBreaching
actions:
- type: slack
slackDestination:
channel: "alerts-critical"
additionalMessage: "Service availability has dropped below SLA threshold!"
- type: email
emailDestination:
emails:
- "oncall@example.com"
- "sre-team@example.com"
```
# Create/Update Alert
Source: https://metoro.io/docs/api-reference/alerts/createupdate-alert
api-reference/openapi.yaml post /alerts/update
Create a new alert based on the provided configuration or update an existing one if the alert.metadata.id matches an existing alert.
# Sync Alerts From ConfigMaps
Source: https://metoro.io/docs/api-reference/alerts/sync-alerts-from-configmaps
api-reference/openapi.yaml get /alerts/sync
Trigger immediate synchronization of alerts from Kubernetes ConfigMaps. By default, alerts are synced from ConfigMaps once every hour. This endpoint allows triggering the sync process manually without waiting for the scheduled sync.
# Product Updates
Source: https://metoro.io/docs/changelog/overview
New updates and improvements
## Enhanced Search & Filtering
Power up your observability with advanced regex search capabilities:
* Regex search support across all resource types:
* Logs: Search through log messages and attributes
* Traces: Filter spans by attributes and service names
* Metrics: Search metric names and label values
* Kubernetes: Find resources using regex patterns
## New Visualization Features
* **Area Charts**: Visualize data trends with beautiful area graphs
* **Histogram Support**: Better understand data distribution with histogram metrics
* Native support for histogram metric types
* Visualize distribution of values over time
* Perfect for latency and request duration analysis
## Role-Based Access Control (RBAC)
Granular access control for your organization:
* Fine-grained permissions for different resource types
* Built-in admin and user roles
* Custom role creation with specific permissions
* Resource-level access management
* [Learn more about RBAC](/user-management/overview)
## Uptime Monitoring & Status Pages
Introducing comprehensive uptime monitoring and status page capabilities:
* Monitor endpoint availability and performance:
* Custom check intervals
* Create status pages:
* Historical uptime metrics
* Public and private pages
* Detailed performance metrics:
* Response times
* Availability percentages
* Historical data
* [Learn more about Uptime Monitoring](/uptime-monitoring/overview)
## Advanced Log Analytics & Metrics
Transform your logs into powerful metrics with our new log analytics features:
* Convert any log into metrics with support for JSON value filters and regex matching
* Chart log-based metrics directly in your dashboards
* Create sophisticated alerts combining multiple log patterns and conditions
## Enhanced Plotting and Alerting Capabilities
Take your alerting to the next level with multi-metric alerts and complex formulas:
* Combine multiple metrics for more meaningful alerts
* Create alerts based on metric ratios (e.g., error rate = 5XX / total traces \* 100)
* Use advanced formulas with support for:
* Arithmetic: `+`, `-`, `*`, `/`, `%`, `^`, `**`
* Comparison: `==`, `!=`, `<`, `>`, `<=`, `>=`
* Logical: `not`, `!`, `and`, `&&`, `or`, `||`
* Conditional: `?:` ternary operator
* Import and export alerts in JSON format
## New Visualization Options
* **Stat/Table Widget**: Display single values or tables instead of time series
## Event Ingestion API
* New hosted ingestion endpoint for custom events
* Secure token-based authentication
* Automatic conversion of events to queryable logs
* [Learn more about event ingestion](/integrations/event-ingestion)
## Issues and Workflows
Introducing automated issue detection and workflow management:
* Intelligent detection of common Kubernetes issues:
* OOM (Out of Memory) events
* CPU throttling incidents
* Resource right-sizing recommendations
* Customizable workflows for issue resolution
* Automated tracking and management of detected issues
* Integration with existing alert channels
* [Learn more about Issue Detection](/issue-detection/overview)
## Dashboard Improvements
* Predefined dashboard templates for common use cases:
* CPU Node Overview
* HTTP Server Metrics
* Network Overview
* Node Overview
* Service Memory Overview
* Alpha support for Grafana dashboard imports
* Enhanced dashboard management:
* Easy template selection
* JSON import/export
* Improved dashboard cloning
## Smarter Alerting, Better Control
Take charge of your alerts like never before! Our revamped alerting system puts you in the driver's seat with more flexibility and precise control.
* Powerful attribute-based alerts that catch exactly what you need
* Fine-tune your thresholds with intuitive controls
* Silence notifications your way with smart muting rules
## Lightning-Fast Metrics Engine
We've turbocharged our metrics pipeline! Get ready for blazing-fast queries and deeper insights into your system's performance.
* Seamless OpenTelemetry integration with remote write support
* Create richer visualizations with multiple metrics per chart
* Lightning-quick queries - now 4x faster than before!
## Dashboard Magic
Your dashboards just got a whole lot smarter! We've packed in powerful features to make your monitoring experience more intuitive and flexible than ever.
* Build sophisticated views with hierarchical variables
* Clone and customize dashboards in seconds
* Set perfect time windows for your metrics
## Infrastructure View Reimagined
Say hello to Infrastructure View 2.0! We've completely rebuilt how you visualize and understand your infrastructure, making it easier than ever to spot trends and troubleshoot issues.
* Track resource utilization with pixel-perfect accuracy
* Understand traffic patterns across availability zones
* Monitor pods and nodes with unprecedented detail
## Smoother, Faster, Better
We've polished every corner of the platform to make your daily monitoring tasks a breeze:
* Share insights instantly with persistent URLs
* Customize your date displays your way
* Navigate namespaces with powerful new controls
## Enhanced Metric Exploration
We've completely revamped how you interact with metrics! The new metric explorer makes it easier than ever to find and analyze the data that matters to you. With dedicated tabs for exploration and catalog browsing, you'll spend less time searching and more time gaining insights.
* Search and filter metrics with lightning speed
* Track request and response sizes with new visualization options
* Full OpenTelemetry metrics support for seamless integration
## Smarter Kubernetes Monitoring
Your Kubernetes clusters just got a lot more observable! We've added detailed event tracking and improved availability zone support to give you a complete picture of your infrastructure health.
* Better visibility into cross-zone traffic patterns
* Rich event context for faster debugging
* Improved environment-aware monitoring
## Service Maps & Infrastructure Insights
Say goodbye to service blindspots! Our new service graph visualization gives you an interactive map of your entire system, making it easy to understand service relationships and dependencies.
* Visual service dependency mapping
* Multi-environment support for complex deployments
* Enhanced pod lifecycle visibility
## Lightning Fast Performance
We've supercharged our backend to handle your observability data faster than ever:
* 4x faster trace queries
* Optimized alert monitoring with reduced latency
* Streamlined Kubernetes data processing
## Proactive Monitoring Suite
Never miss a critical issue again! Our new alerting system watches your traces and metrics to catch problems before they impact your users.
* Set up trace-based alerts for end-to-end monitoring
* Configure metric thresholds with intuitive controls
* Fine-tune alert evaluation periods for your needs
## Smoother User Experience
We've polished the UI to make your daily monitoring tasks more enjoyable:
* Interactive chart legends with smart filtering
* Responsive filters that work as fast as you do
* Enhanced service context in visualizations
## Powerful Filtering & Analysis
Finding the right logs and traces is now easier than ever with our enhanced filtering capabilities:
* Multiple regex support for precise filtering
* Clickable tags for quick context switching
* Smart log ingestion controls
## Enhanced Infrastructure Views
Get deeper insights into your Kubernetes infrastructure with our improved container and pod monitoring:
* Detailed container state tracking
* Rich pod lifecycle visualization
* At-a-glance service health indicators
## Seamless Team Collaboration
Managing your observability team just got easier with our enhanced user management system:
* Quick team invites with secure links
* Streamlined authentication flow
* Flexible user access controls
## Deep Kubernetes Integration
We've expanded our Kubernetes support to give you more visibility than ever:
* Support for all major resource types
* Rich metadata for better context
* One-click navigation to pod details
## Welcome to Metoro! 🎉
We're excited to launch our observability platform, designed to make monitoring your systems a breeze. Our initial release includes everything you need to get started:
* Comprehensive logging and tracing
* Intuitive service catalog
* Essential metrics visualization
* Core Kubernetes integration
* Secure authentication system
We can't wait to see how you'll use Metoro to gain insights into your systems!
# Services
Source: https://metoro.io/docs/concepts/overview
Learn about the core abstraction in Metoro
Metoro generally defined things in terms of Kubernetes constructs.
If you are familiar with Kubernetes, you should be able to understand the majority of what Metoro is showing you.
The one exception to that is the concept of services.
## Services
Services are the core abstraction in Metoro.
They are the entities that represent the persistent components of your microservice application and are the main way you will interact with the data in Metoro.
Services are automatically detected by Metoro and do not require any configuration from you.
### How does Metoro detect a service?
Metoro makes a service out of each of the following Kubernetes resources:
* Deployments
* StatefulSets
* DaemonSets
* ReplicaSets
For example if we have the following architecture in our Kubernetes cluster:
```mermaid
%%{init: {
'theme': 'dark',
'themeVariables': {
'fontFamily': 'Inter',
'primaryColor': '#151F32',
'primaryTextColor': '#EBF1F7',
'primaryBorderColor': '#3793FF',
'lineColor': '#334670',
'secondaryColor': '#151F32',
'tertiaryColor': '#151F32',
'mainBkg': '#151F32',
'nodeBorder': '#3793FF',
'clusterBkg': '#182338',
'titleColor': '#EBF1F7',
'edgeLabelBackground': '#151F32',
'clusterBorder': '#334670'
},
'maxZoom': 2,
'minZoom': 0.5,
'zoom': true
}}%%
graph LR
subgraph Currency Deployment
A[Pod A]
B[Pod B]
end
subgraph Checkout Deployment
C[Pod C]
D[Pod D]
end
```
Metoro will automatically detect 2 services:
* Currency
* Checkout
All of the data around the underlying pods, containers, and the Kubernetes resources themselves are associated with the service they belong to and will be tracked over time by Metoro.
Metoro extracts APM, traces, logs, metrics and profiling data from the pods and containers associated with the service and associates them with the service as well as tracking changes to the kubernetes metadata.
This allows you do do things like see if a new deployment caused a spike in errors or if a new pod is causing a memory leak.
### How do you interact with services?
#### Service Catalog
The best place to get started with services is at the service catalog page. [Check it out here](https://demo.us-east.metoro.io/service-catalog).
The service catalog page shows you all the services that Metoro has detected in your cluster and allows you to drill down into each service to see the data associated with it.

After you find the service you are interested in, you can click on it to see the auto-generated service page.
#### Service Page
The service page shows you in-depth information about the service including:
* APM data
* Kubernetes information like number of replicas, deployment history, etc
* Metrics
* Logs
* Profiling data
* Kubernetes events associated with the service
The default view is the APM tab. Here you can see autogenerated RED metrics, requests to the service and a service map of the communication between the service and other services in the cluster.
Check out an example [service page](https://demo.us-east.metoro.io/service?service=%2Fk8s%2Fmetoro%2Fmetoro-exporter\&tab=apm\&startEnd=\&podTab=metadata).

Clicking through to the kubernetes tab will show you an overview of service with regards to pods, scaling information and metrics.
You can see all pods associated with the service, drill into them or look at aggregated metrics.
Check out an example [kubernetes page](https://demo.us-east.metoro.io/service?service=%2Fk8s%2Fmetoro%2Fmetoro-exporter\&tab=k8s\&startEnd=\&podTab=metadata\&environment=).

[Logs](/logs) are a great way to see what's going on in your service. Check out an example [logs page](https://demo.us-east.metoro.io/service?service=%2Fk8s%2Fmetoro%2Fmetoro-exporter\&tab=logs\&startEnd=\&excludeFilter=%7B%7D\&filter=%7B%22service.name%22%3A%5B%22%2Fk8s%2Fmetoro%2Fmetoro-exporter%22%5D%7D).

[Events](/kubernetes-resources/kubernetes-events) show all of the kubernetes events which have been emitted which target a resource associated with the service. For example when a pod is being created you will see the event in the events tab. It's a good way to see if any cluster level issues are happening with a service like failed scheduling or pod restarts.
Check out an example [here](https://demo.us-east.metoro.io/service?service=%2Fk8s%2Fmetoro%2Fmetoro-exporter\&tab=events\&startEnd=\&podTab=metrics\&environment=\&last=6h)
Finally the [profiling](/profiling) tab will show you any profiling data collected from the pod and containers associated with the service and aggregate it to show you how much time is being spent in each function across all pods.
Check out an example [profiling page](https://demo.us-east.metoro.io/service?service=%2Fk8s%2Fmetoro%2Fmetoro-exporter\&tab=profiling\&startEnd=\&podTab=metadata\&environment=).
This allows you to see if there are any performance bottlenecks in your service.

# Creating and Editing Dashboards
Source: https://metoro.io/docs/dashboards/creating-editing
## Creating a Dashboard
To create a new dashboard, click on the **Create Dashboard** button on the top right corner of the dashboards view.
## Editing a Dashboard
To edit a dashboard, click on the **Edit** button on the dashboard card.
You can add new charts and groups by clicking the **Add widget** button on the dashboard view.
When creating a new chart, you'll run through the chart creation wizard where you can search for metrics, select aggregations and filters, and customize the chart appearance.
## Using Predefined Dashboard Templates
Metoro provides a set of predefined dashboard templates to help you get started quickly. These templates are designed to cover common monitoring scenarios and can be easily customized to fit your needs.
### Available Templates
* **CPU Node Overview**: Provides detailed insights into CPU usage and performance metrics across your nodes
* **HTTP Server Metrics**: Monitors HTTP server performance, including request rates, latencies, and error rates
* **Network Overview**: Visualizes network traffic, bandwidth usage, and connectivity metrics
* **Node Overview**: Comprehensive view of node health and performance metrics
* **Service Memory Overview**: Tracks memory usage and allocation patterns across your services
### Using Templates
1. Click on the **Create Dashboard** button
2. Select "Use Template" from the creation dialog
3. Choose your desired template from the available options
4. The template will be imported with pre-configured widgets and variables
5. Customize the dashboard as needed for your specific use case
### Importing and Exporting Dashboards
You can also import existing dashboard configurations or export your dashboards as JSON:
* To import: Use the dashboard settings to import a JSON configuration
* To export: Access the dashboard settings and select the export option to download the dashboard configuration as JSON
This feature is particularly useful for sharing dashboard configurations across teams or backing up your dashboard setups.

# Dashboards Overview
Source: https://metoro.io/docs/dashboards/overview
Diagnostic information is often useful in a particular context.
Dashboards are a great way of saving these metrics and grouping them together for easy access when needed.
For example you might want to create a dashboard to show the health of some particularly important services.
In this dashboard you can include charts on metoro-collected data like traces, APM data, log information and container metrics. Then show that side by side with custom metrics emitted from your services.
## Dashboards View
The [dashboards](https://demo.us-east.metoro.io/dashboards) view in Metoro shows all the dashboards that have been created in your organization.
Each dashboard has a unique url that you can share with others, for example, this [test dashboard](https://demo.us-east.metoro.io/dashboard?dashboardId=85301588-eb27-4b68-be36-efa2049a6cf3\&environment=\&startEnd=\&service=).
# Dashboard Variables
Source: https://metoro.io/docs/dashboards/variables
Variables allow you to dynamically apply filters to charts. The values of variables can be constant or can be edited by users when they are looking at a dashboard.
When a user edits the value of a variable in the dashboard, it will not be saved. It will only be applied to the current session.
This allows you to build generic dashboards, for example: a postgres dashboard showing performance metrics for different a particular database. Then users can select the database they're interested in.
## Variable Components
A variables is made up of these components:
* Name - The name of the variable which will be referenced when applying the filter.
* Possible Values - Suggested values for the variable. This is all the values of a particular tag for traces or metrics.
* Default Value - The default value of the variable. This is the value that will be applied when the variable is not edited by the user.
If the value is `*` then it is for all values of the key.
* Overrideable - Whether a user can edit the value of the variable inside the dashboard for their session.
An example variable definition is below:

This variable has a name of `serviceName` and a default value of `*` which means all service names. The possible values are the unique values of the serviceName tag for traces.
## Creating Variables
You can create a variable by clicking the variable icon on any group widget in edit mode.

After a variable is created, you will see it in the header of the group widget.

## Using Variables
After you have created a variable you can use it in the filters of any chart that is nested below that group.
In the chart editor you can set any filter equal to the variable value.

After using a variable in the chart. Change the value of the variable by clicking the variable in the widget and selecting (or typing) the new value.
# Dashboard Widgets
Source: https://metoro.io/docs/dashboards/widgets
A dashboard is composed of widgets arranged on a canvas. There are three types of widgets available:
## Group Widget
The group widget is used to group related widgets together. It is useful for organizing charts and other widgets.
Widgets that are grouped can be moved together as a single entity.
## Chart Widget
The chart widget is used to display any sort of data.
After you add a chart widget you can configure it through the Chart Builder.

A chart is comprised of 7 key elements:
1. The metric type. This is the underlying data that will be queried. It is either [metric](/metrics/overview) or [trace](/traces/overview)
2. The chart type. This defines the visualisation. Either a bar or line chart.
3. The metric name. This is the name of the metric that will be displayed. This is only relevant for metric charts.
4. Filters. Filters consist of a number of key value pairs. This will restrict the queried data to only data points matching the filters. Each filter is ANDed with every other filter. Individual filters can be ORed together by inserting `||` between each value.
5. Aggregation. This is the operation to apply to the data. For example, if you want to sum the data you would select `sum`. The available aggregations for metrics are:
* `sum`
* `avg`
* `min`
* `max`
The available aggregations for traces are:
* `count`
* `request size`
* `response size`
* `total size`
* `p50 latency`
* `p90 latency`
* `p95 latency`
* `p99 latency`
6. Groups. This is a list of keys that will be used to group the data.
7. Functions. Functions are mathematical operations that can be applied to the data. For example, if you want to calculate the monotonic difference of the data you would select `monotonic_diff`. The available functions are:
* `monotonic_diff` - The difference between the current value and the previous value in the timeseries. If the difference is negative, it will be clamped at 0.
* `value_diff` - The difference between the current value and the previous value in the timeseries.
* `custom_math_expression` - An arbitrary math expression applied to the time series. The timeseries is passed as the parameter `a` to the expression. For example, if you want to divide the data by 2 you would select `a / 2`.
## Markdown Widget
The markdown widget is used to display arbitrary markdown. For example if you have a dashboard corresponding to a run book for a particular type of incident you can use the markdown widget to display the run book and keep it up to date with the actual dashboard.
The markdown widget supports any markdown that is compatible with the [CommonMark](https://commonmark.org/) format. A cheat sheet can be found [here](https://commonmark.org/help)
# Metoro Architecture
Source: https://metoro.io/docs/getting-started/architecture
Metoro has two main components: the in-cluster agents and the observability backend.
At a very high level, the flow of data in Metoro is as follows:
1. The node agents are responsible for collecting data from the linux kernel of all nodes in the Kubernetes cluster and writing to cluster local storage.
2. The cluster exporter then reads the data from the local storage aggregating across all nodes and sends it to the Metoro backend ingesters along with the Kubernetes metadata (pods, deployments, configmaps, etc).
3. The ingesters write all observability data to the long-term backend storage: currently clickhouse.
4. The api server reads data from the backend storage and serves it to the frontend and any api clients.
The following diagram shows the high level architecture of Metoro:
```mermaid
%%{init: {
'theme': 'dark',
'themeVariables': {
'fontFamily': 'Inter',
'primaryColor': '#151F32',
'primaryTextColor': '#EBF1F7',
'primaryBorderColor': '#3793FF',
'lineColor': '#334670',
'secondaryColor': '#151F32',
'tertiaryColor': '#151F32',
'mainBkg': '#151F32',
'nodeBorder': '#3793FF',
'clusterBkg': '#182338',
'titleColor': '#EBF1F7',
'edgeLabelBackground': '#151F32',
'clusterBorder': '#334670'
},
'maxZoom': 2,
'minZoom': 0.5,
'zoom': true
}}%%
flowchart LR
%% ---- Clients (outside both subgraphs) ----
A[Clients]
%% ---- "Metro - Cloud or On-Prem" subgraph ----
subgraph "Metro - Cloud or On-Prem"
B["Metro API Server"]
C["Observability Data Storage - ClickHouse"]
D["Metadata / Workflow Storage - Postgres"]
E["Temporal Workers - Alerts / Job Running"]
F["Ingesters"]
B --> C
B --> D
B --> E
F --> C
end
%% Connect Clients to Metro API Server (outside subgraph so Clients remain outside)
A --> B
%% ---- "Kubernetes Cluster" subgraph ----
subgraph "Kubernetes Cluster"
subgraph "Kubernetes Nodes"
subgraph "Linux Kernel"
Z["System Calls"]
Z1["eBPF Programs"]
end
G["Microservice Container"]
H["Microservice Container"]
I["Microservice Container"]
J["Metoro Node Agent"]
%% Microservices talk to the Linux Kernel
G --> Z
H --> Z
I --> Z
%% Metoro Agent reads from the Kernel
Z --> Z1
Z1 --> J
end
K["Metoro Exporter"]
L["Kubernetes API Server"]
M["Redis (temporary metadata storage)"]
%% Metoro Agent passes data to the Metoro Exporter
J --> K
K --> F
L --> K
K --> M
J --> M
end
style A fill:#182338,stroke:#3793FF,color:#EBF1F7
style B fill:#182338,stroke:#3793FF,color:#EBF1F7
style C fill:#182338,stroke:#3793FF,color:#EBF1F7
style D fill:#182338,stroke:#3793FF,color:#EBF1F7
style E fill:#182338,stroke:#3793FF,color:#EBF1F7
style F fill:#182338,stroke:#3793FF,color:#EBF1F7
style G fill:#182338,stroke:#3793FF,color:#EBF1F7
style H fill:#182338,stroke:#3793FF,color:#EBF1F7
style I fill:#182338,stroke:#3793FF,color:#EBF1F7
style J fill:#182338,stroke:#3793FF,color:#EBF1F7
style K fill:#182338,stroke:#3793FF,color:#EBF1F7
style L fill:#182338,stroke:#3793FF,color:#EBF1F7
style M fill:#182338,stroke:#3793FF,color:#EBF1F7
style Z fill:#182338,stroke:#3793FF,color:#EBF1F7
```
# Getting Started
Source: https://metoro.io/docs/getting-started/getting-started
Get started with Metoro in under 5 minutes
Metoro offers two ways to set up and use the platform:
1. **Managed Cloud**: Let us handle everything for you. We host and maintain the platform. You just need to install the Metoro Agent on your cluster.
2. **On-Prem**: Host and manage Metoro entirely within your infrastructure for full control over your data and setup.
## Compatibility
Metoro can run on any Kubernetes cluster, whether it is on-premises, in the cloud, or managed by a cloud provider.
Metoro explicitly supports the following Kubernetes distributions for production use:
* AWS Elastic Kubernetes Service (EKS)
* Google Kubernetes Engine (GKE) without GKE autopilot
* Azure Kubernetes Service (AKS)
* Bare-metal on-prem Kubernetes installations
* OpenShift clusters
## Installation (Managed Cloud)
Metoro is designed to be super easy to get up and running with. We think that it should take \< 5 minutes to get end-to-end observability.
Start your timer and let's get started!
1. Head to the [Metoro Webapp](https://us-east.metoro.io/) and sign up with your email address.
2. After you log in, follow the on-screen instructions to install Metoro on your cluster.
You will be prompted to select a Kubernetes cluster for the Metoro Agent installation. You have two options:
* **Existing Cluster**: This option allows you to install Metoro on an existing Kubernetes cluster that is already running, whether in the cloud, on-premises, or elsewhere.
Select this option if you are setting up Metoro for an existing environment.
* **Local Dev Cluster**: This option sets up a local kubernetes cluster on your machine and installs Metoro into it. Choose this if you are starting a new project or simply trying out Metoro without installing it into an existing cluster.
3. Once you have selected your cluster, copy-paste the installation command into your terminal and hit enter. Make sure that your kubernetes context is set to the cluster you want to install Metoro into.
4. Once the installation is complete, you will see a success message in your terminal.
It can take a couple of minutes for Metoro to receive your cluster's data.
* If you are installing Metoro to a local dev cluster, this might take 5-10 minutes as it sets up the cluster.
* If you are installing Metoro to an existing cluster, this will take around a minute.
5. Once Metoro shows that it is receiving data, you can start exploring your cluster. You now have end-to-end telemetry. You should see the following screen:

## Installation (On-Prem)
Check out our [on-premises installation guide](/administration/on-premises) for more information.
# Introduction
Source: https://metoro.io/docs/getting-started/introduction
Welcome to Metoro - The Kubernetes Native Observability Platform
 Metoro is an observability platform specifically designed for Kubernetes. With a single helm chart installation, you get complete observability for your clusters.
Automatic zero instrumentation traces for all container requests with support for HTTP(s), Kafka, NATS,
RabbitMQ, Redis, and more powered by eBPF. Bring your own custom traces with OpenTelemetry.
Every log from every container stored in a single place. Automatic structured JSON log parsing with a billion
logs per second search. Bring your own custom logs with OpenTelemetry.
Detailed metrics collection and visualization for all pods, containers and hosts out of the box. Bring your own
custom metrics with OpenTelemetry.
Zero instrumentation ebpf powered on-cpu profiling for all containers. See cpu time down to the function level. Full support for C, C++, Python, Golang, Rust.
Every change to every resource, stored and indexed in a single place. A complete history of your cluster's state
with derived metrics.
Understand and visualize every dependency and network path. No instrumentation required.
Alert on anything in platform, including metrics, logs, traces, and Kubernetes resources.
Auto generated APM for every service. RED metrics, profiling, incoming and outgoing traces and much more.
Automated issue detection and cost optimization recommendations
All of this in a sub 5 minute install, we promise.
Head to the onboarding documentation to get started.
# System Requirements
Source: https://metoro.io/docs/getting-started/requirements
This page outlines the system requirements for running various Metoro components in your environment.
There are three main components which run in your Kubernetes cluster:
1. **The node agent** - Runs on each node in your Kubernetes cluster
2. **The exporter** - Runs multiple replicas depending on load, scales with horizontal pod autoscaler
3. **The redis cache** - One replica per cluster
Each component has specific resource requirements as detailed below. All requirements are approximate and assume a relatively up to date cpu. Testing is perfomed on AWS M5 instances running on a Skylake 8175M.
The node agents resource requirements scale with several factors, primarily:
* The number of requests being made to / from the node agent
* The number of logs being collected
At a minimum, each node agent requires:
* 0.05 cores
* 100Mi memory
For each additional:
* 1000 requests/second: +0.2 cores CPU, +0.2GB memory, +0.1MB/s network
* 1000 logs/second: +0.05 cores CPU, +0.1GB memory, +0.1MB/s network
### Resource Scaling Table
| Requests per second | Logs per second | CPU (cores) | Memory (GB) | Network (MB/s) |
| ------------------- | --------------- | ----------- | ----------- | -------------- |
| 1000 | 1000 | 0.25 | 0.3 | 0.2 |
| 2000 | 2000 | 0.5 | 0.6 | 0.4 |
| 3000 | 3000 | 0.75 | 0.9 | 0.6 |
| 4000 | 4000 | 1.0 | 1.2 | 0.8 |
| 5000 | 5000 | 1.25 | 1.5 | 1.0 |
These requirements are approximate and may vary based on:
* Number of containers being monitored
* Types of metrics being collected
* Frequency of metric collection
* Network conditions
* Size of individual log lines
The resources required mainly scale with the number of traces / logs being collected across all nodes.
For each additional:
* 1000 traces/second: +0.05 cores CPU, +0.1GB memory, +0.1MB/s network
* 1000 logs/second: +0.02 cores CPU, +0.1GB memory, +0.1MB/s network
### Resource Scaling Table
| Traces per second | Logs per second | CPU (cores) | Memory (GB) | Network (MB/s) |
| ----------------- | --------------- | ----------- | ----------- | -------------- |
| 1000 | 1000 | 0.07 | 0.2 | 0.2 |
| 2000 | 2000 | 0.14 | 0.4 | 0.4 |
| 3000 | 3000 | 0.21 | 0.6 | 0.6 |
| 4000 | 4000 | 0.28 | 0.8 | 0.8 |
| 5000 | 5000 | 0.35 | 1.0 | 1.0 |
These requirements are approximate and may vary based on:
* Number of containers being monitored
* Types of metrics being collected
* Frequency of metric collection
* Network conditions
* Size of individual log lines
Redis is used for temporary storage and caching of metrics data.
Redis has minimal resource requirements:
* 0.05 cores CPU
* 20Mi memory
***
### Example Cluster Configuration
For a cluster with:
* 100 nodes
* 1000 requests per second per node
* 1000 logs per second per node
The resources required are:
* **100 node agents**: 0.25 cores, 0.3GB memory, 0.2MB/s network per node
* **1 cluster exporter**: Processing 100k traces/second, 100k logs/second across all nodes
* Total: 7 cores, 20GB memory, 20MB/s network (split across N replicas)
* **1 redis cache**: 50m cores, 20Mi memory
**Total cluster resources required**
* 32 cores CPU
* 50GB memory
* 40MB/s network
## Default Resource Requests
The default resource requests for the node-agent are:
* 0.3 cores, 300Mi memory
The default resource requests for the exporter are:
* 1 core, 2GB memory
You should tune these requests to meet your specific needs.
# Infrastructure View
Source: https://metoro.io/docs/infrastructure/overview
Monitor and analyze your Kubernetes cluster nodes and their resources
## Overview
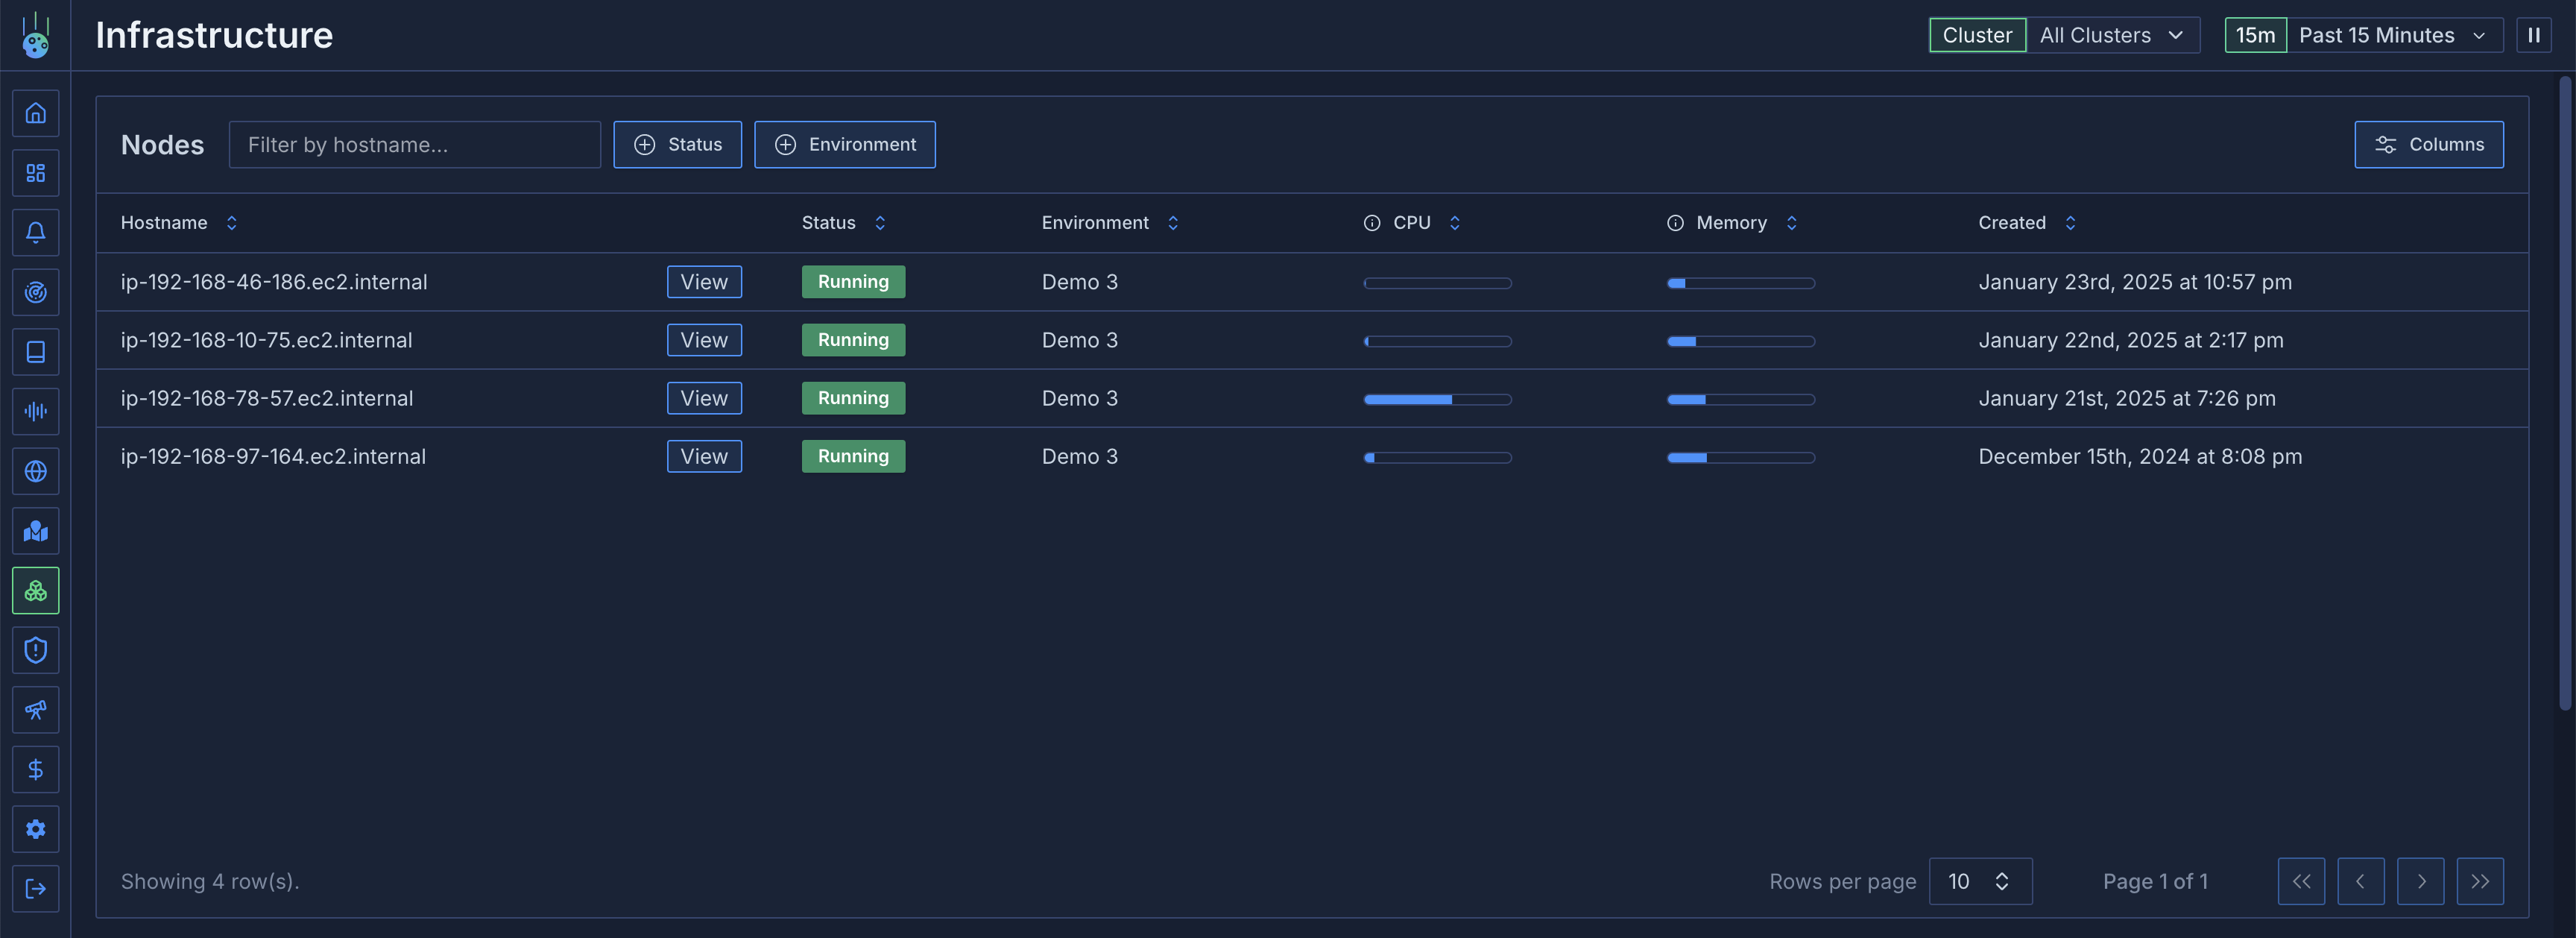
The Infrastructure view provides comprehensive monitoring and analysis of all nodes across your Kubernetes clusters. It offers detailed insights into node resources, pod distributions, and system metrics.
## Node Overview
### Node Table
The top section displays a table of all nodes with key information:
* Node names (searchable)
* CPU utilization over selected time period
* Memory usage trends
* Filterable by various attributes
Metoro is an observability platform specifically designed for Kubernetes. With a single helm chart installation, you get complete observability for your clusters.
Automatic zero instrumentation traces for all container requests with support for HTTP(s), Kafka, NATS,
RabbitMQ, Redis, and more powered by eBPF. Bring your own custom traces with OpenTelemetry.
Every log from every container stored in a single place. Automatic structured JSON log parsing with a billion
logs per second search. Bring your own custom logs with OpenTelemetry.
Detailed metrics collection and visualization for all pods, containers and hosts out of the box. Bring your own
custom metrics with OpenTelemetry.
Zero instrumentation ebpf powered on-cpu profiling for all containers. See cpu time down to the function level. Full support for C, C++, Python, Golang, Rust.
Every change to every resource, stored and indexed in a single place. A complete history of your cluster's state
with derived metrics.
Understand and visualize every dependency and network path. No instrumentation required.
Alert on anything in platform, including metrics, logs, traces, and Kubernetes resources.
Auto generated APM for every service. RED metrics, profiling, incoming and outgoing traces and much more.
Automated issue detection and cost optimization recommendations
All of this in a sub 5 minute install, we promise.
Head to the onboarding documentation to get started.
# System Requirements
Source: https://metoro.io/docs/getting-started/requirements
This page outlines the system requirements for running various Metoro components in your environment.
There are three main components which run in your Kubernetes cluster:
1. **The node agent** - Runs on each node in your Kubernetes cluster
2. **The exporter** - Runs multiple replicas depending on load, scales with horizontal pod autoscaler
3. **The redis cache** - One replica per cluster
Each component has specific resource requirements as detailed below. All requirements are approximate and assume a relatively up to date cpu. Testing is perfomed on AWS M5 instances running on a Skylake 8175M.
The node agents resource requirements scale with several factors, primarily:
* The number of requests being made to / from the node agent
* The number of logs being collected
At a minimum, each node agent requires:
* 0.05 cores
* 100Mi memory
For each additional:
* 1000 requests/second: +0.2 cores CPU, +0.2GB memory, +0.1MB/s network
* 1000 logs/second: +0.05 cores CPU, +0.1GB memory, +0.1MB/s network
### Resource Scaling Table
| Requests per second | Logs per second | CPU (cores) | Memory (GB) | Network (MB/s) |
| ------------------- | --------------- | ----------- | ----------- | -------------- |
| 1000 | 1000 | 0.25 | 0.3 | 0.2 |
| 2000 | 2000 | 0.5 | 0.6 | 0.4 |
| 3000 | 3000 | 0.75 | 0.9 | 0.6 |
| 4000 | 4000 | 1.0 | 1.2 | 0.8 |
| 5000 | 5000 | 1.25 | 1.5 | 1.0 |
These requirements are approximate and may vary based on:
* Number of containers being monitored
* Types of metrics being collected
* Frequency of metric collection
* Network conditions
* Size of individual log lines
The resources required mainly scale with the number of traces / logs being collected across all nodes.
For each additional:
* 1000 traces/second: +0.05 cores CPU, +0.1GB memory, +0.1MB/s network
* 1000 logs/second: +0.02 cores CPU, +0.1GB memory, +0.1MB/s network
### Resource Scaling Table
| Traces per second | Logs per second | CPU (cores) | Memory (GB) | Network (MB/s) |
| ----------------- | --------------- | ----------- | ----------- | -------------- |
| 1000 | 1000 | 0.07 | 0.2 | 0.2 |
| 2000 | 2000 | 0.14 | 0.4 | 0.4 |
| 3000 | 3000 | 0.21 | 0.6 | 0.6 |
| 4000 | 4000 | 0.28 | 0.8 | 0.8 |
| 5000 | 5000 | 0.35 | 1.0 | 1.0 |
These requirements are approximate and may vary based on:
* Number of containers being monitored
* Types of metrics being collected
* Frequency of metric collection
* Network conditions
* Size of individual log lines
Redis is used for temporary storage and caching of metrics data.
Redis has minimal resource requirements:
* 0.05 cores CPU
* 20Mi memory
***
### Example Cluster Configuration
For a cluster with:
* 100 nodes
* 1000 requests per second per node
* 1000 logs per second per node
The resources required are:
* **100 node agents**: 0.25 cores, 0.3GB memory, 0.2MB/s network per node
* **1 cluster exporter**: Processing 100k traces/second, 100k logs/second across all nodes
* Total: 7 cores, 20GB memory, 20MB/s network (split across N replicas)
* **1 redis cache**: 50m cores, 20Mi memory
**Total cluster resources required**
* 32 cores CPU
* 50GB memory
* 40MB/s network
## Default Resource Requests
The default resource requests for the node-agent are:
* 0.3 cores, 300Mi memory
The default resource requests for the exporter are:
* 1 core, 2GB memory
You should tune these requests to meet your specific needs.
# Infrastructure View
Source: https://metoro.io/docs/infrastructure/overview
Monitor and analyze your Kubernetes cluster nodes and their resources
## Overview
The Infrastructure view provides comprehensive monitoring and analysis of all nodes across your Kubernetes clusters. It offers detailed insights into node resources, pod distributions, and system metrics.
## Node Overview
### Node Table
The top section displays a table of all nodes with key information:
* Node names (searchable)
* CPU utilization over selected time period
* Memory usage trends
* Filterable by various attributes
 ## Node Details
Click on any node to access detailed information across several tabs.

### General Information
* Node capacity
* Available resources
* Kubernetes node metadata
* System information
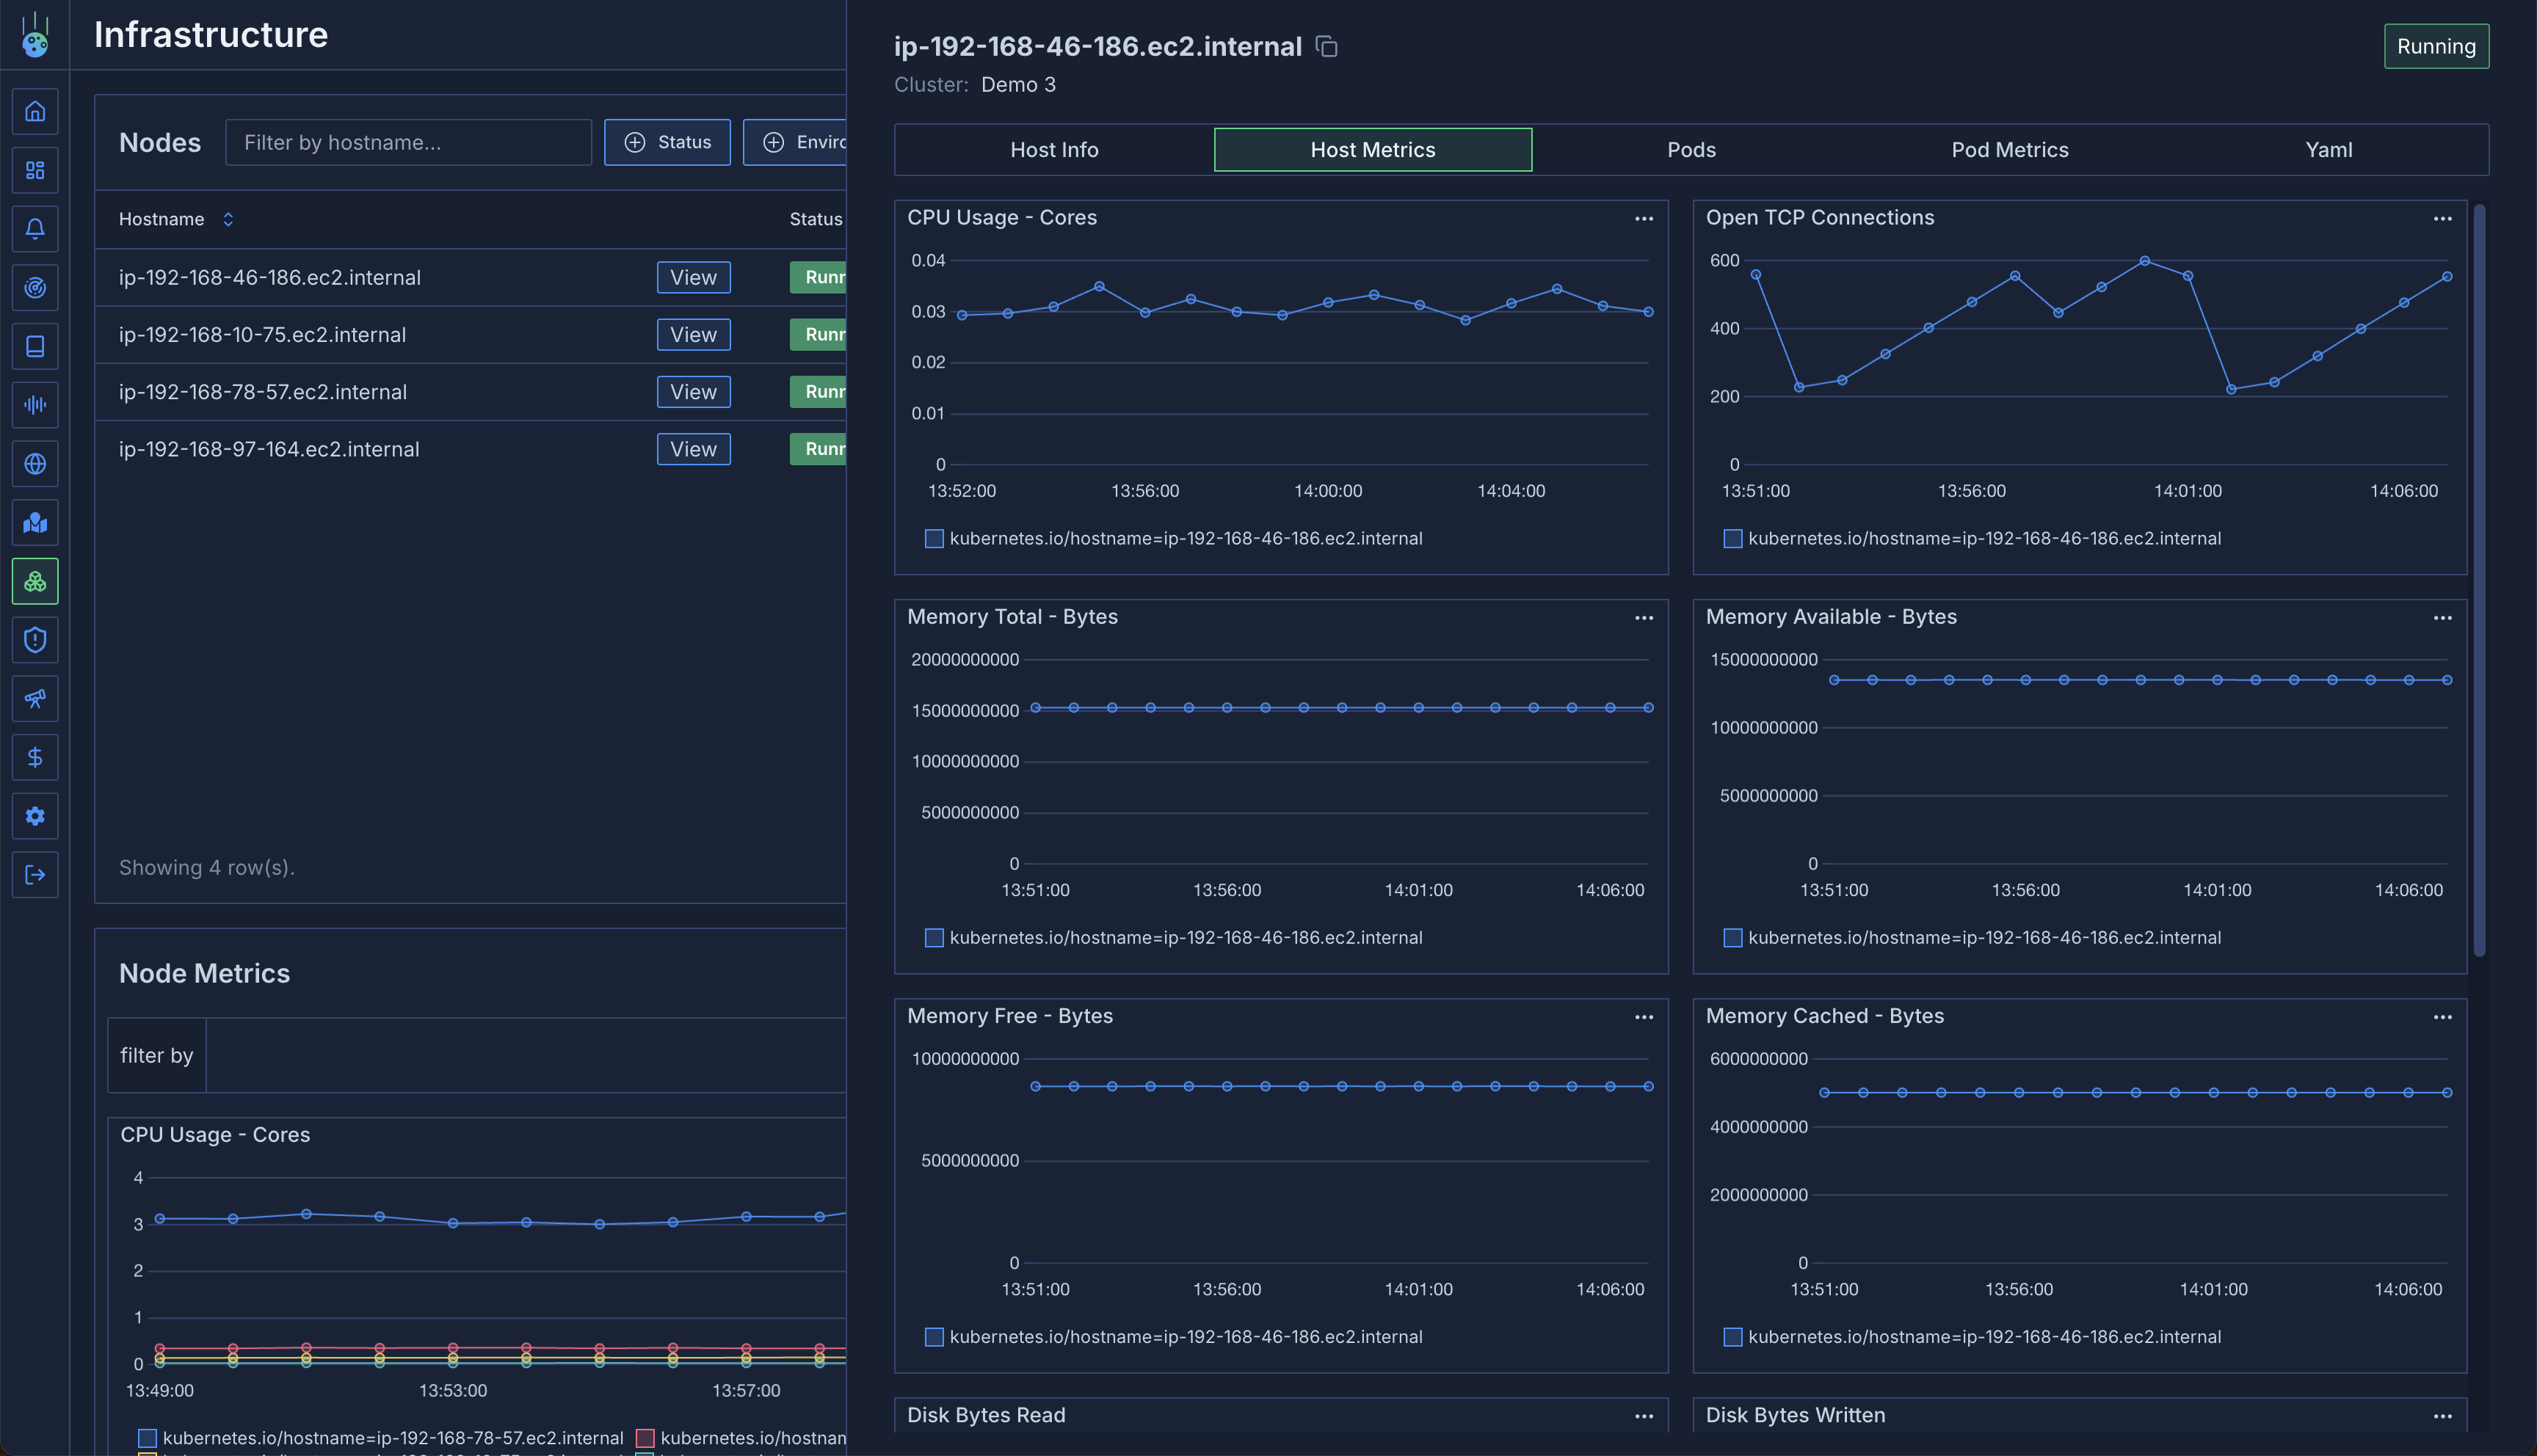
### Host Metrics
Monitor system-level metrics:
* CPU utilization
* Memory usage
* Disk usage
* Network throughput (transmitted/received bytes)
* Additional system metrics
## Node Details
Click on any node to access detailed information across several tabs.

### General Information
* Node capacity
* Available resources
* Kubernetes node metadata
* System information
### Host Metrics
Monitor system-level metrics:
* CPU utilization
* Memory usage
* Disk usage
* Network throughput (transmitted/received bytes)
* Additional system metrics
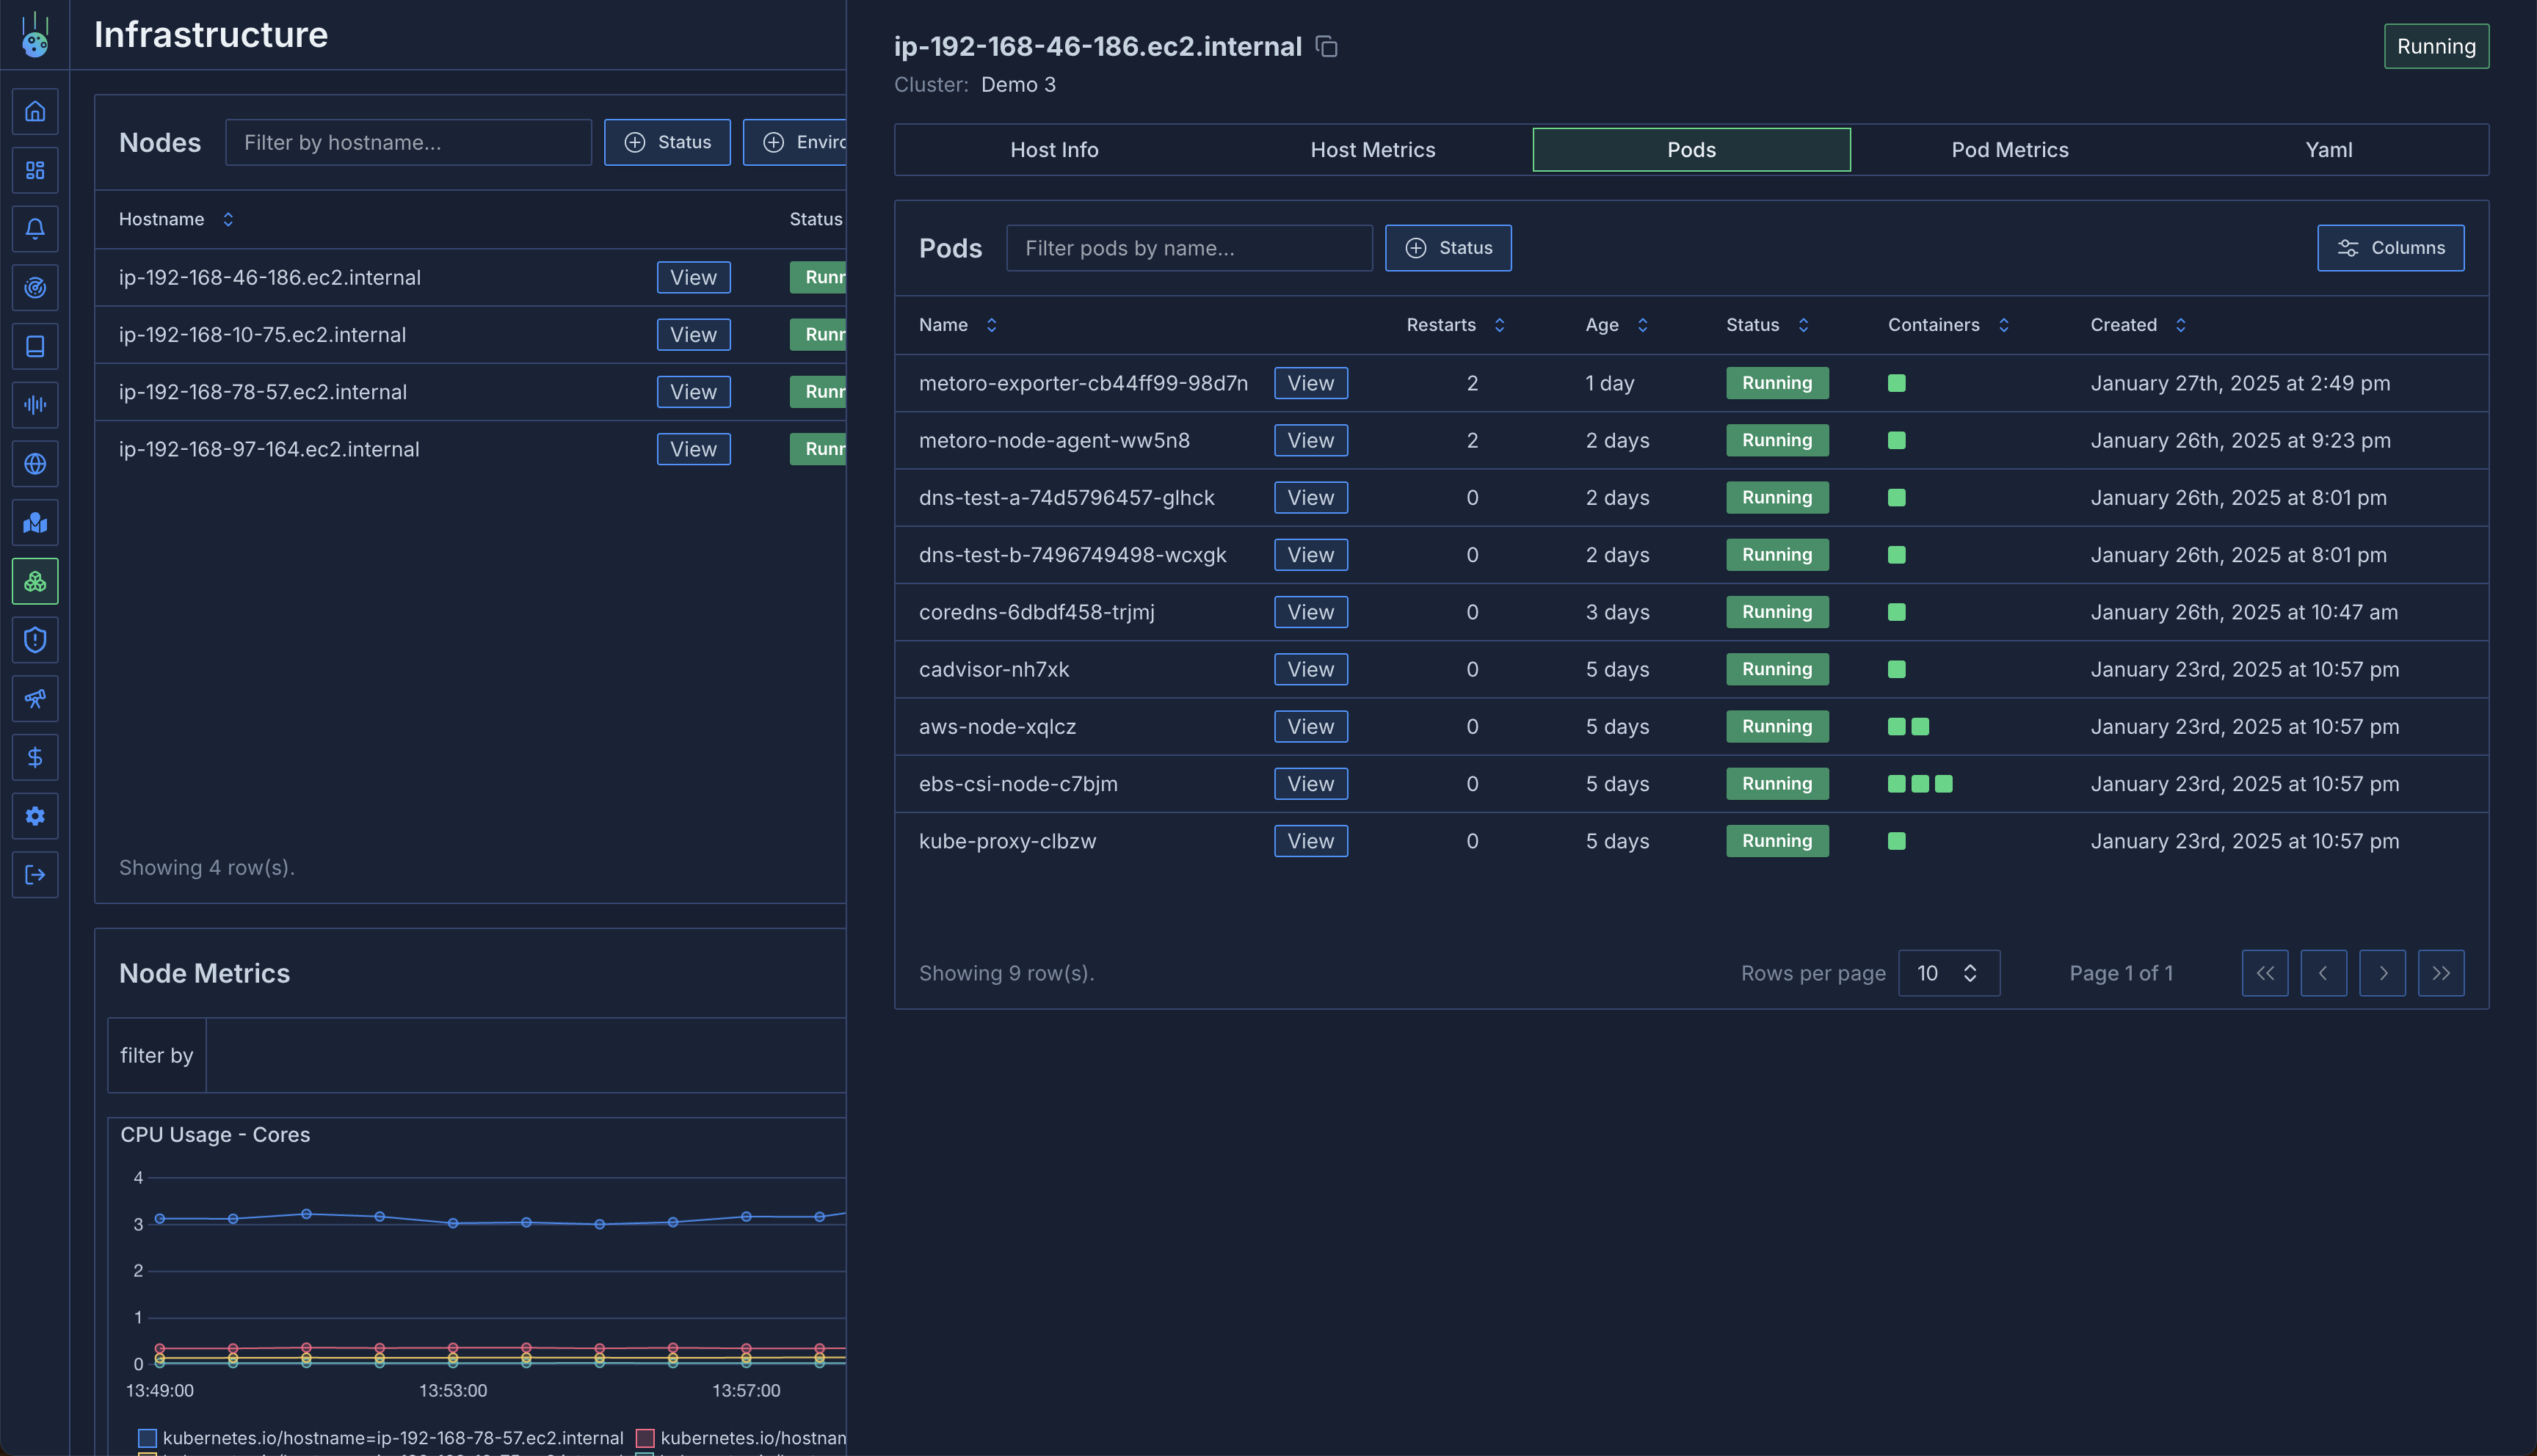
 ### Pods View
A detailed table of all pods running on the node:
* Restart frequency
* Uptime
* Pod status and conditions
* Resource usage
### Pods View
A detailed table of all pods running on the node:
* Restart frequency
* Uptime
* Pod status and conditions
* Resource usage
 ### Pod Metrics
Aggregate metrics for pods on the node:
* CPU usage per pod
* Memory consumption
* Resource distribution
* Performance analysis
This view is particularly useful for:
* Identifying resource-heavy pods
* Debugging CPU/memory issues
* Analyzing noisy neighbor situations
* Resource optimization
### Node YAML
Access the raw Kubernetes node resource YAML:
* Current node configuration
* Resource definitions
* Node labels and annotations
## Aggregated Metrics
The infrastructure view provides aggregated metrics across all nodes:
### Metric Grouping
* Group by any Kubernetes label
* Filter nodes based on labels
* Analyze patterns across node groups
For example, analyze:
* CPU usage by availability zone
* Memory patterns by instance type
* Resource distribution by region
### Pod Metrics
Aggregate metrics for pods on the node:
* CPU usage per pod
* Memory consumption
* Resource distribution
* Performance analysis
This view is particularly useful for:
* Identifying resource-heavy pods
* Debugging CPU/memory issues
* Analyzing noisy neighbor situations
* Resource optimization
### Node YAML
Access the raw Kubernetes node resource YAML:
* Current node configuration
* Resource definitions
* Node labels and annotations
## Aggregated Metrics
The infrastructure view provides aggregated metrics across all nodes:
### Metric Grouping
* Group by any Kubernetes label
* Filter nodes based on labels
* Analyze patterns across node groups
For example, analyze:
* CPU usage by availability zone
* Memory patterns by instance type
* Resource distribution by region
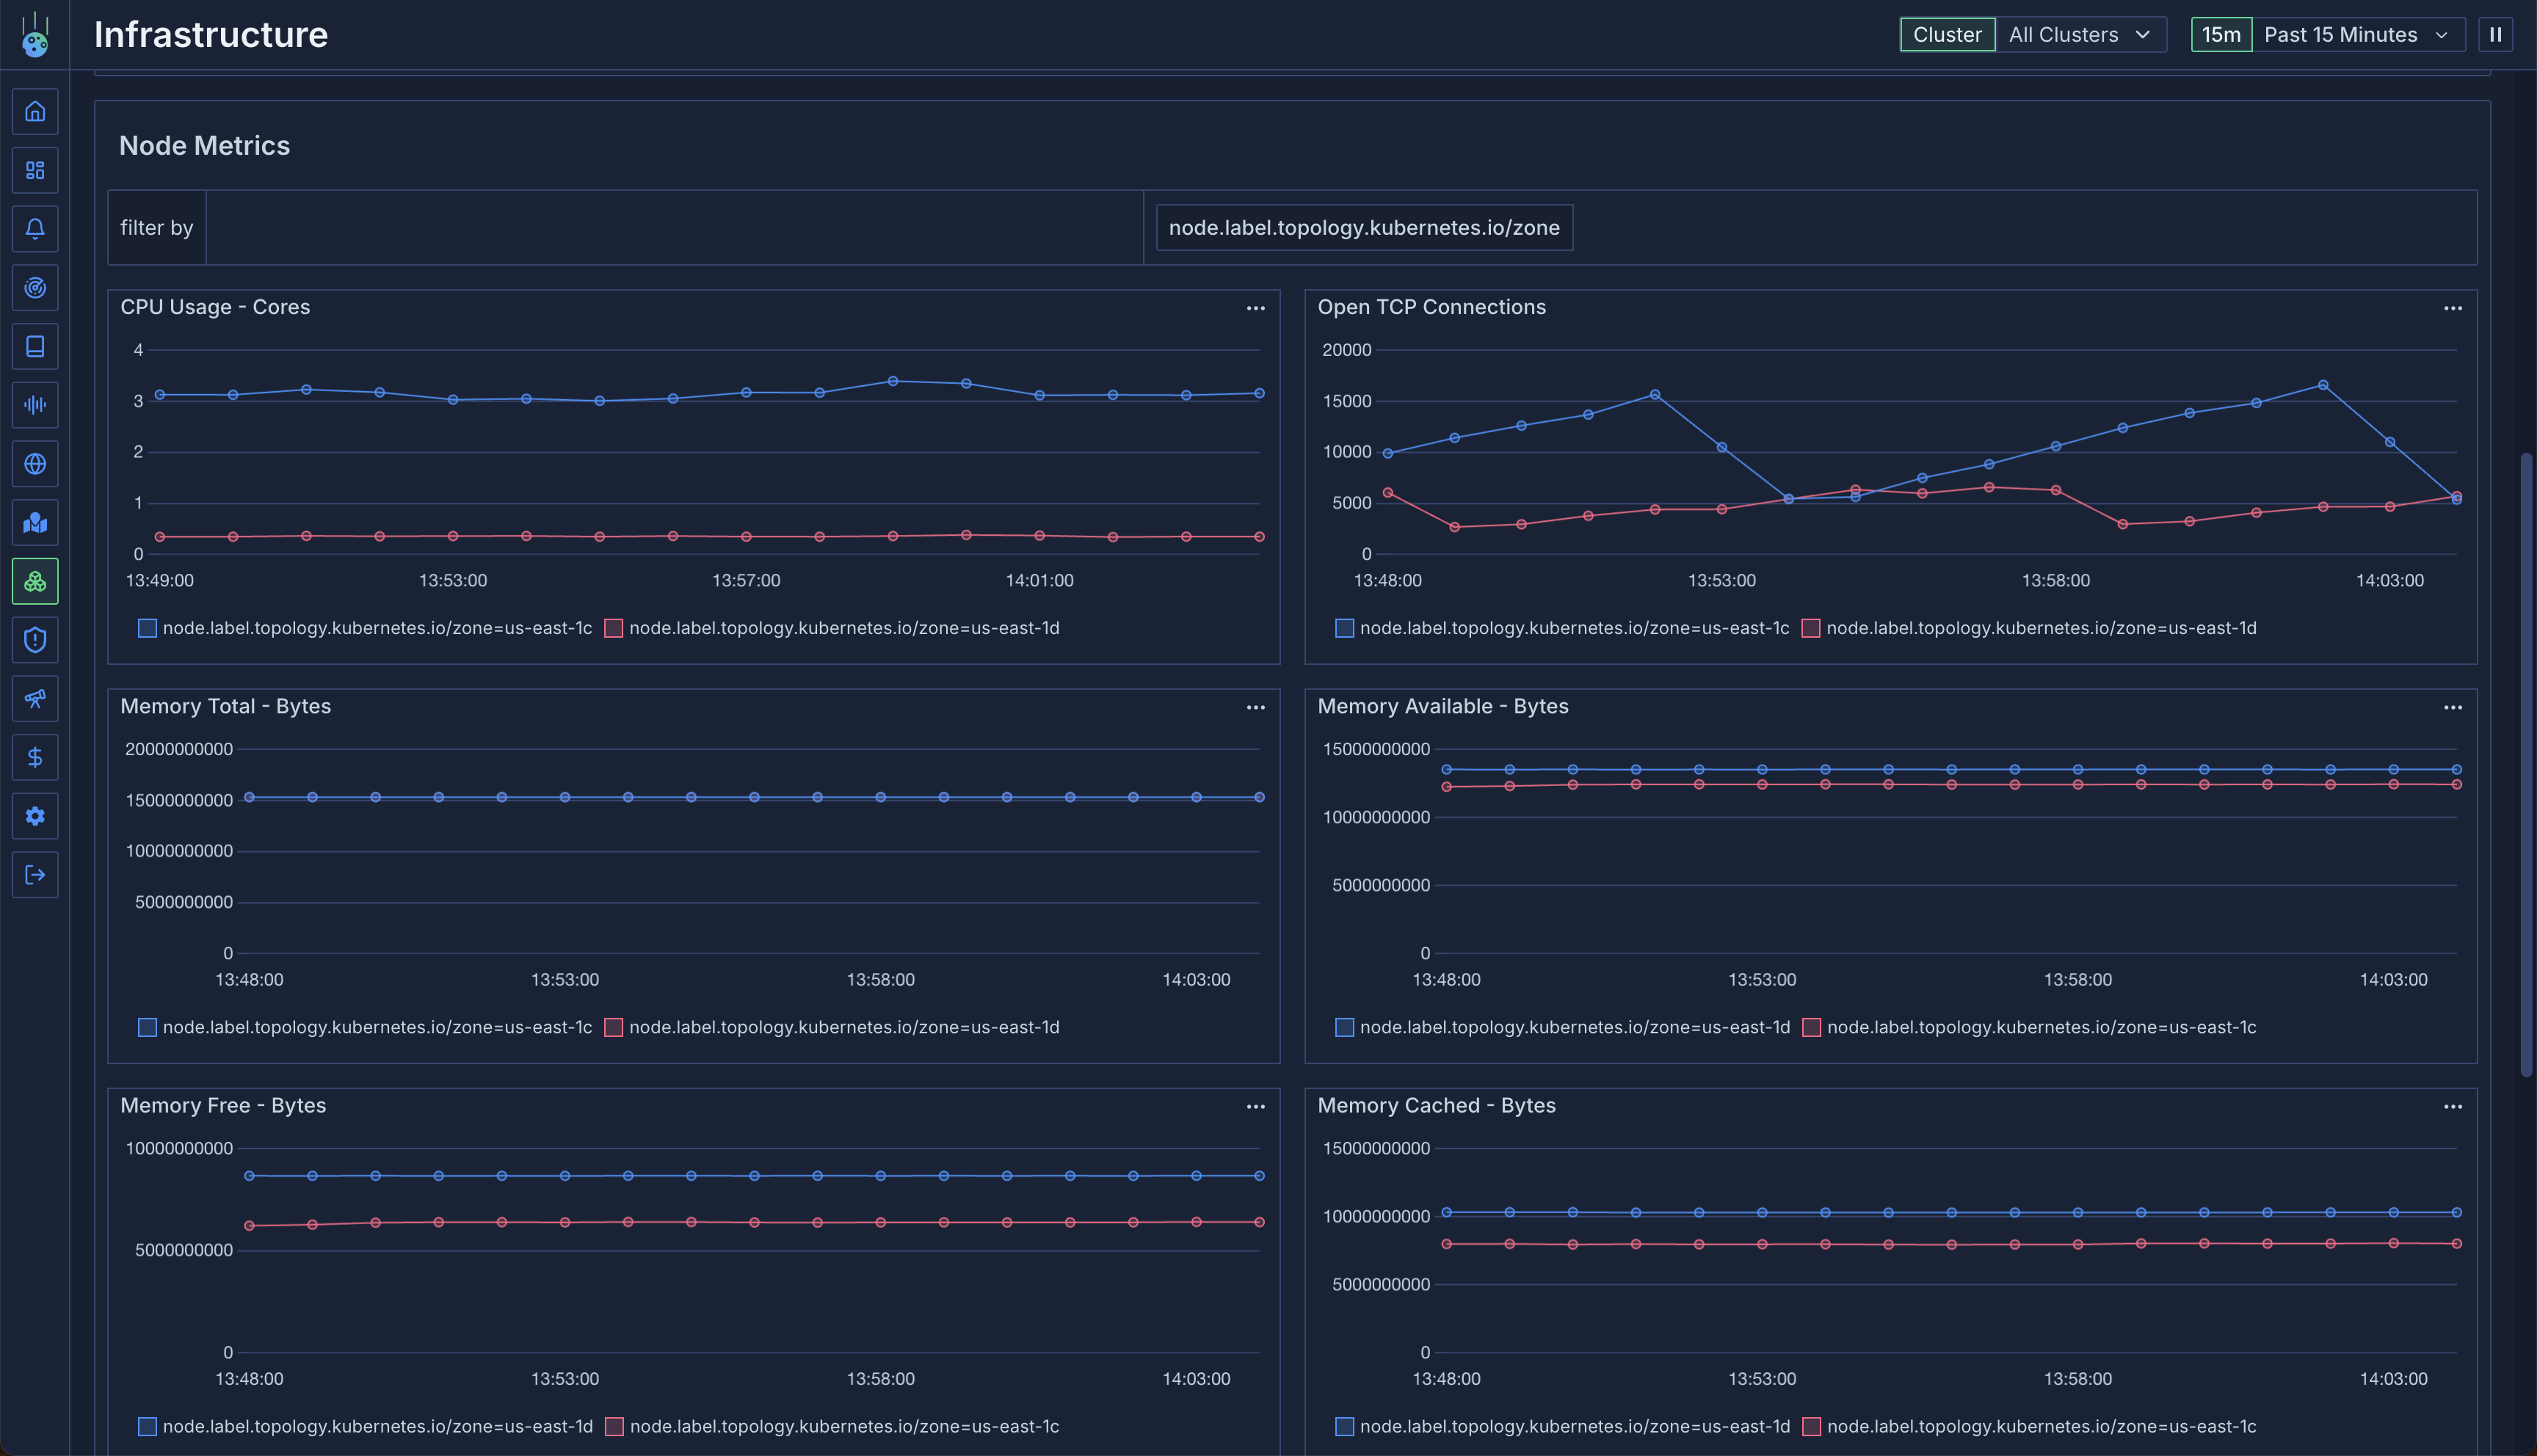 All node metrics are tagged with various attributes. See the [Metrics Overview](/metrics/overview) for detailed
information about available tags and filtering options.
# Event Ingestion
Source: https://metoro.io/docs/integrations/event-ingestion
Convert arbitrary JSON events to logs in Metoro
# Event Ingestion Integration
The Event Ingestion Integration allows you to convert arbitrary JSON events into logs that can be ingested and analyzed in Metoro. This is particularly useful when you want to send custom events, webhooks, or any JSON-structured data to be processed as logs.
## Overview
The integration provides a simple HTTP endpoint that accepts JSON payloads and converts them into structured logs. Each event is automatically enriched with metadata such as service name and environment, making it easy to filter and analyze the data in Metoro's log viewer.
## Getting Started
### Prerequisites
* Admin access to your Metoro organization
* HTTP client capable of making POST requests with JSON payloads
### Setting Up Event Ingestion
1. Navigate to the Settings > Integratios > Event Ingestion section.
2. Click the "Add Token" button (requires admin privileges)
3. Fill in the required information:
* **Service Name**: A unique identifier for the service sending events (e.g., "payment-webhook")
* **Environment**: The environment this integration will be used in (e.g., "production")
4. Click "Create Token" to generate your ingestion token
All node metrics are tagged with various attributes. See the [Metrics Overview](/metrics/overview) for detailed
information about available tags and filtering options.
# Event Ingestion
Source: https://metoro.io/docs/integrations/event-ingestion
Convert arbitrary JSON events to logs in Metoro
# Event Ingestion Integration
The Event Ingestion Integration allows you to convert arbitrary JSON events into logs that can be ingested and analyzed in Metoro. This is particularly useful when you want to send custom events, webhooks, or any JSON-structured data to be processed as logs.
## Overview
The integration provides a simple HTTP endpoint that accepts JSON payloads and converts them into structured logs. Each event is automatically enriched with metadata such as service name and environment, making it easy to filter and analyze the data in Metoro's log viewer.
## Getting Started
### Prerequisites
* Admin access to your Metoro organization
* HTTP client capable of making POST requests with JSON payloads
### Setting Up Event Ingestion
1. Navigate to the Settings > Integratios > Event Ingestion section.
2. Click the "Add Token" button (requires admin privileges)
3. Fill in the required information:
* **Service Name**: A unique identifier for the service sending events (e.g., "payment-webhook")
* **Environment**: The environment this integration will be used in (e.g., "production")
4. Click "Create Token" to generate your ingestion token
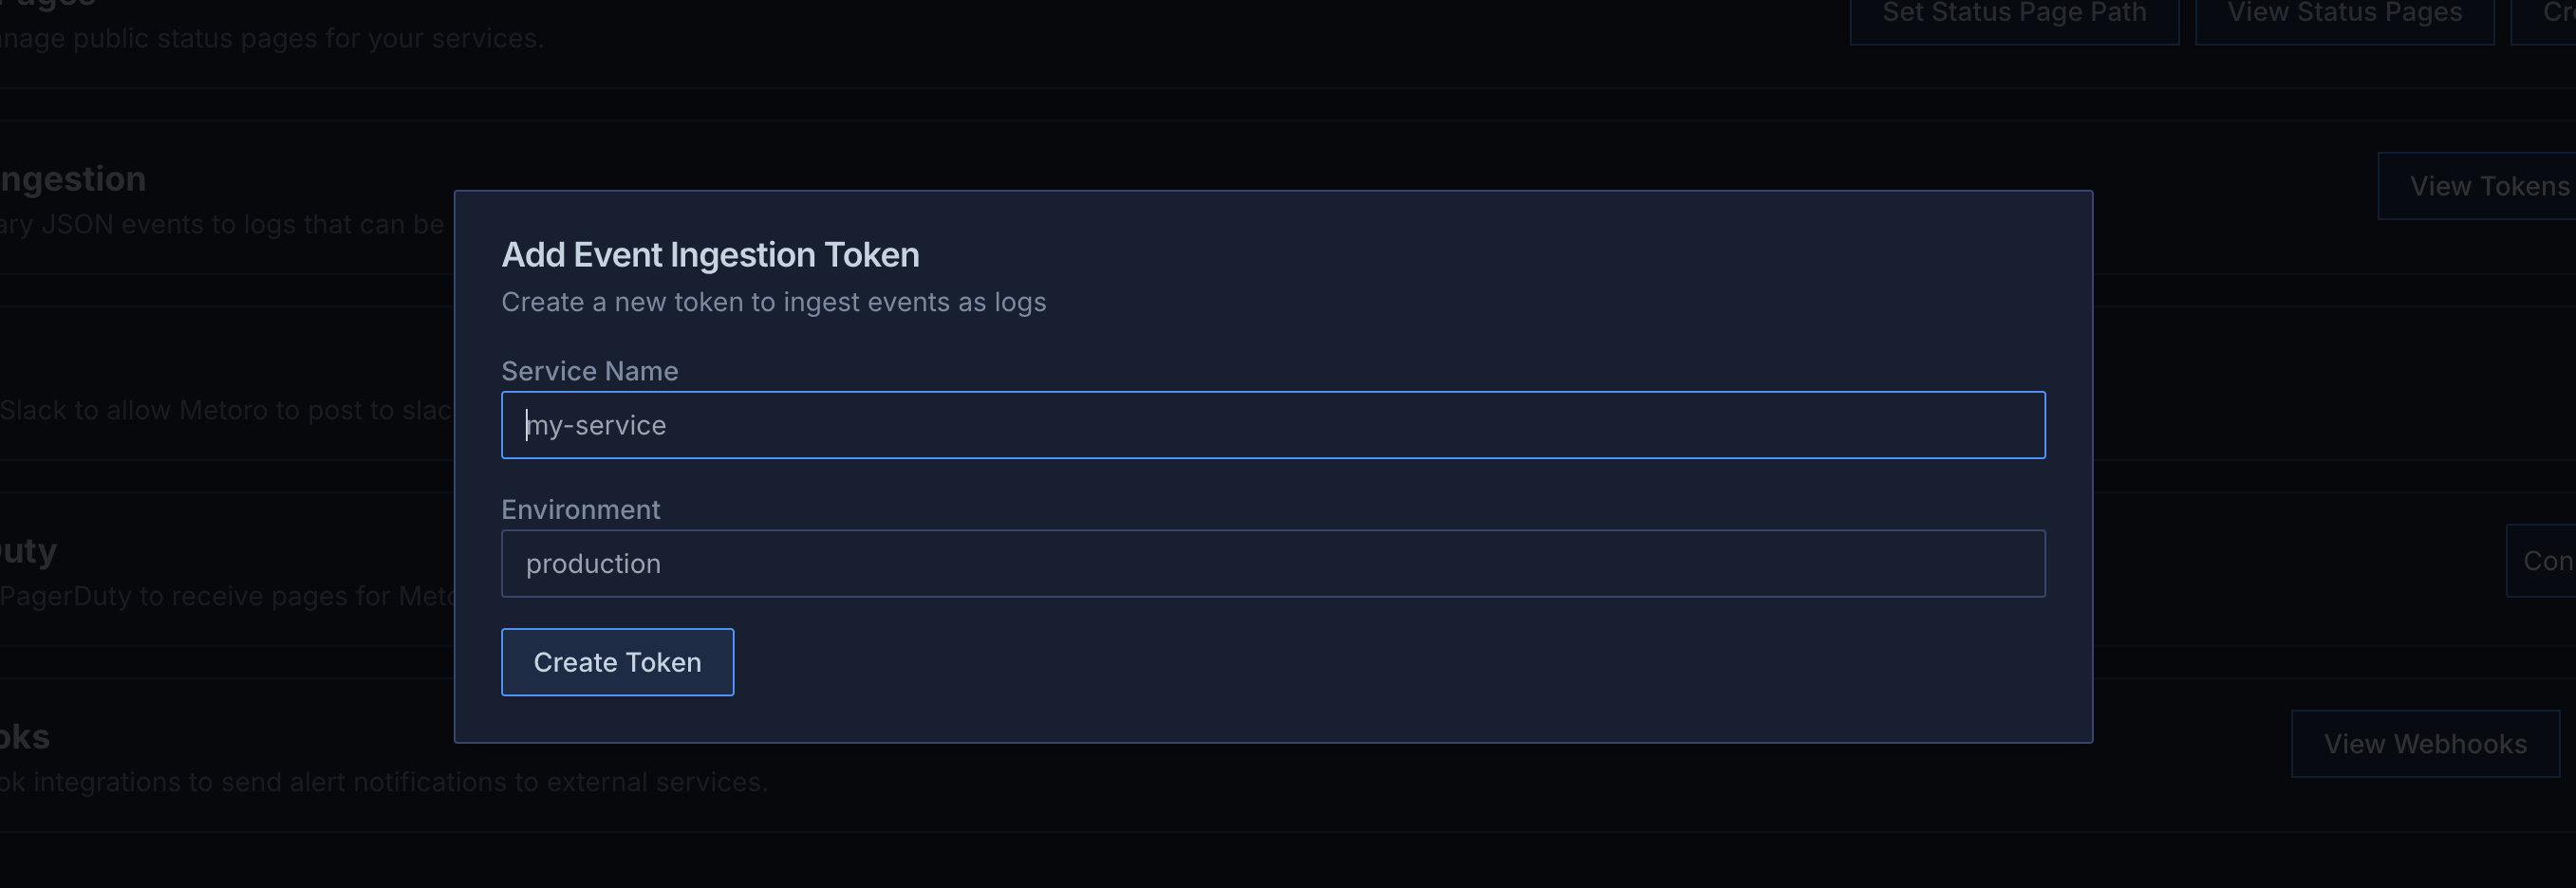 **Metoro Ingestion Endpoint**
`https://us-east.metoro.io/api/v1/webhook/event/log`
### Using the Integration
To send events to Metoro, make HTTP POST requests to the ingestion endpoint with your token:
```bash
curl -X POST https://us-east.metoro.io/api/v1/webhook/event/log \
-H "Authorization: Bearer " \
-H "Content-Type: application/json" \
-d '{
"message": "Payment succeeded",
"amount": 2000,
"currency": "USD",
"customer_id": "cus_111",
"metadata": {
"source": "stripe"
},
"level": "info"
}'
```
### Payload Structure
The JSON payload can contain any valid JSON structure. Metoro will automatically:
* Parse the JSON structure
* Convert it into a log entry
* Enrich it with your service name and environment
* Make it searchable in the Logs section
**Log Level and Message Handling**
* Metoro will guess the **log level** based on the presence of certain fields (e.g., "error" or "info")
* If you want to override the log level, you can include a `level` or `severity` field in your payload with values like "info", "warn", "error", etc.
* As the **log message**, Metoro will try to use `message` or `msg` fields if present, otherwise it will use the entire payload as the message.
### Managing Tokens
* **View Tokens**: Administrators can view all existing tokens in the Event Ingestion section
* **Copy Token**: Use the copy button next to each token to copy it to your clipboard
* **Delete Token**: Remove tokens that are no longer needed (this action cannot be undone)
**Metoro Ingestion Endpoint**
`https://us-east.metoro.io/api/v1/webhook/event/log`
### Using the Integration
To send events to Metoro, make HTTP POST requests to the ingestion endpoint with your token:
```bash
curl -X POST https://us-east.metoro.io/api/v1/webhook/event/log \
-H "Authorization: Bearer " \
-H "Content-Type: application/json" \
-d '{
"message": "Payment succeeded",
"amount": 2000,
"currency": "USD",
"customer_id": "cus_111",
"metadata": {
"source": "stripe"
},
"level": "info"
}'
```
### Payload Structure
The JSON payload can contain any valid JSON structure. Metoro will automatically:
* Parse the JSON structure
* Convert it into a log entry
* Enrich it with your service name and environment
* Make it searchable in the Logs section
**Log Level and Message Handling**
* Metoro will guess the **log level** based on the presence of certain fields (e.g., "error" or "info")
* If you want to override the log level, you can include a `level` or `severity` field in your payload with values like "info", "warn", "error", etc.
* As the **log message**, Metoro will try to use `message` or `msg` fields if present, otherwise it will use the entire payload as the message.
### Managing Tokens
* **View Tokens**: Administrators can view all existing tokens in the Event Ingestion section
* **Copy Token**: Use the copy button next to each token to copy it to your clipboard
* **Delete Token**: Remove tokens that are no longer needed (this action cannot be undone)
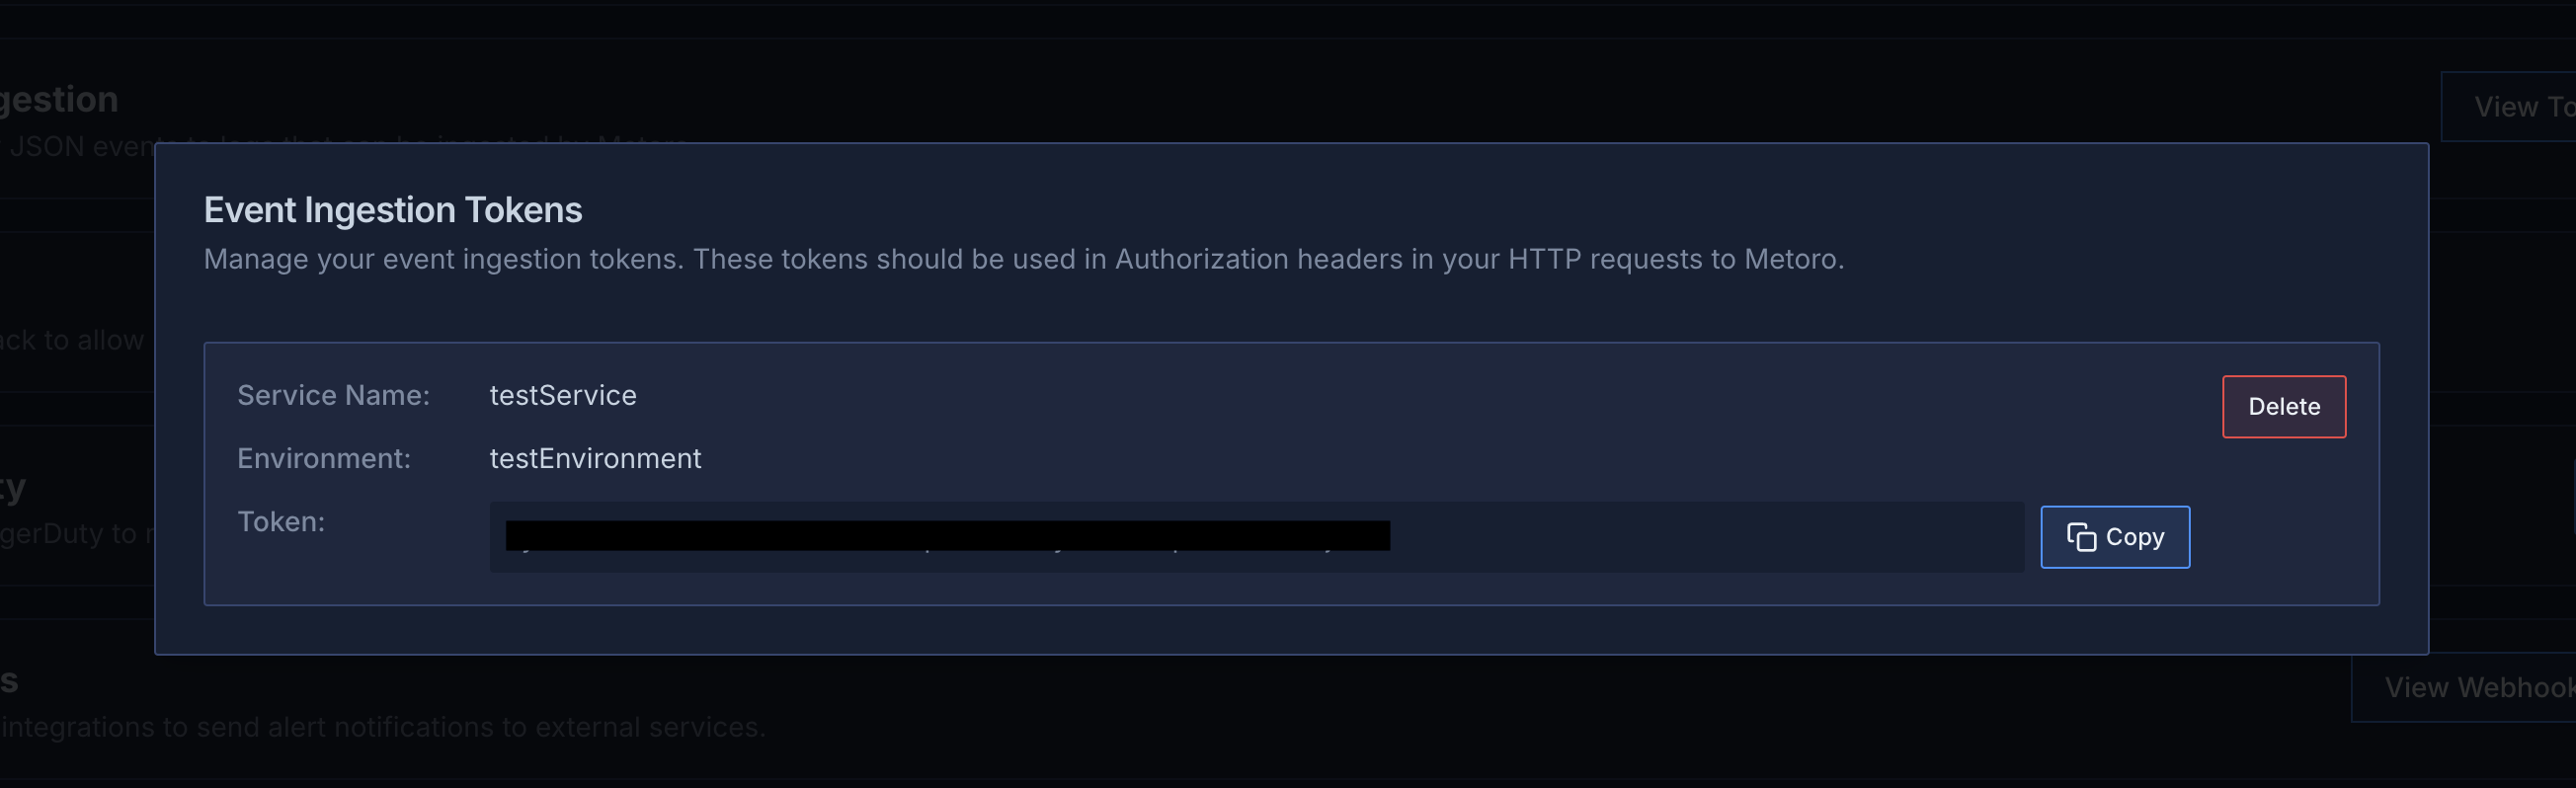 ## Security Considerations
* Keep your ingestion tokens secure and treat them like secrets
* Delete and re-create tokens if you suspect they have been compromised
* Use environment-specific tokens to maintain separation between environments
* Only administrators can manage tokens to maintain security
## Best Practices
1. **Structured Data**: Send well-structured JSON data to make it easier to query and analyze
2. **Meaningful Names**: Use descriptive service names that clearly indicate the source of events
3. **Environment Separation**: Create separate tokens for different environments
4. **Token Management**: Regularly audit and remove unused tokens
5. **Error Handling**: Implement proper error handling in your integration code to handle failed requests
## Viewing Events
Once events are ingested:
1. Navigate to the Logs section in Metoro
2. Filter by your service name to see ingested events
3. Use the search and filter capabilities to analyze your data
4. Create dashboards and alerts based on your ingested events
## Limitations
* Tokens cannot be edited after creation (delete and create new ones if needed)
## Troubleshooting
Common issues and solutions:
1. **Authentication Failed**
* Verify you're using the correct token
* Check if the token is still active
* Ensure the "Authorization" header is properly formatted
2. **Invalid JSON**
* Validate your JSON payload before sending
* Check for proper escaping of special characters
* Ensure the Content-Type header is set to "application/json"
For additional support, contact Metoro support or join our community Slack channel.
# GitHub
Source: https://metoro.io/docs/integrations/github
Integrate Metoro with GitHub to access your repositories
# GitHub Integration
Metoro can integrate with GitHub to access your repositories, allowing for enhanced observability of your GitHub projects.
## Configuration
To set up GitHub integration, you'll need to:
1. Navigate to **Settings** > **Integrations** in the Metoro UI
2. Find the GitHub section
3. Enter your GitHub Personal Access Token
4. Click "Add GitHub Token"
The GitHub token should have appropriate permissions to read the repositories you want to monitor. At a minimum, it should have the `repo` scope for private repositories or `public_repo` for public repositories only.
## Creating a GitHub Personal Access Token
To create a GitHub Personal Access Token:
1. Go to your GitHub account settings
2. Navigate to **Developer settings** > **Personal access tokens** > **Tokens (classic)**
3. Click "Generate new token"
4. Give your token a descriptive name
5. Select the appropriate scopes (at least `repo` or `public_repo`)
6. Click "Generate token"
7. Copy the token (you will only see it once!)
## Managing the Integration
Once configured, you can:
* View the status of your GitHub integration in the Integrations tab
* Remove the integration by clicking the "Disconnect" button
## Using GitHub Integration
With GitHub integration enabled, Metoro can:
* Access your repository data
* Read code and configuration files
* Provide context-aware observability for your GitHub-hosted projects
## Security Considerations
* Metoro stores your GitHub token securely in the database
* The token is used only for accessing repository data as specified by the token's permissions
* You can revoke the token at any time from your GitHub settings
# null
Source: https://metoro.io/docs/integrations/overview
# Integrations
Metoro integrates with various third-party services and tools to enhance your observability workflow. Here are the available integrations:
## Data Ingestion
* [Event Ingestion](/integrations/event-ingestion) - Convert arbitrary JSON events to logs that can be ingested and analyzed in Metoro
## Code Repositories
* [GitHub](/integrations/github) - Connect to GitHub repositories for enhanced code context and observability
## Alerting & Notifications
* [PagerDuty](/integrations/pagerduty) - Forward alerts to PagerDuty for incident management
* [Slack](/integrations/slack) - Send notifications and alerts to your Slack channels
* [Webhooks](/integrations/webhooks) - Send alerts to any HTTP endpoint
## Billing & Payments
* [Stripe](/administration/billing-stripe) - Manage your subscription and payments through Stripe
* [AWS Marketplace](/administration/billing-aws-marketplace) - Purchase and manage Metoro through AWS Marketplace
# PagerDuty Integration
Source: https://metoro.io/docs/integrations/pagerduty
## PagerDuty + Metoro Integration Benefits
* Notify on-call responders based on alerts sent from Metoro.
* Send event details from Metoro including description of the alert that triggered the event.
## How it Works
* When an alert is created in Metoro, you can select a PagerDuty service as the destination for the alert. If the alert breaches the defined threshold, an event will be sent to the selected PagerDuty service.
## Requirements
* To set up the PagerDuty integration in Metoro, you need to be an Admin user.
* Admin users are listed as "Admin" as their **Role** in **Settings** > **Users** in Metoro.
* If you are not an Admin user, you will need to contact an Admin user in your organization to set up the integration for you.
## Support
If you need help with this integration, please email [support@metoro.io](mailto:support@metoro.io) or join our [Community Slack](https://join.slack.com/t/metorocommunity/shared_invite/zt-2makpjl5j-F0WcpGnPcdc8anbNGcewqw).
## Integration Walkthrough
### In PagerDuty
* If you already have a PagerDuty service that you would like to use to receive alert events from Metoro, please skip to **In Metoro** section.
* If you are creating a new service for your integration:
* Please read PagerDuty documentation in section [Configuring Services and Integrations](https://support.pagerduty.com/docs/services-and-integrations#section-configuring-services-and-integrations) and follow the steps outlined in the [Create a New Service](https://support.pagerduty.com/docs/services-and-integrations#section-create-a-new-service) section.
* **Important Note**: **Do not** follow the steps in section [Add Integrations to an Existing Service](https://support.pagerduty.com/main/docs/services-and-integrations#add-integrations-to-an-existing-service) as Metoro will do these steps for you.
### In Metoro
#### Select PagerDuty Services to Integrate
1. Navigate to **Settings** from the Metoro sidebar.
2. Under **Integrations** tab in Settings, find **PagerDuty** integration and click **Connect to PagerDuty** button.

3. You will be redirected to the PagerDuty login page for authorizaton. Enter your PagerDuty credentials and click **Sign in**.
4. Once you log in, you will be redirected back to Metoro, **Connect Metoro and PagerDuty** page will be displayed.

5. Select the PagerDuty service(s) you want to integrate with Metoro from the dropdown list and click **Connect** when you are done. You will be taken back to the **Settings** page in Metoro if the integration is successful.
* **Note**: If you do not see the PagerDuty service you want to integrate with Metoro in the dropdown list, please make sure you have followed the steps in the **In PagerDuty** section above. If you have followed the steps and still do not see the service, please contact us using one of the support options listed in the **Support** section above.
* **Note**: If the integration is successful for the selected service(s), you will see an Integration named **Metoro - PagerDuty** in your PagerDuty account in **Services** > **Service Directory** > select **your service** > under **Integrations** tab.
6. You can view the PagerDuty services you have integrated with Metoro in the **PagerDuty** section under **Integrations** tab in **Settings** and add and remove services as needed at any time.

#### Select PagerDuty as a Destination in Alert Creation
1. Navigate to **Alerts** from the Metoro sidebar. Click **Create Alert** button and follow the steps to create an alert.

2. In the **Select Destination** section of the alert creation wizard, select **PagerDuty**.
3. When you select **PagerDuty**, you will see an option to configure a PagerDuty Service to send the alerts to. Click **Select** to see a dropdown list of the PagerDuty services you have integrated with Metoro. Select the service you want to send the alerts to.

4. Follow the rest of the steps in the alert creation wizard to complete the alert creation.
### How to Uninstall
* In Metoro, navigate to **Settings** from the Metoro sidebar. Under **Integrations** tab, find **PagerDuty** integration and click **Disconnect** button and confirm deletion by clicking **Delete Integration** on the pop-up dialog.

# Slack Integration
Source: https://metoro.io/docs/integrations/slack
To set up a slack integration, go to the [integrations](https://us-east.metoro.io/integrations) page and click on the `Add to slack` button.
Walk through the oauth flow to connect your slack account to Metoro.
After your account is connected you can select slack as a destination in the alert creation wizard.

# Webhook Integration
Source: https://metoro.io/docs/integrations/webhooks
To add your webhook to Metoro, go to the [integrations](https://us-east.metoro.io/integrations) page and click on the `Add Webhook` button.
Fill in the details of the webhook and click on the `Add Webhook` button.

* Name (required): The name of the webhook
* URL (required): The URL of the webhook
* HTTP Method: The HTTP method to use when sending the webhook. Default is `POST`
* Headers: Additional headers to send with the webhook. If you are sending a POST request,`Content-Type` header is added by default with the value `application/json`. You can add more headers by clicking on the `Add Header` button.
* Body Template: If you would like to send a custom body with the webhook, you can use the body template. You can use the following template variables in your webhook body:
* `$alert_name`: The name of the alert
* `$alert_description`: The description of the alert
* `$environment`: \[**Deprecated** - use `$attributes` instead] Environment context of the alert. It's set for Kubernetes and Log alerts only or if the alert has a group by with `environment`
* `$service`: \[**Deprecated** - use `$attributes` instead] The service associated with the alert. It's set for Kubernetes and Log alerts only or if the alert has a group by with `service.name`/`service_name`/`client.service.name`/`server.service.name`.
* `$fired_at`: Unix Timestamp when alert was fired
* `$resolved_at`: Unix Timestamp when alert was resolved/recovered.
* `$breaching_datapoint_value`: The last metric/trace value that triggered the alert. It's set for Trace and Metric alerts only.
* `$breaching_datapoint_time`: Unix Timestamp of the last breaching value. It's set for Trace and Metric alerts only.
* `$metric_name`: Name of the metric that triggered the alert. It's set for Trace and Metric alerts only.
* `$attributes`: A map of attributes associated with the firing alert. Only set if the alert has a group by.
Example Body Templates:
1. JSON format:
```json
{ "alert": "$alert_name", "value": "$breaching_datapoint_value" }
```
2. Plain text format:
```text
Alert $alert_name was triggered with value $breaching_datapoint_value
```
3. XML format:
```xml
$alert_name$breaching_datapoint_value
```
Remember to set the `Content-Type` header in the headers section with the appropriate value.
After your webhook is added, you can select your webhook as a destination in the alert creation wizard.

# CPU Throttling Detection
Source: https://metoro.io/docs/issue-detection/cpu-throttling
Detect CPU throttling in your Kubernetes services
The CPU Throttling Detection workflow monitors your Kubernetes services for CPU throttling events and creates issues when services experience significant throttling. This helps you identify when services are being constrained by their CPU limits and take corrective action.
## How it Works
The workflow monitors two key metrics:
* `container_resources_cpu_throttled_seconds_total`: Measures the time a container spends throttled due to CPU limits
* `container_resources_cpu_usage_seconds_total`: Measures the total CPU time used by the container
When the ratio of throttling time to CPU usage time exceeds configured thresholds, the workflow creates an issue to alert you about potential CPU constraints.
## Configuration
The workflow can be configured with the following parameters:
| Parameter | Type | Description | Default |
| ------------------------- | ----- | ------------------------------------------------------------------------------------- | ------------- |
| `mediumThrottleThreshold` | float | Minimum throttling ratio (throttle time / CPU time) to create a medium severity issue | 0.05 (5%) |
| `highThrottleThreshold` | float | Minimum throttling ratio to create a high severity issue | 0.10 (10%) |
| `minCpuSeconds` | float | Minimum CPU seconds used in the time window before considering throttling issues | 3600 (1 hour) |
## Issue Details
When an issue is created, it includes:
* The service and environment experiencing CPU throttling
* The throttling ratio (percentage of CPU time spent throttled)
* The severity level based on the throttling ratio
* A visualization showing:
* CPU throttling over time
* CPU usage patterns
## Example Issue
Here's an example of an issue created by the CPU Throttling Detection workflow:
```
Title: CPU Throttling Detected: my-service (production)
Service my-service (production environment) is experiencing severe CPU throttling (15.0% of CPU time).
This indicates that the service is being significantly constrained by CPU limits.
```
## Severity Levels
The workflow assigns severity levels based on the throttling ratio:
* **Medium**: When the throttling ratio meets or exceeds `mediumThrottleThreshold` (default: 5%)
* **High**: When the throttling ratio meets or exceeds `highThrottleThreshold` (default: 10%)
## Understanding CPU Throttling
CPU throttling in Kubernetes can be counterintuitive. Even if your average CPU usage is under the limit, you can still experience throttling due to how Kubernetes implements CPU limits:
1. The default quota period is 100ms
2. For example, with a 50m (millicores) CPU limit:
* The container gets a 5ms CPU quota per 100ms period
* If the container needs more than 5ms of CPU in any 100ms period, it gets throttled
* This happens even if the average CPU usage over longer periods is below the limit
This is particularly problematic for request-handling services because throttling manifests as increased latency.
## Related Documentation
* [Issue Detection Overview](/issue-detection/overview)
* [Right Sizing](/issue-detection/right-sizing)
# OOM Detection
Source: https://metoro.io/docs/issue-detection/oom-detection
Detect Out of Memory (OOM) events in your Kubernetes services
The OOM Detection workflow monitors your Kubernetes services for Out of Memory (OOM) events and creates issues when services experience OOM events. This helps you identify memory-related problems in your services and take corrective action.
## How it Works
The workflow monitors the `container_oom_kills_total` metric, which is incremented each time a container in your service is killed due to an Out of Memory condition. When a service experiences more than the configured number of OOM events, an issue is created with details about the events.
## Configuration
The workflow can be configured with the following parameters:
| Parameter | Type | Description | Default |
| --------------------------- | ------- | -------------------------------------------------------- | ------- |
| `minOOMEventsToCreateIssue` | integer | Minimum number of OOM events required to create an issue | 1 |
## Issue Details
When an issue is created, it includes:
* The service and environment where OOM events occurred
* The number of OOM events in the last 24 hours
* The severity level (high if OOM count is 10x the minimum threshold)
* A visualization showing:
* OOM events over time
* Memory usage patterns
* Memory limits and requests
## Example Issue
Here's an example of an issue created by the OOM Detection workflow:
```
Title: OOMs Detected: my-service (production)
Service my-service (production environment) has experienced 5 OOM events in the last 24 hours.
High severity as the service experienced > 10x the minimum number of OOM events.
```
## Severity Levels
The workflow assigns severity levels based on the number of OOM events:
* **Medium**: When the number of OOM events meets or exceeds `minOOMEventsToCreateIssue`
* **High**: When the number of OOM events is 10x or more than `minOOMEventsToCreateIssue`
## Best Practices
1. **Set Appropriate Thresholds**: Configure `minOOMEventsToCreateIssue` based on your service's characteristics. A lower threshold is more sensitive but may generate more issues.
2. **Monitor Memory Usage**: Use the issue details view to understand memory usage patterns leading up to OOM events. Look for:
* Memory usage approaching limits
* Sudden spikes in memory usage
* Inadequate memory limits or requests
3. **Regular Review**: Regularly review OOM issues to identify patterns and systemic problems in your services.
4. **Memory Management**: When OOM issues are detected:
* Review and adjust memory limits
* Look for memory leaks
* Consider implementing memory optimization strategies
* Monitor memory usage trends
## Related Documentation
* [Issue Detection Overview](/issue-detection/overview)
# Overview
Source: https://metoro.io/docs/issue-detection/overview
Understand the Metoro issue detection system
## Overview
Metoro's issue detection system continuously monitors your clusters to identify potential problems and inefficiencies. It operates through two main concepts:
1. **Issues**: Concrete problems identified within cluster components
2. **Workflows**: Automated processes that scan clusters to detect issues
## Understanding Issues
Issues represent specific problems detected within your cluster components. Examples include:
* Services with excessive memory allocation
* Over-provisioned nodes with low utilization
* High error rates (e.g., HTTP 500s) from specific containers
Each issue is assigned attributes:
* **Severity** (Low to High): Helps prioritize resolution
* **Attributes**: Identifying information (service name, namespace, etc.)
* **Measurements**: Quantitative data about the issue
Severity levels help prioritize issues:
* **Low**: Efficiency improvements (e.g., over-provisioned resources)
* **Medium**: Performance impacts (e.g., CPU throttling)
* **High**: Critical problems requiring immediate attention
## Workflows
Workflows are automated processes that continuously scan your clusters for issues.
* Run every 24 hours by default (midnight UTC)
* Analyze previous day's data
* Automatically close resolved issues and open new ones when detected
* Configurable parameters for your specific needs
* Can be triggered on demand
Metoro includes several built-in workflows:
* [Right-Sizing Workflow](/issue-detection/right-sizing): Optimizes resource allocation across your services
* More workflows coming soon...
## Managing Issues
### Issues View
The issues view lists all open and closed issues. You can apply filters, sort and search to identify specific issues you'd like to address.
## Security Considerations
* Keep your ingestion tokens secure and treat them like secrets
* Delete and re-create tokens if you suspect they have been compromised
* Use environment-specific tokens to maintain separation between environments
* Only administrators can manage tokens to maintain security
## Best Practices
1. **Structured Data**: Send well-structured JSON data to make it easier to query and analyze
2. **Meaningful Names**: Use descriptive service names that clearly indicate the source of events
3. **Environment Separation**: Create separate tokens for different environments
4. **Token Management**: Regularly audit and remove unused tokens
5. **Error Handling**: Implement proper error handling in your integration code to handle failed requests
## Viewing Events
Once events are ingested:
1. Navigate to the Logs section in Metoro
2. Filter by your service name to see ingested events
3. Use the search and filter capabilities to analyze your data
4. Create dashboards and alerts based on your ingested events
## Limitations
* Tokens cannot be edited after creation (delete and create new ones if needed)
## Troubleshooting
Common issues and solutions:
1. **Authentication Failed**
* Verify you're using the correct token
* Check if the token is still active
* Ensure the "Authorization" header is properly formatted
2. **Invalid JSON**
* Validate your JSON payload before sending
* Check for proper escaping of special characters
* Ensure the Content-Type header is set to "application/json"
For additional support, contact Metoro support or join our community Slack channel.
# GitHub
Source: https://metoro.io/docs/integrations/github
Integrate Metoro with GitHub to access your repositories
# GitHub Integration
Metoro can integrate with GitHub to access your repositories, allowing for enhanced observability of your GitHub projects.
## Configuration
To set up GitHub integration, you'll need to:
1. Navigate to **Settings** > **Integrations** in the Metoro UI
2. Find the GitHub section
3. Enter your GitHub Personal Access Token
4. Click "Add GitHub Token"
The GitHub token should have appropriate permissions to read the repositories you want to monitor. At a minimum, it should have the `repo` scope for private repositories or `public_repo` for public repositories only.
## Creating a GitHub Personal Access Token
To create a GitHub Personal Access Token:
1. Go to your GitHub account settings
2. Navigate to **Developer settings** > **Personal access tokens** > **Tokens (classic)**
3. Click "Generate new token"
4. Give your token a descriptive name
5. Select the appropriate scopes (at least `repo` or `public_repo`)
6. Click "Generate token"
7. Copy the token (you will only see it once!)
## Managing the Integration
Once configured, you can:
* View the status of your GitHub integration in the Integrations tab
* Remove the integration by clicking the "Disconnect" button
## Using GitHub Integration
With GitHub integration enabled, Metoro can:
* Access your repository data
* Read code and configuration files
* Provide context-aware observability for your GitHub-hosted projects
## Security Considerations
* Metoro stores your GitHub token securely in the database
* The token is used only for accessing repository data as specified by the token's permissions
* You can revoke the token at any time from your GitHub settings
# null
Source: https://metoro.io/docs/integrations/overview
# Integrations
Metoro integrates with various third-party services and tools to enhance your observability workflow. Here are the available integrations:
## Data Ingestion
* [Event Ingestion](/integrations/event-ingestion) - Convert arbitrary JSON events to logs that can be ingested and analyzed in Metoro
## Code Repositories
* [GitHub](/integrations/github) - Connect to GitHub repositories for enhanced code context and observability
## Alerting & Notifications
* [PagerDuty](/integrations/pagerduty) - Forward alerts to PagerDuty for incident management
* [Slack](/integrations/slack) - Send notifications and alerts to your Slack channels
* [Webhooks](/integrations/webhooks) - Send alerts to any HTTP endpoint
## Billing & Payments
* [Stripe](/administration/billing-stripe) - Manage your subscription and payments through Stripe
* [AWS Marketplace](/administration/billing-aws-marketplace) - Purchase and manage Metoro through AWS Marketplace
# PagerDuty Integration
Source: https://metoro.io/docs/integrations/pagerduty
## PagerDuty + Metoro Integration Benefits
* Notify on-call responders based on alerts sent from Metoro.
* Send event details from Metoro including description of the alert that triggered the event.
## How it Works
* When an alert is created in Metoro, you can select a PagerDuty service as the destination for the alert. If the alert breaches the defined threshold, an event will be sent to the selected PagerDuty service.
## Requirements
* To set up the PagerDuty integration in Metoro, you need to be an Admin user.
* Admin users are listed as "Admin" as their **Role** in **Settings** > **Users** in Metoro.
* If you are not an Admin user, you will need to contact an Admin user in your organization to set up the integration for you.
## Support
If you need help with this integration, please email [support@metoro.io](mailto:support@metoro.io) or join our [Community Slack](https://join.slack.com/t/metorocommunity/shared_invite/zt-2makpjl5j-F0WcpGnPcdc8anbNGcewqw).
## Integration Walkthrough
### In PagerDuty
* If you already have a PagerDuty service that you would like to use to receive alert events from Metoro, please skip to **In Metoro** section.
* If you are creating a new service for your integration:
* Please read PagerDuty documentation in section [Configuring Services and Integrations](https://support.pagerduty.com/docs/services-and-integrations#section-configuring-services-and-integrations) and follow the steps outlined in the [Create a New Service](https://support.pagerduty.com/docs/services-and-integrations#section-create-a-new-service) section.
* **Important Note**: **Do not** follow the steps in section [Add Integrations to an Existing Service](https://support.pagerduty.com/main/docs/services-and-integrations#add-integrations-to-an-existing-service) as Metoro will do these steps for you.
### In Metoro
#### Select PagerDuty Services to Integrate
1. Navigate to **Settings** from the Metoro sidebar.
2. Under **Integrations** tab in Settings, find **PagerDuty** integration and click **Connect to PagerDuty** button.

3. You will be redirected to the PagerDuty login page for authorizaton. Enter your PagerDuty credentials and click **Sign in**.
4. Once you log in, you will be redirected back to Metoro, **Connect Metoro and PagerDuty** page will be displayed.

5. Select the PagerDuty service(s) you want to integrate with Metoro from the dropdown list and click **Connect** when you are done. You will be taken back to the **Settings** page in Metoro if the integration is successful.
* **Note**: If you do not see the PagerDuty service you want to integrate with Metoro in the dropdown list, please make sure you have followed the steps in the **In PagerDuty** section above. If you have followed the steps and still do not see the service, please contact us using one of the support options listed in the **Support** section above.
* **Note**: If the integration is successful for the selected service(s), you will see an Integration named **Metoro - PagerDuty** in your PagerDuty account in **Services** > **Service Directory** > select **your service** > under **Integrations** tab.
6. You can view the PagerDuty services you have integrated with Metoro in the **PagerDuty** section under **Integrations** tab in **Settings** and add and remove services as needed at any time.

#### Select PagerDuty as a Destination in Alert Creation
1. Navigate to **Alerts** from the Metoro sidebar. Click **Create Alert** button and follow the steps to create an alert.

2. In the **Select Destination** section of the alert creation wizard, select **PagerDuty**.
3. When you select **PagerDuty**, you will see an option to configure a PagerDuty Service to send the alerts to. Click **Select** to see a dropdown list of the PagerDuty services you have integrated with Metoro. Select the service you want to send the alerts to.

4. Follow the rest of the steps in the alert creation wizard to complete the alert creation.
### How to Uninstall
* In Metoro, navigate to **Settings** from the Metoro sidebar. Under **Integrations** tab, find **PagerDuty** integration and click **Disconnect** button and confirm deletion by clicking **Delete Integration** on the pop-up dialog.

# Slack Integration
Source: https://metoro.io/docs/integrations/slack
To set up a slack integration, go to the [integrations](https://us-east.metoro.io/integrations) page and click on the `Add to slack` button.
Walk through the oauth flow to connect your slack account to Metoro.
After your account is connected you can select slack as a destination in the alert creation wizard.

# Webhook Integration
Source: https://metoro.io/docs/integrations/webhooks
To add your webhook to Metoro, go to the [integrations](https://us-east.metoro.io/integrations) page and click on the `Add Webhook` button.
Fill in the details of the webhook and click on the `Add Webhook` button.

* Name (required): The name of the webhook
* URL (required): The URL of the webhook
* HTTP Method: The HTTP method to use when sending the webhook. Default is `POST`
* Headers: Additional headers to send with the webhook. If you are sending a POST request,`Content-Type` header is added by default with the value `application/json`. You can add more headers by clicking on the `Add Header` button.
* Body Template: If you would like to send a custom body with the webhook, you can use the body template. You can use the following template variables in your webhook body:
* `$alert_name`: The name of the alert
* `$alert_description`: The description of the alert
* `$environment`: \[**Deprecated** - use `$attributes` instead] Environment context of the alert. It's set for Kubernetes and Log alerts only or if the alert has a group by with `environment`
* `$service`: \[**Deprecated** - use `$attributes` instead] The service associated with the alert. It's set for Kubernetes and Log alerts only or if the alert has a group by with `service.name`/`service_name`/`client.service.name`/`server.service.name`.
* `$fired_at`: Unix Timestamp when alert was fired
* `$resolved_at`: Unix Timestamp when alert was resolved/recovered.
* `$breaching_datapoint_value`: The last metric/trace value that triggered the alert. It's set for Trace and Metric alerts only.
* `$breaching_datapoint_time`: Unix Timestamp of the last breaching value. It's set for Trace and Metric alerts only.
* `$metric_name`: Name of the metric that triggered the alert. It's set for Trace and Metric alerts only.
* `$attributes`: A map of attributes associated with the firing alert. Only set if the alert has a group by.
Example Body Templates:
1. JSON format:
```json
{ "alert": "$alert_name", "value": "$breaching_datapoint_value" }
```
2. Plain text format:
```text
Alert $alert_name was triggered with value $breaching_datapoint_value
```
3. XML format:
```xml
$alert_name$breaching_datapoint_value
```
Remember to set the `Content-Type` header in the headers section with the appropriate value.
After your webhook is added, you can select your webhook as a destination in the alert creation wizard.

# CPU Throttling Detection
Source: https://metoro.io/docs/issue-detection/cpu-throttling
Detect CPU throttling in your Kubernetes services
The CPU Throttling Detection workflow monitors your Kubernetes services for CPU throttling events and creates issues when services experience significant throttling. This helps you identify when services are being constrained by their CPU limits and take corrective action.
## How it Works
The workflow monitors two key metrics:
* `container_resources_cpu_throttled_seconds_total`: Measures the time a container spends throttled due to CPU limits
* `container_resources_cpu_usage_seconds_total`: Measures the total CPU time used by the container
When the ratio of throttling time to CPU usage time exceeds configured thresholds, the workflow creates an issue to alert you about potential CPU constraints.
## Configuration
The workflow can be configured with the following parameters:
| Parameter | Type | Description | Default |
| ------------------------- | ----- | ------------------------------------------------------------------------------------- | ------------- |
| `mediumThrottleThreshold` | float | Minimum throttling ratio (throttle time / CPU time) to create a medium severity issue | 0.05 (5%) |
| `highThrottleThreshold` | float | Minimum throttling ratio to create a high severity issue | 0.10 (10%) |
| `minCpuSeconds` | float | Minimum CPU seconds used in the time window before considering throttling issues | 3600 (1 hour) |
## Issue Details
When an issue is created, it includes:
* The service and environment experiencing CPU throttling
* The throttling ratio (percentage of CPU time spent throttled)
* The severity level based on the throttling ratio
* A visualization showing:
* CPU throttling over time
* CPU usage patterns
## Example Issue
Here's an example of an issue created by the CPU Throttling Detection workflow:
```
Title: CPU Throttling Detected: my-service (production)
Service my-service (production environment) is experiencing severe CPU throttling (15.0% of CPU time).
This indicates that the service is being significantly constrained by CPU limits.
```
## Severity Levels
The workflow assigns severity levels based on the throttling ratio:
* **Medium**: When the throttling ratio meets or exceeds `mediumThrottleThreshold` (default: 5%)
* **High**: When the throttling ratio meets or exceeds `highThrottleThreshold` (default: 10%)
## Understanding CPU Throttling
CPU throttling in Kubernetes can be counterintuitive. Even if your average CPU usage is under the limit, you can still experience throttling due to how Kubernetes implements CPU limits:
1. The default quota period is 100ms
2. For example, with a 50m (millicores) CPU limit:
* The container gets a 5ms CPU quota per 100ms period
* If the container needs more than 5ms of CPU in any 100ms period, it gets throttled
* This happens even if the average CPU usage over longer periods is below the limit
This is particularly problematic for request-handling services because throttling manifests as increased latency.
## Related Documentation
* [Issue Detection Overview](/issue-detection/overview)
* [Right Sizing](/issue-detection/right-sizing)
# OOM Detection
Source: https://metoro.io/docs/issue-detection/oom-detection
Detect Out of Memory (OOM) events in your Kubernetes services
The OOM Detection workflow monitors your Kubernetes services for Out of Memory (OOM) events and creates issues when services experience OOM events. This helps you identify memory-related problems in your services and take corrective action.
## How it Works
The workflow monitors the `container_oom_kills_total` metric, which is incremented each time a container in your service is killed due to an Out of Memory condition. When a service experiences more than the configured number of OOM events, an issue is created with details about the events.
## Configuration
The workflow can be configured with the following parameters:
| Parameter | Type | Description | Default |
| --------------------------- | ------- | -------------------------------------------------------- | ------- |
| `minOOMEventsToCreateIssue` | integer | Minimum number of OOM events required to create an issue | 1 |
## Issue Details
When an issue is created, it includes:
* The service and environment where OOM events occurred
* The number of OOM events in the last 24 hours
* The severity level (high if OOM count is 10x the minimum threshold)
* A visualization showing:
* OOM events over time
* Memory usage patterns
* Memory limits and requests
## Example Issue
Here's an example of an issue created by the OOM Detection workflow:
```
Title: OOMs Detected: my-service (production)
Service my-service (production environment) has experienced 5 OOM events in the last 24 hours.
High severity as the service experienced > 10x the minimum number of OOM events.
```
## Severity Levels
The workflow assigns severity levels based on the number of OOM events:
* **Medium**: When the number of OOM events meets or exceeds `minOOMEventsToCreateIssue`
* **High**: When the number of OOM events is 10x or more than `minOOMEventsToCreateIssue`
## Best Practices
1. **Set Appropriate Thresholds**: Configure `minOOMEventsToCreateIssue` based on your service's characteristics. A lower threshold is more sensitive but may generate more issues.
2. **Monitor Memory Usage**: Use the issue details view to understand memory usage patterns leading up to OOM events. Look for:
* Memory usage approaching limits
* Sudden spikes in memory usage
* Inadequate memory limits or requests
3. **Regular Review**: Regularly review OOM issues to identify patterns and systemic problems in your services.
4. **Memory Management**: When OOM issues are detected:
* Review and adjust memory limits
* Look for memory leaks
* Consider implementing memory optimization strategies
* Monitor memory usage trends
## Related Documentation
* [Issue Detection Overview](/issue-detection/overview)
# Overview
Source: https://metoro.io/docs/issue-detection/overview
Understand the Metoro issue detection system
## Overview
Metoro's issue detection system continuously monitors your clusters to identify potential problems and inefficiencies. It operates through two main concepts:
1. **Issues**: Concrete problems identified within cluster components
2. **Workflows**: Automated processes that scan clusters to detect issues
## Understanding Issues
Issues represent specific problems detected within your cluster components. Examples include:
* Services with excessive memory allocation
* Over-provisioned nodes with low utilization
* High error rates (e.g., HTTP 500s) from specific containers
Each issue is assigned attributes:
* **Severity** (Low to High): Helps prioritize resolution
* **Attributes**: Identifying information (service name, namespace, etc.)
* **Measurements**: Quantitative data about the issue
Severity levels help prioritize issues:
* **Low**: Efficiency improvements (e.g., over-provisioned resources)
* **Medium**: Performance impacts (e.g., CPU throttling)
* **High**: Critical problems requiring immediate attention
## Workflows
Workflows are automated processes that continuously scan your clusters for issues.
* Run every 24 hours by default (midnight UTC)
* Analyze previous day's data
* Automatically close resolved issues and open new ones when detected
* Configurable parameters for your specific needs
* Can be triggered on demand
Metoro includes several built-in workflows:
* [Right-Sizing Workflow](/issue-detection/right-sizing): Optimizes resource allocation across your services
* More workflows coming soon...
## Managing Issues
### Issues View
The issues view lists all open and closed issues. You can apply filters, sort and search to identify specific issues you'd like to address.
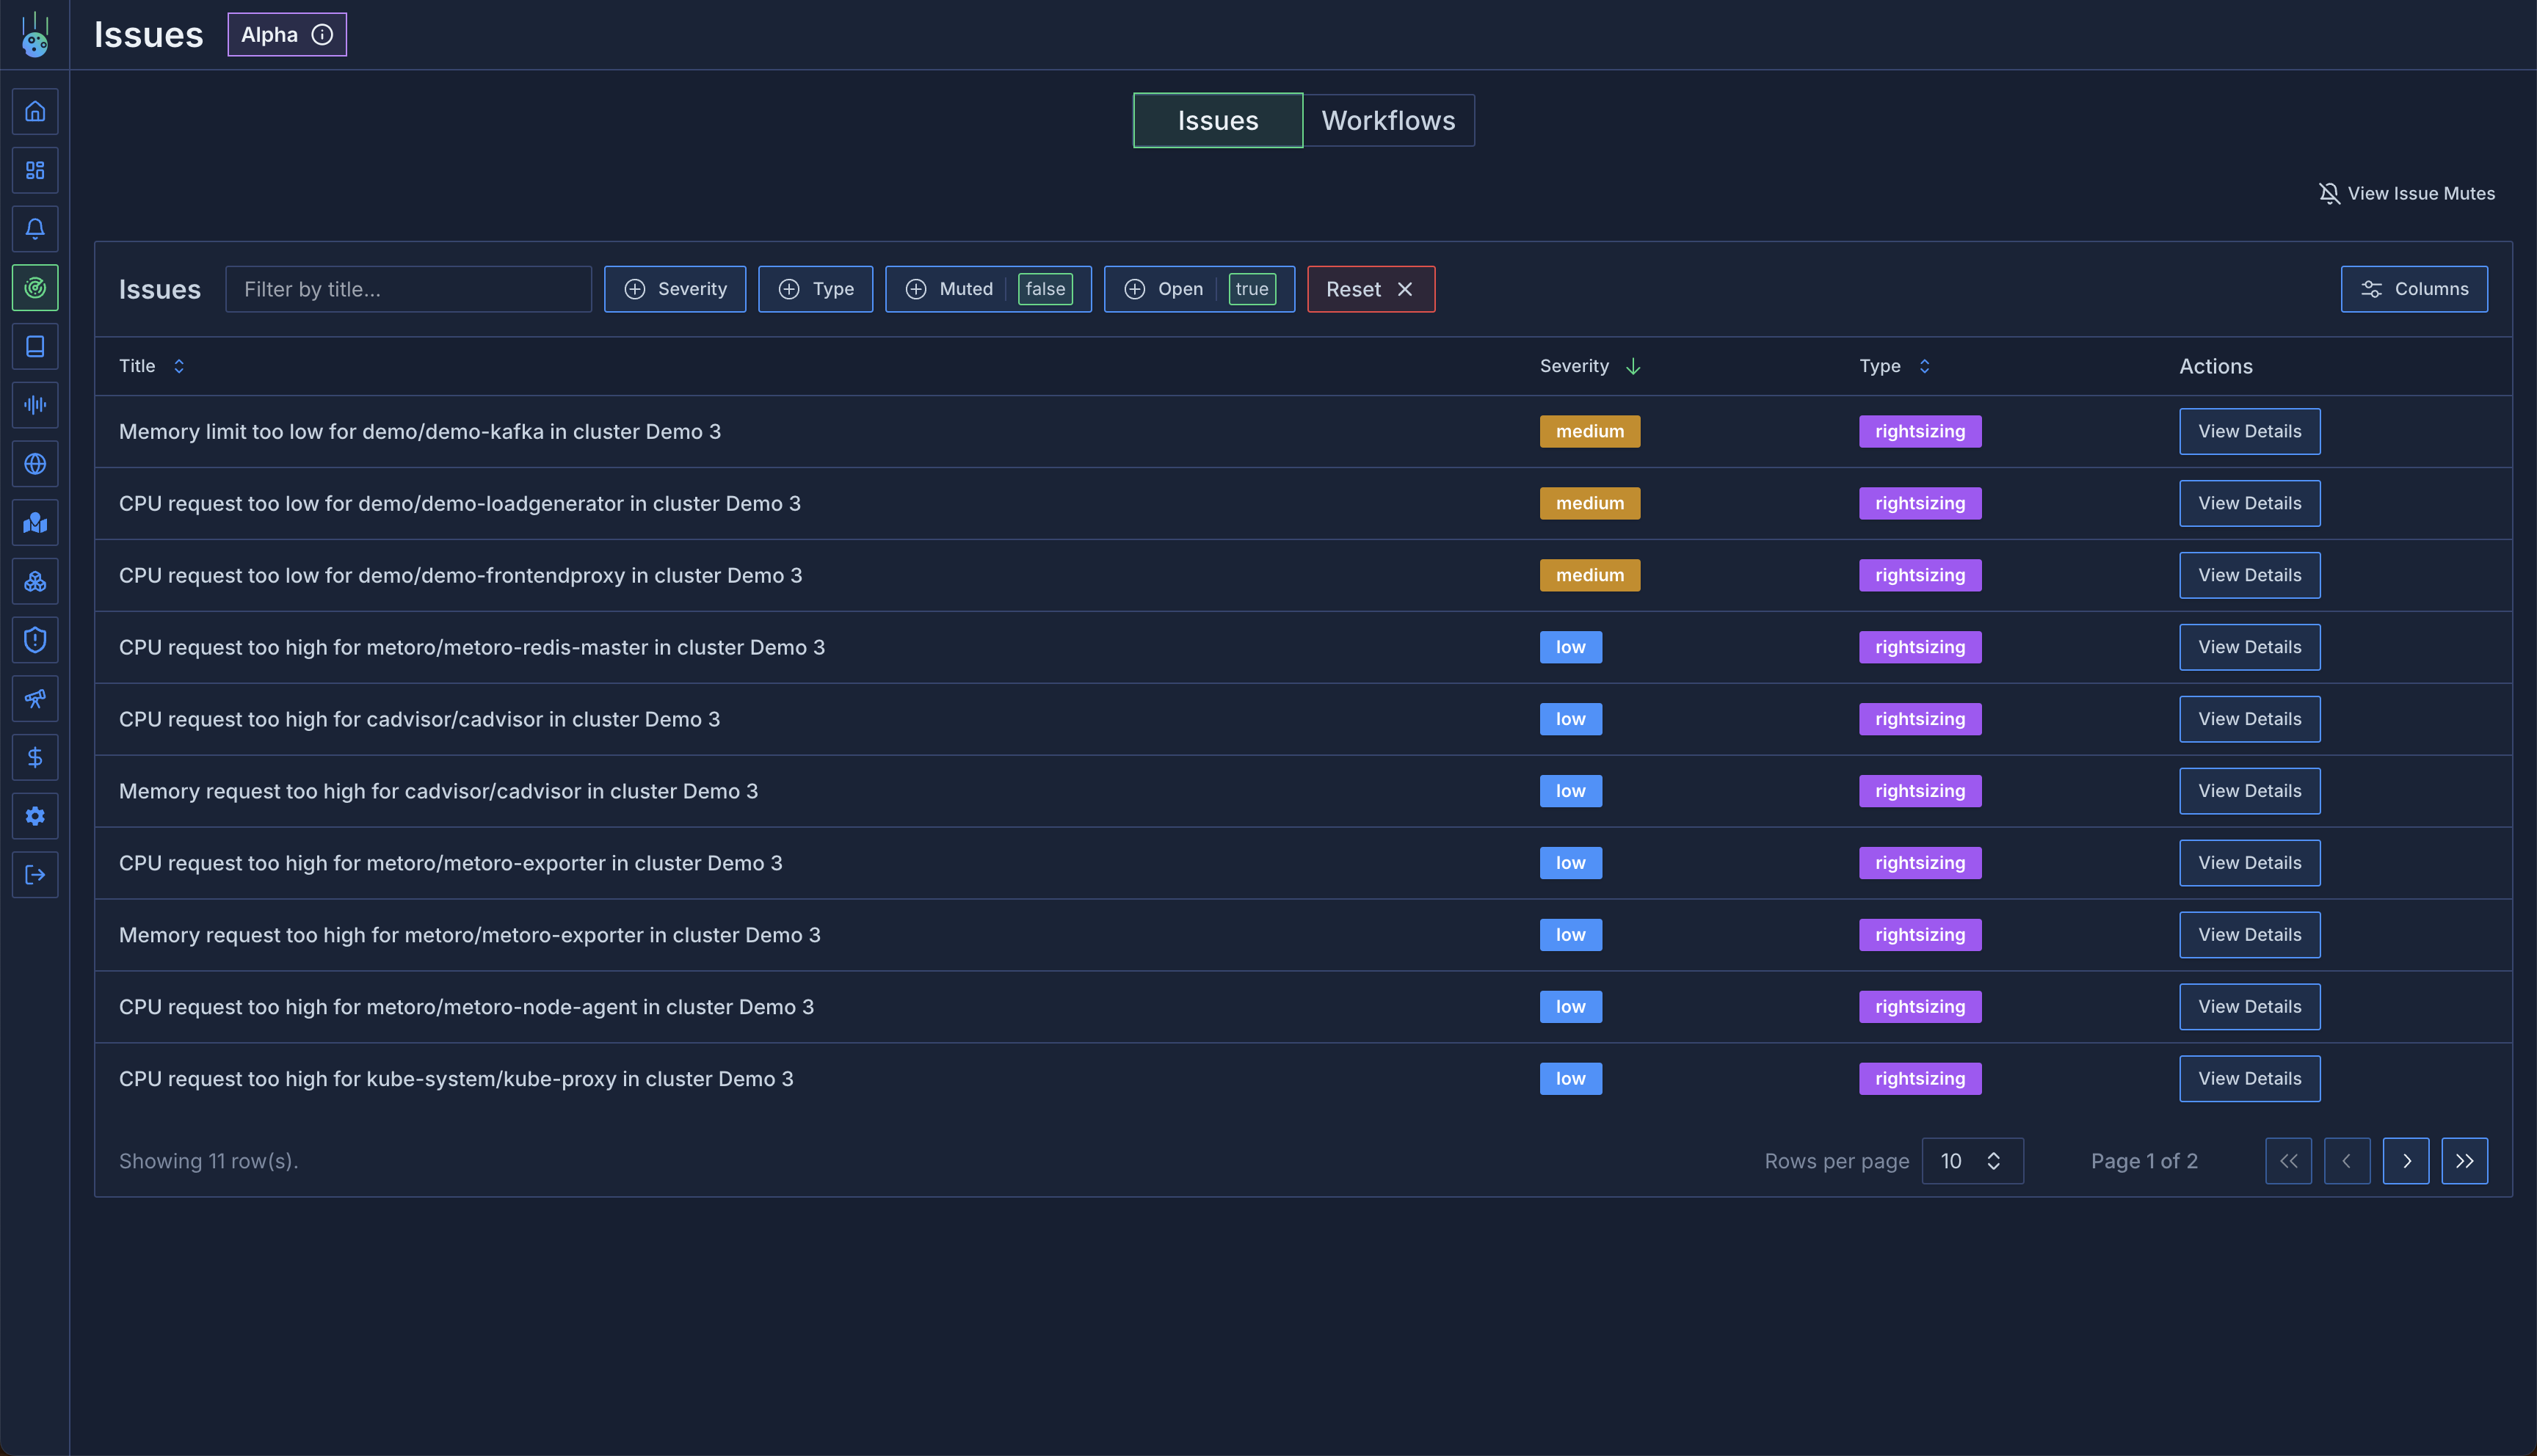 Check out an example [Issues Page](https://demo.us-east.metoro.io/issues?startEnd=\&service=)
### Issues Details
When clicking into an issue, you can view the data that the workflow used to detect it and a number of related metrics.
Check out an example [Issues Page](https://demo.us-east.metoro.io/issues?startEnd=\&service=)
### Issues Details
When clicking into an issue, you can view the data that the workflow used to detect it and a number of related metrics.
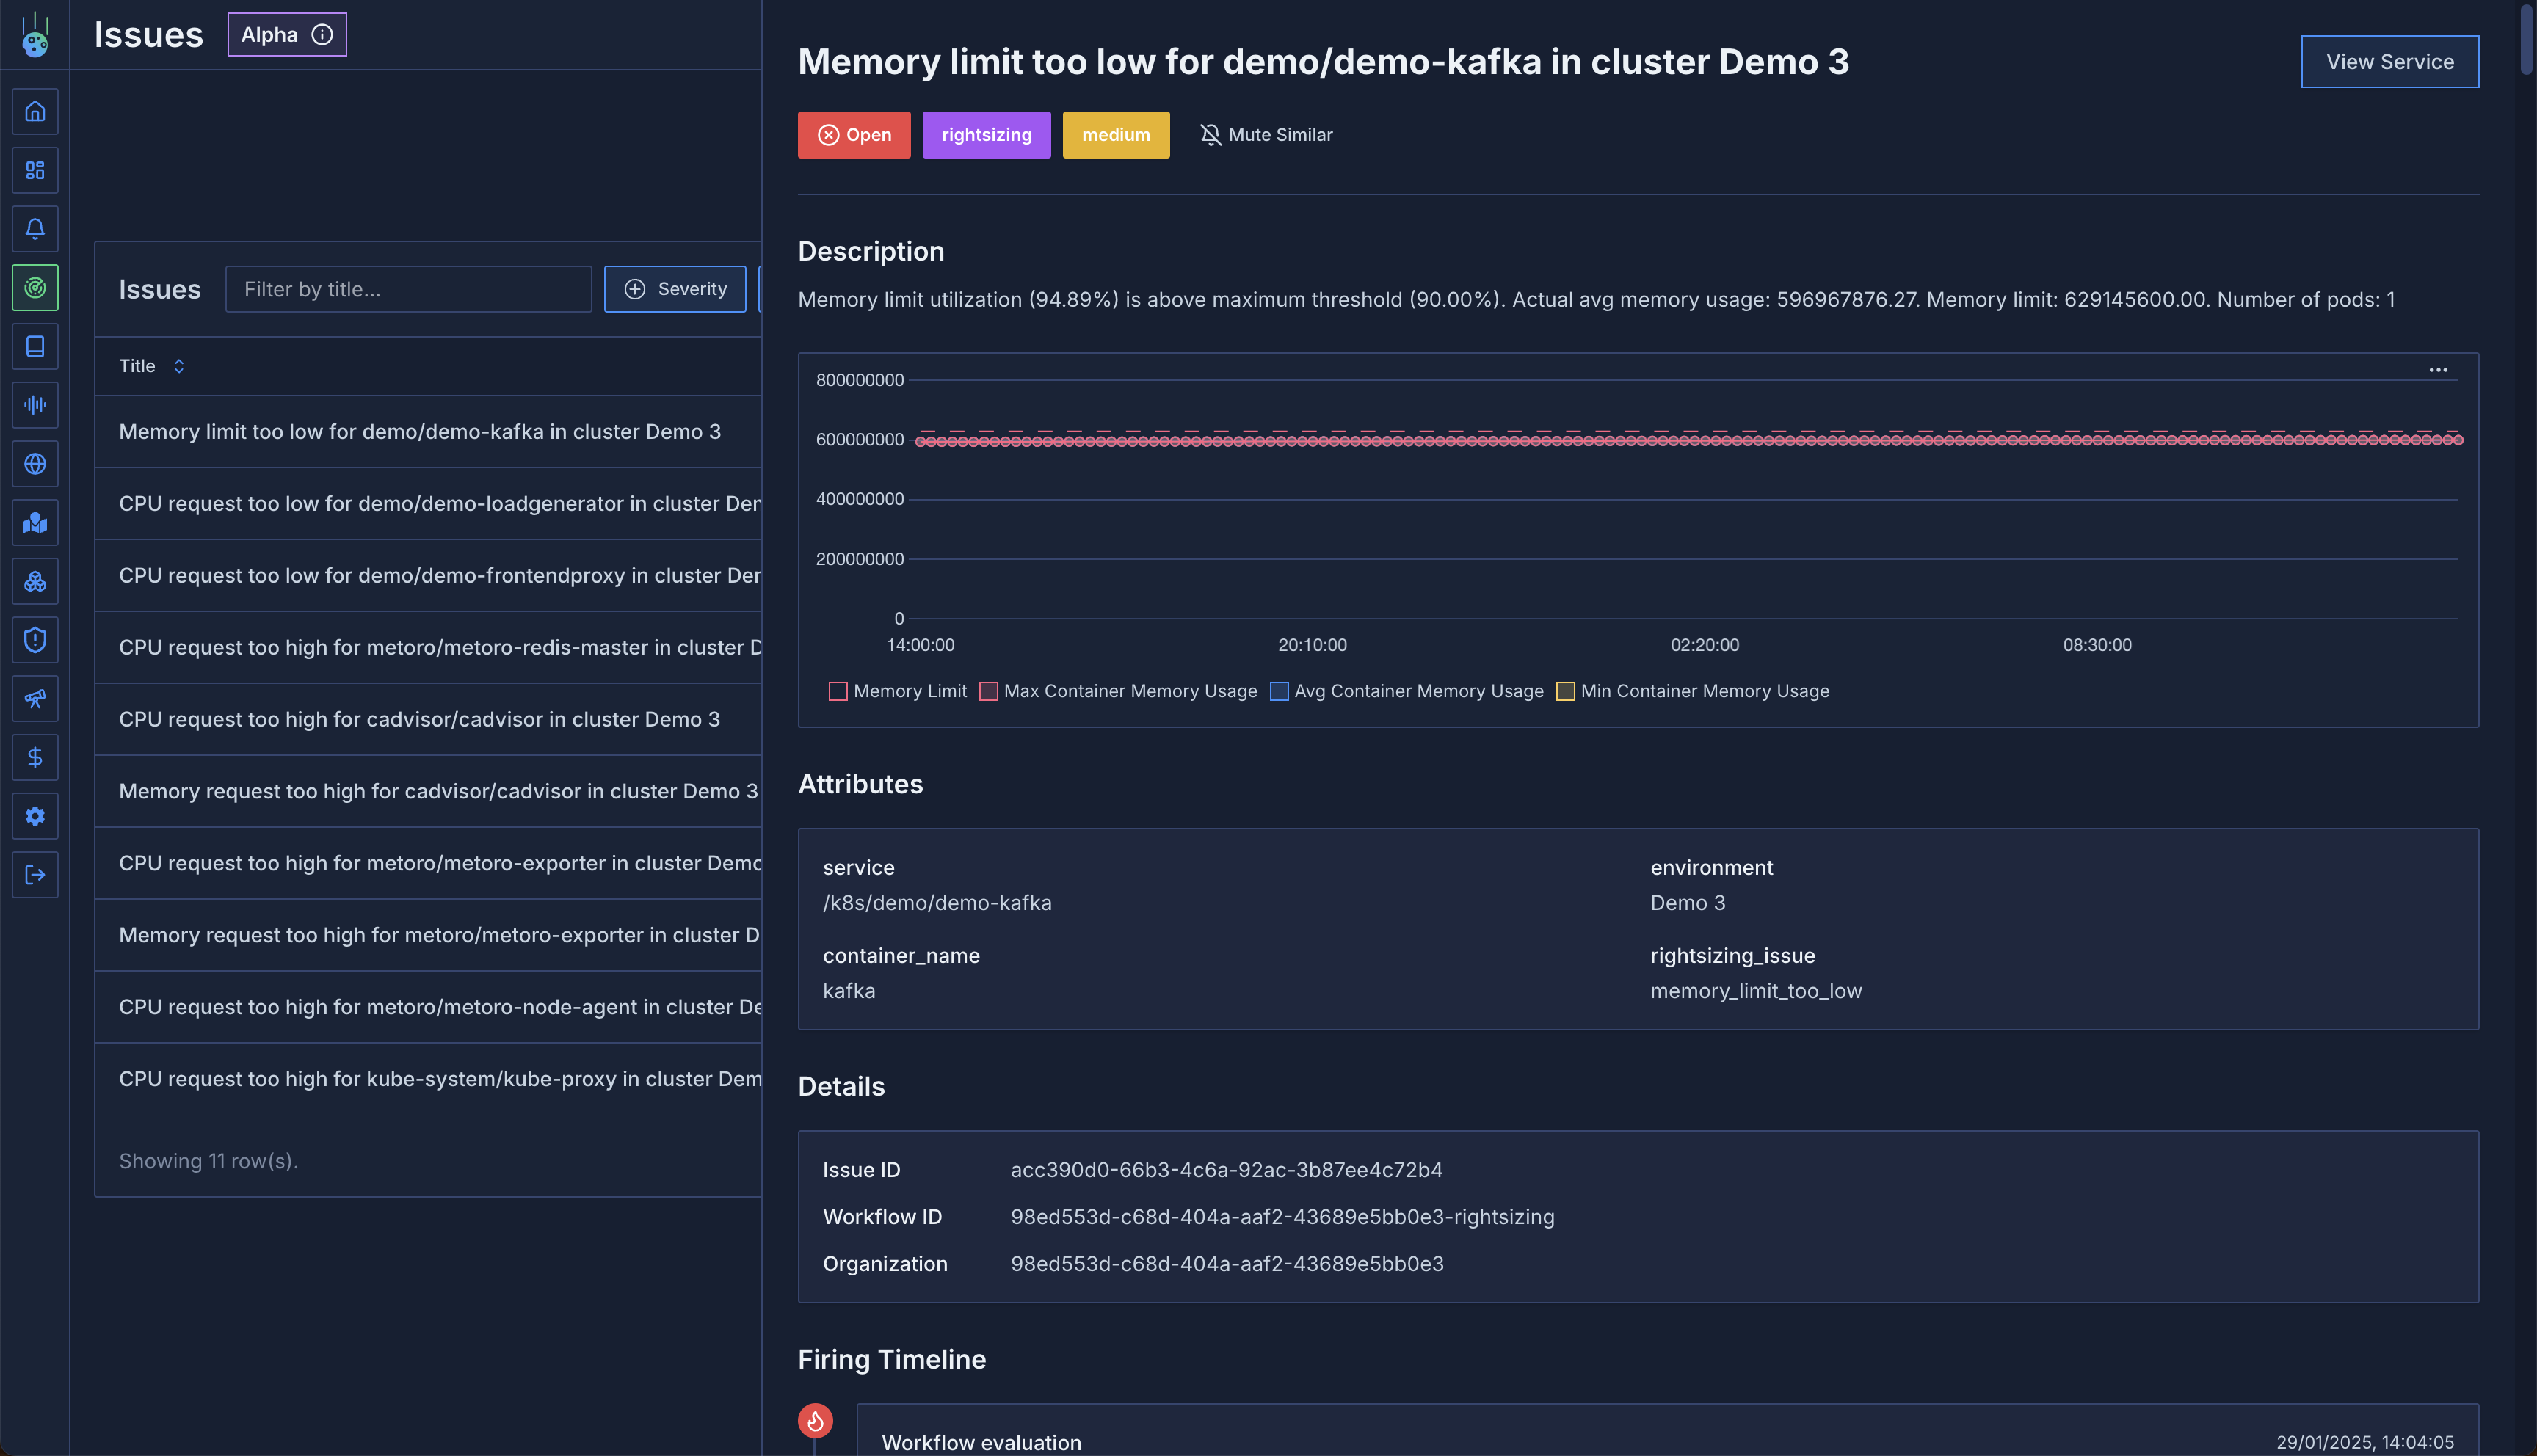 In addition to the basic issue information, there's also a timeline view of all workflow runs that fired for this issue.
This allows you to spot recurrences and patterns.
In addition to the basic issue information, there's also a timeline view of all workflow runs that fired for this issue.
This allows you to spot recurrences and patterns.
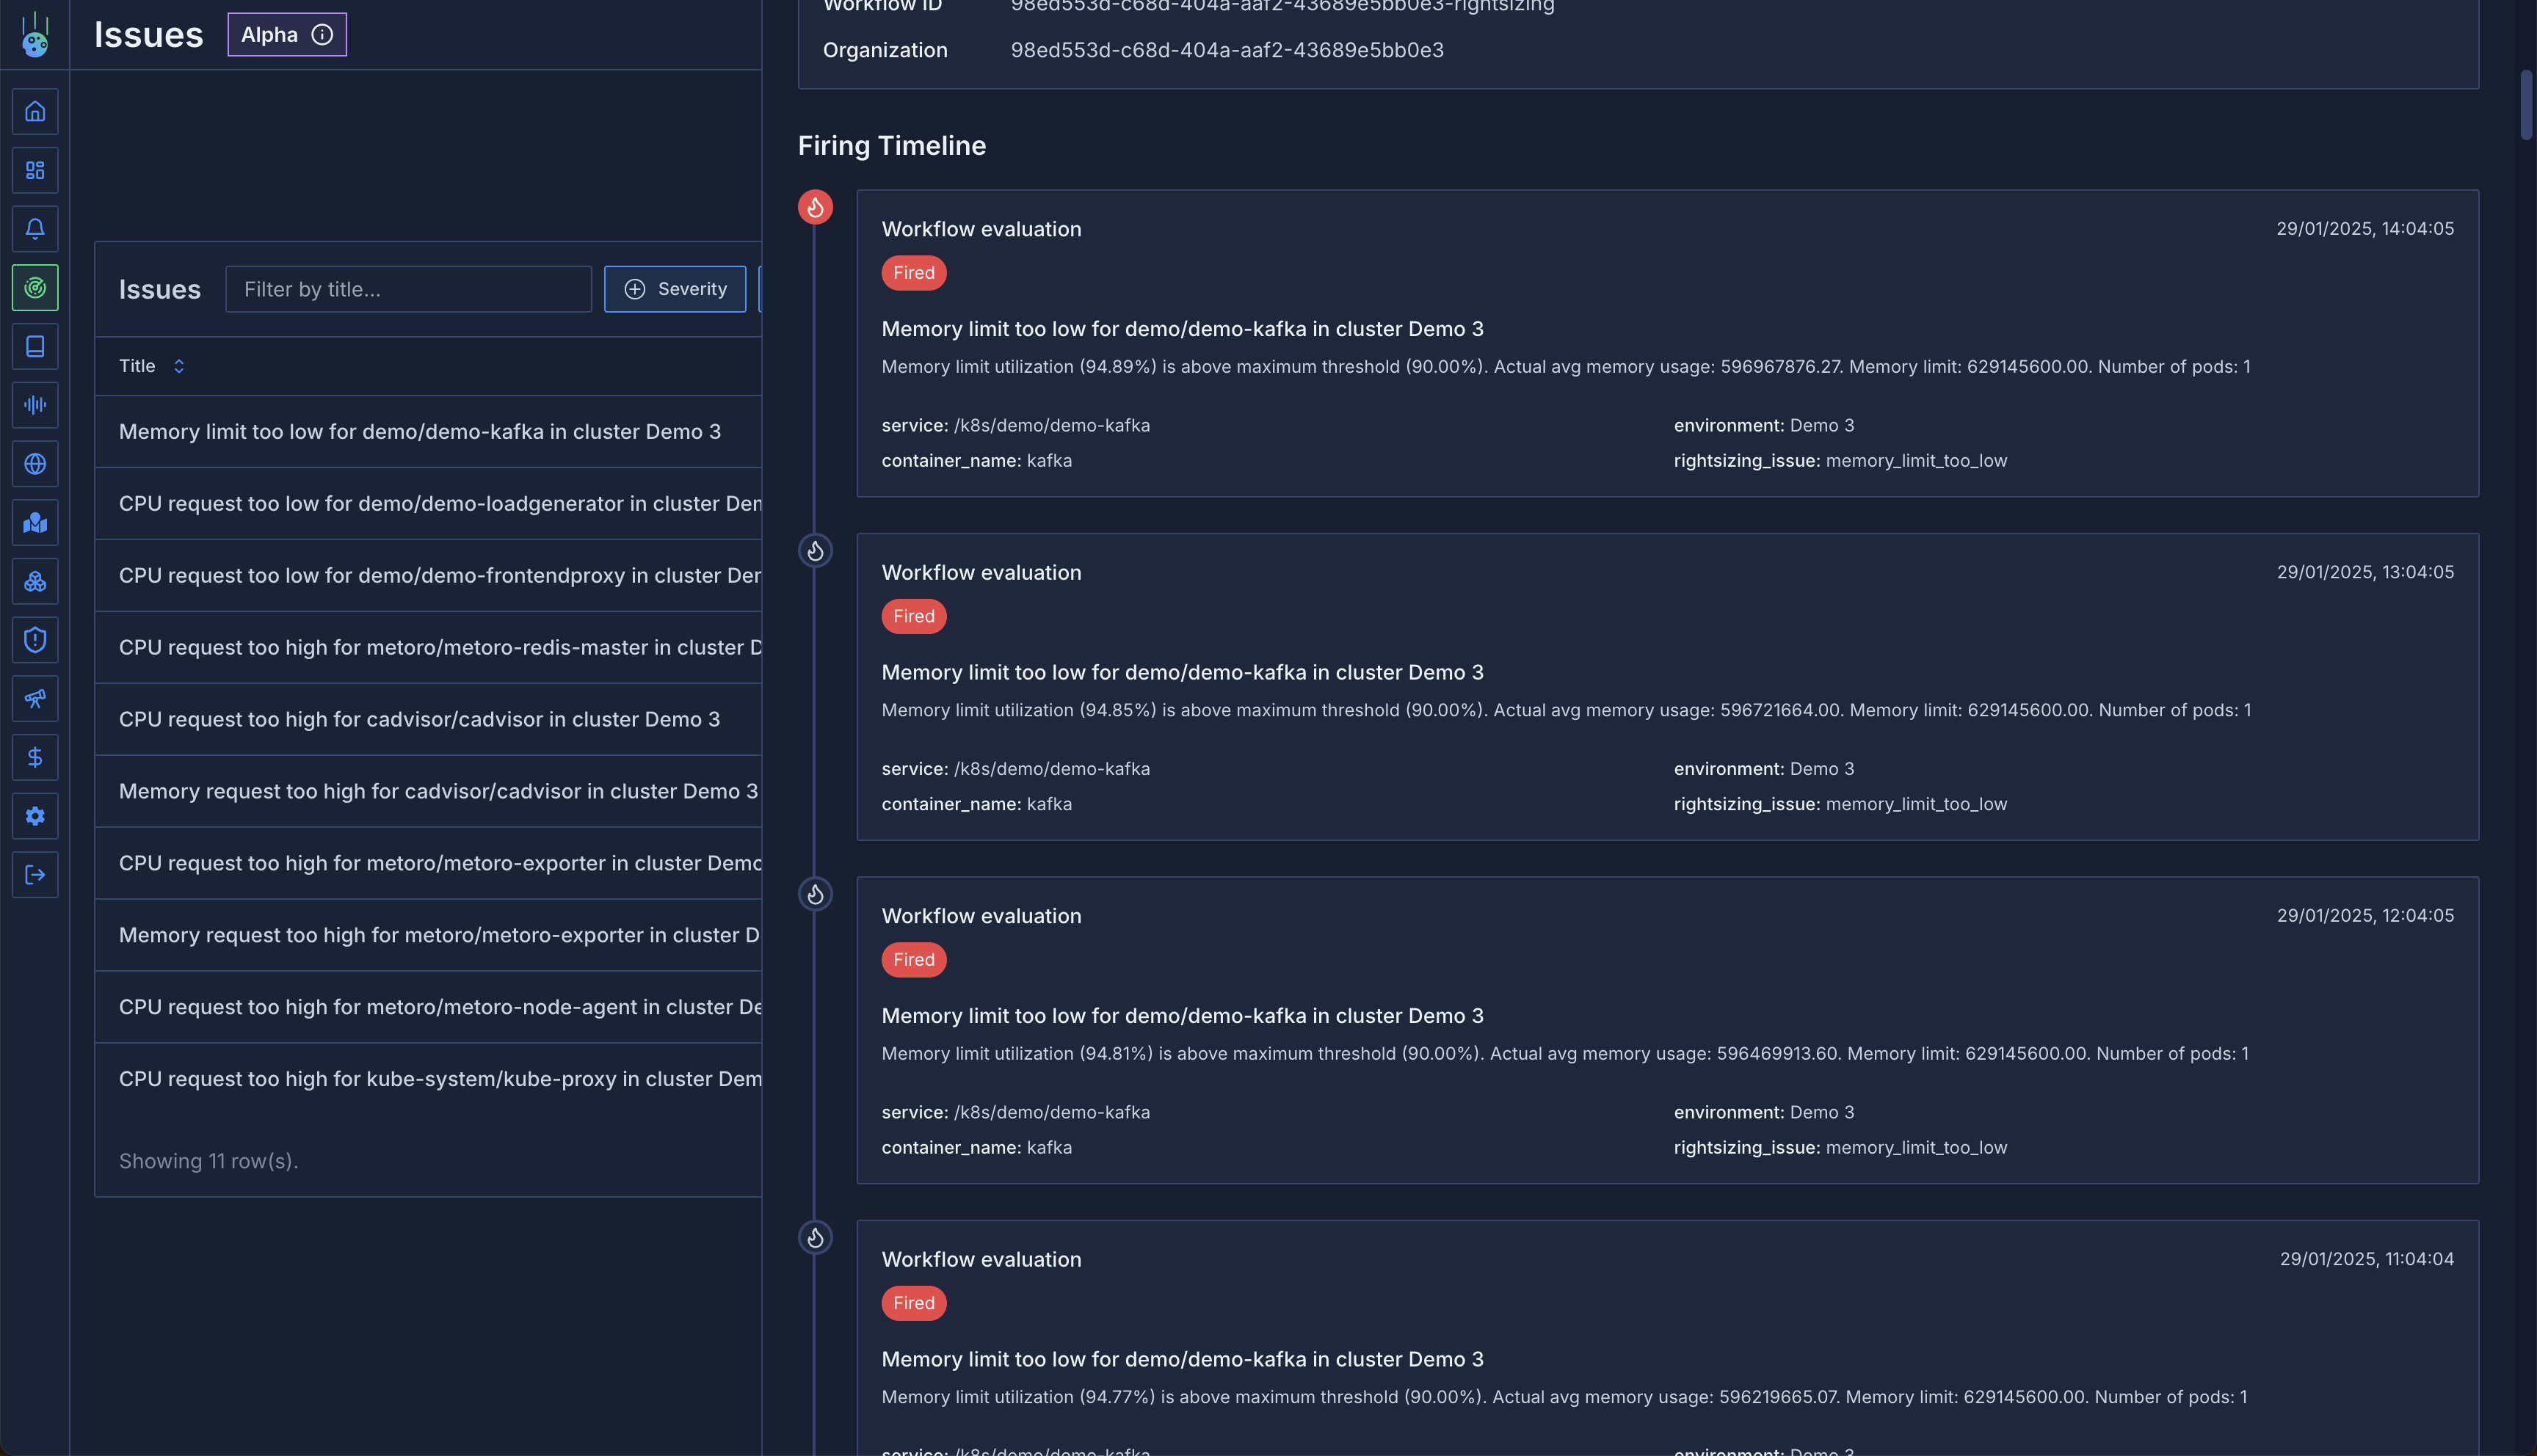 ### Workflow Configuration
Workflows come with sensible defaults, but you can adjust them to match your needs through workflow settings.
### Workflow Configuration
Workflows come with sensible defaults, but you can adjust them to match your needs through workflow settings.
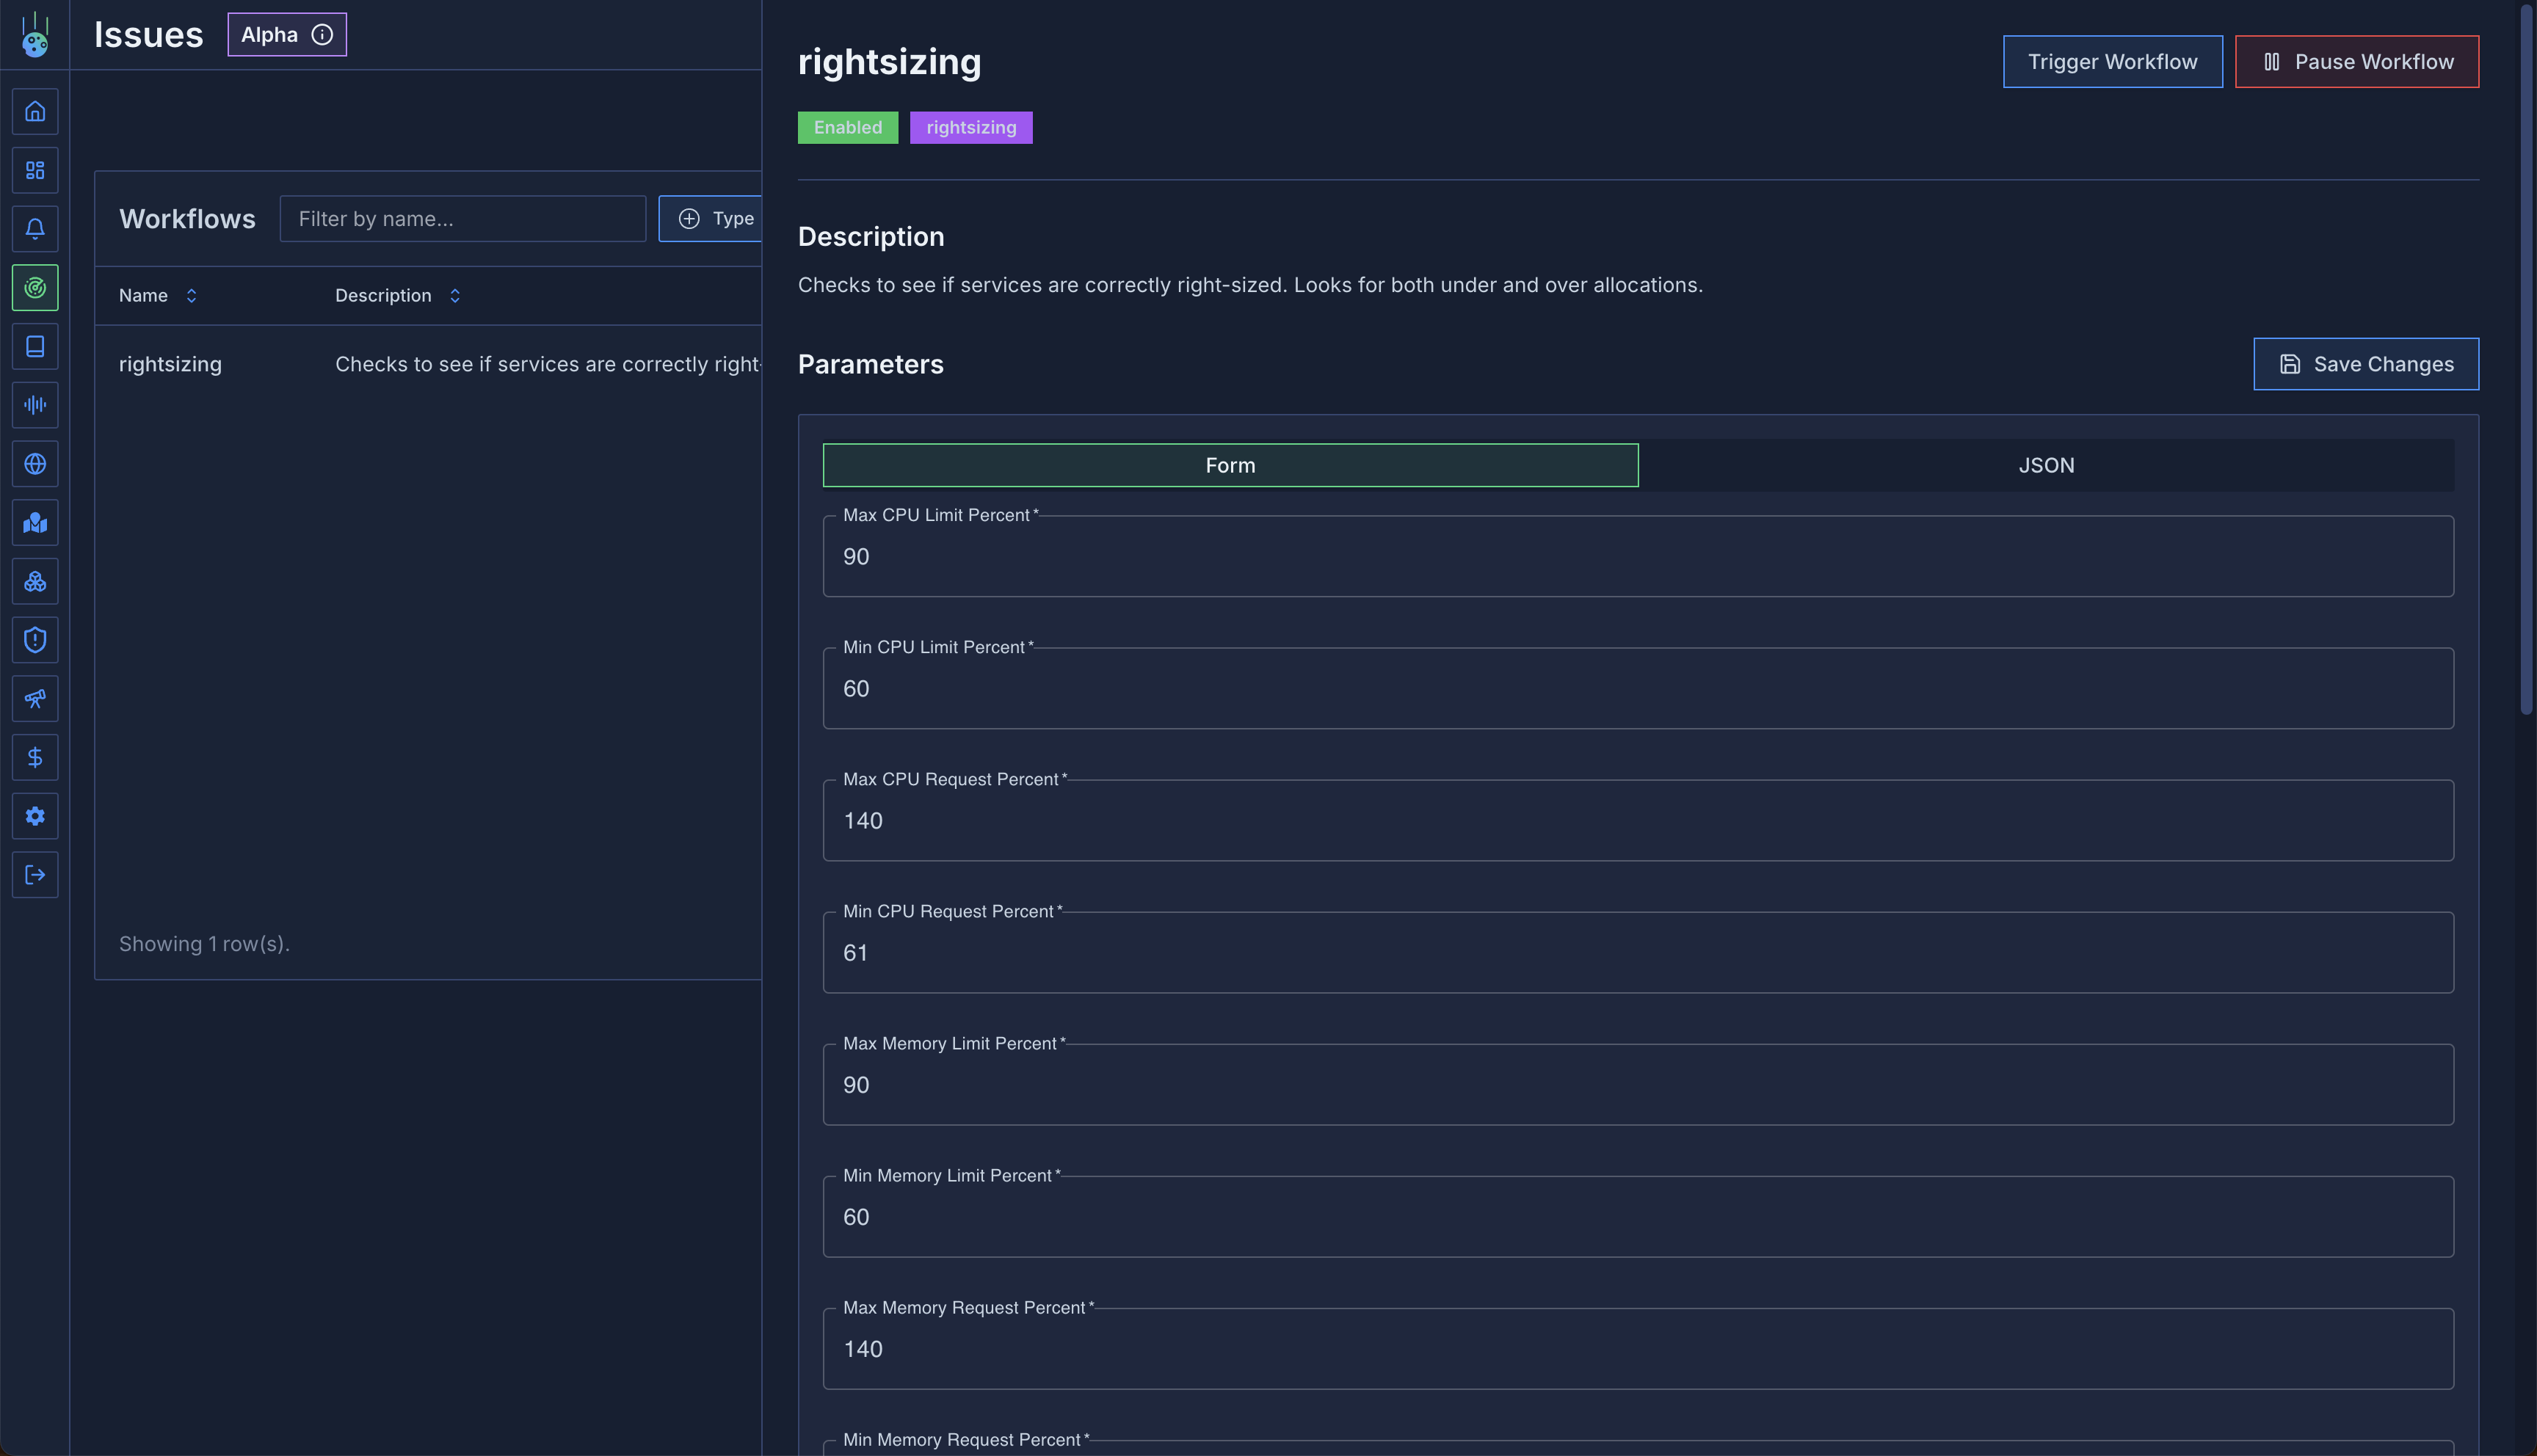 ### Issue Muting
Control which issues you want to track:
1. Find an example issue
2. Click "Mute Similar"
3. Select attributes to mute (e.g., development environment)
4. Apply mute rule
This is particularly useful for:
* Development environments with expected low utilization
* Known exceptions to standard rules
* Temporary suppressions during maintenance
### Issue Muting
Control which issues you want to track:
1. Find an example issue
2. Click "Mute Similar"
3. Select attributes to mute (e.g., development environment)
4. Apply mute rule
This is particularly useful for:
* Development environments with expected low utilization
* Known exceptions to standard rules
* Temporary suppressions during maintenance
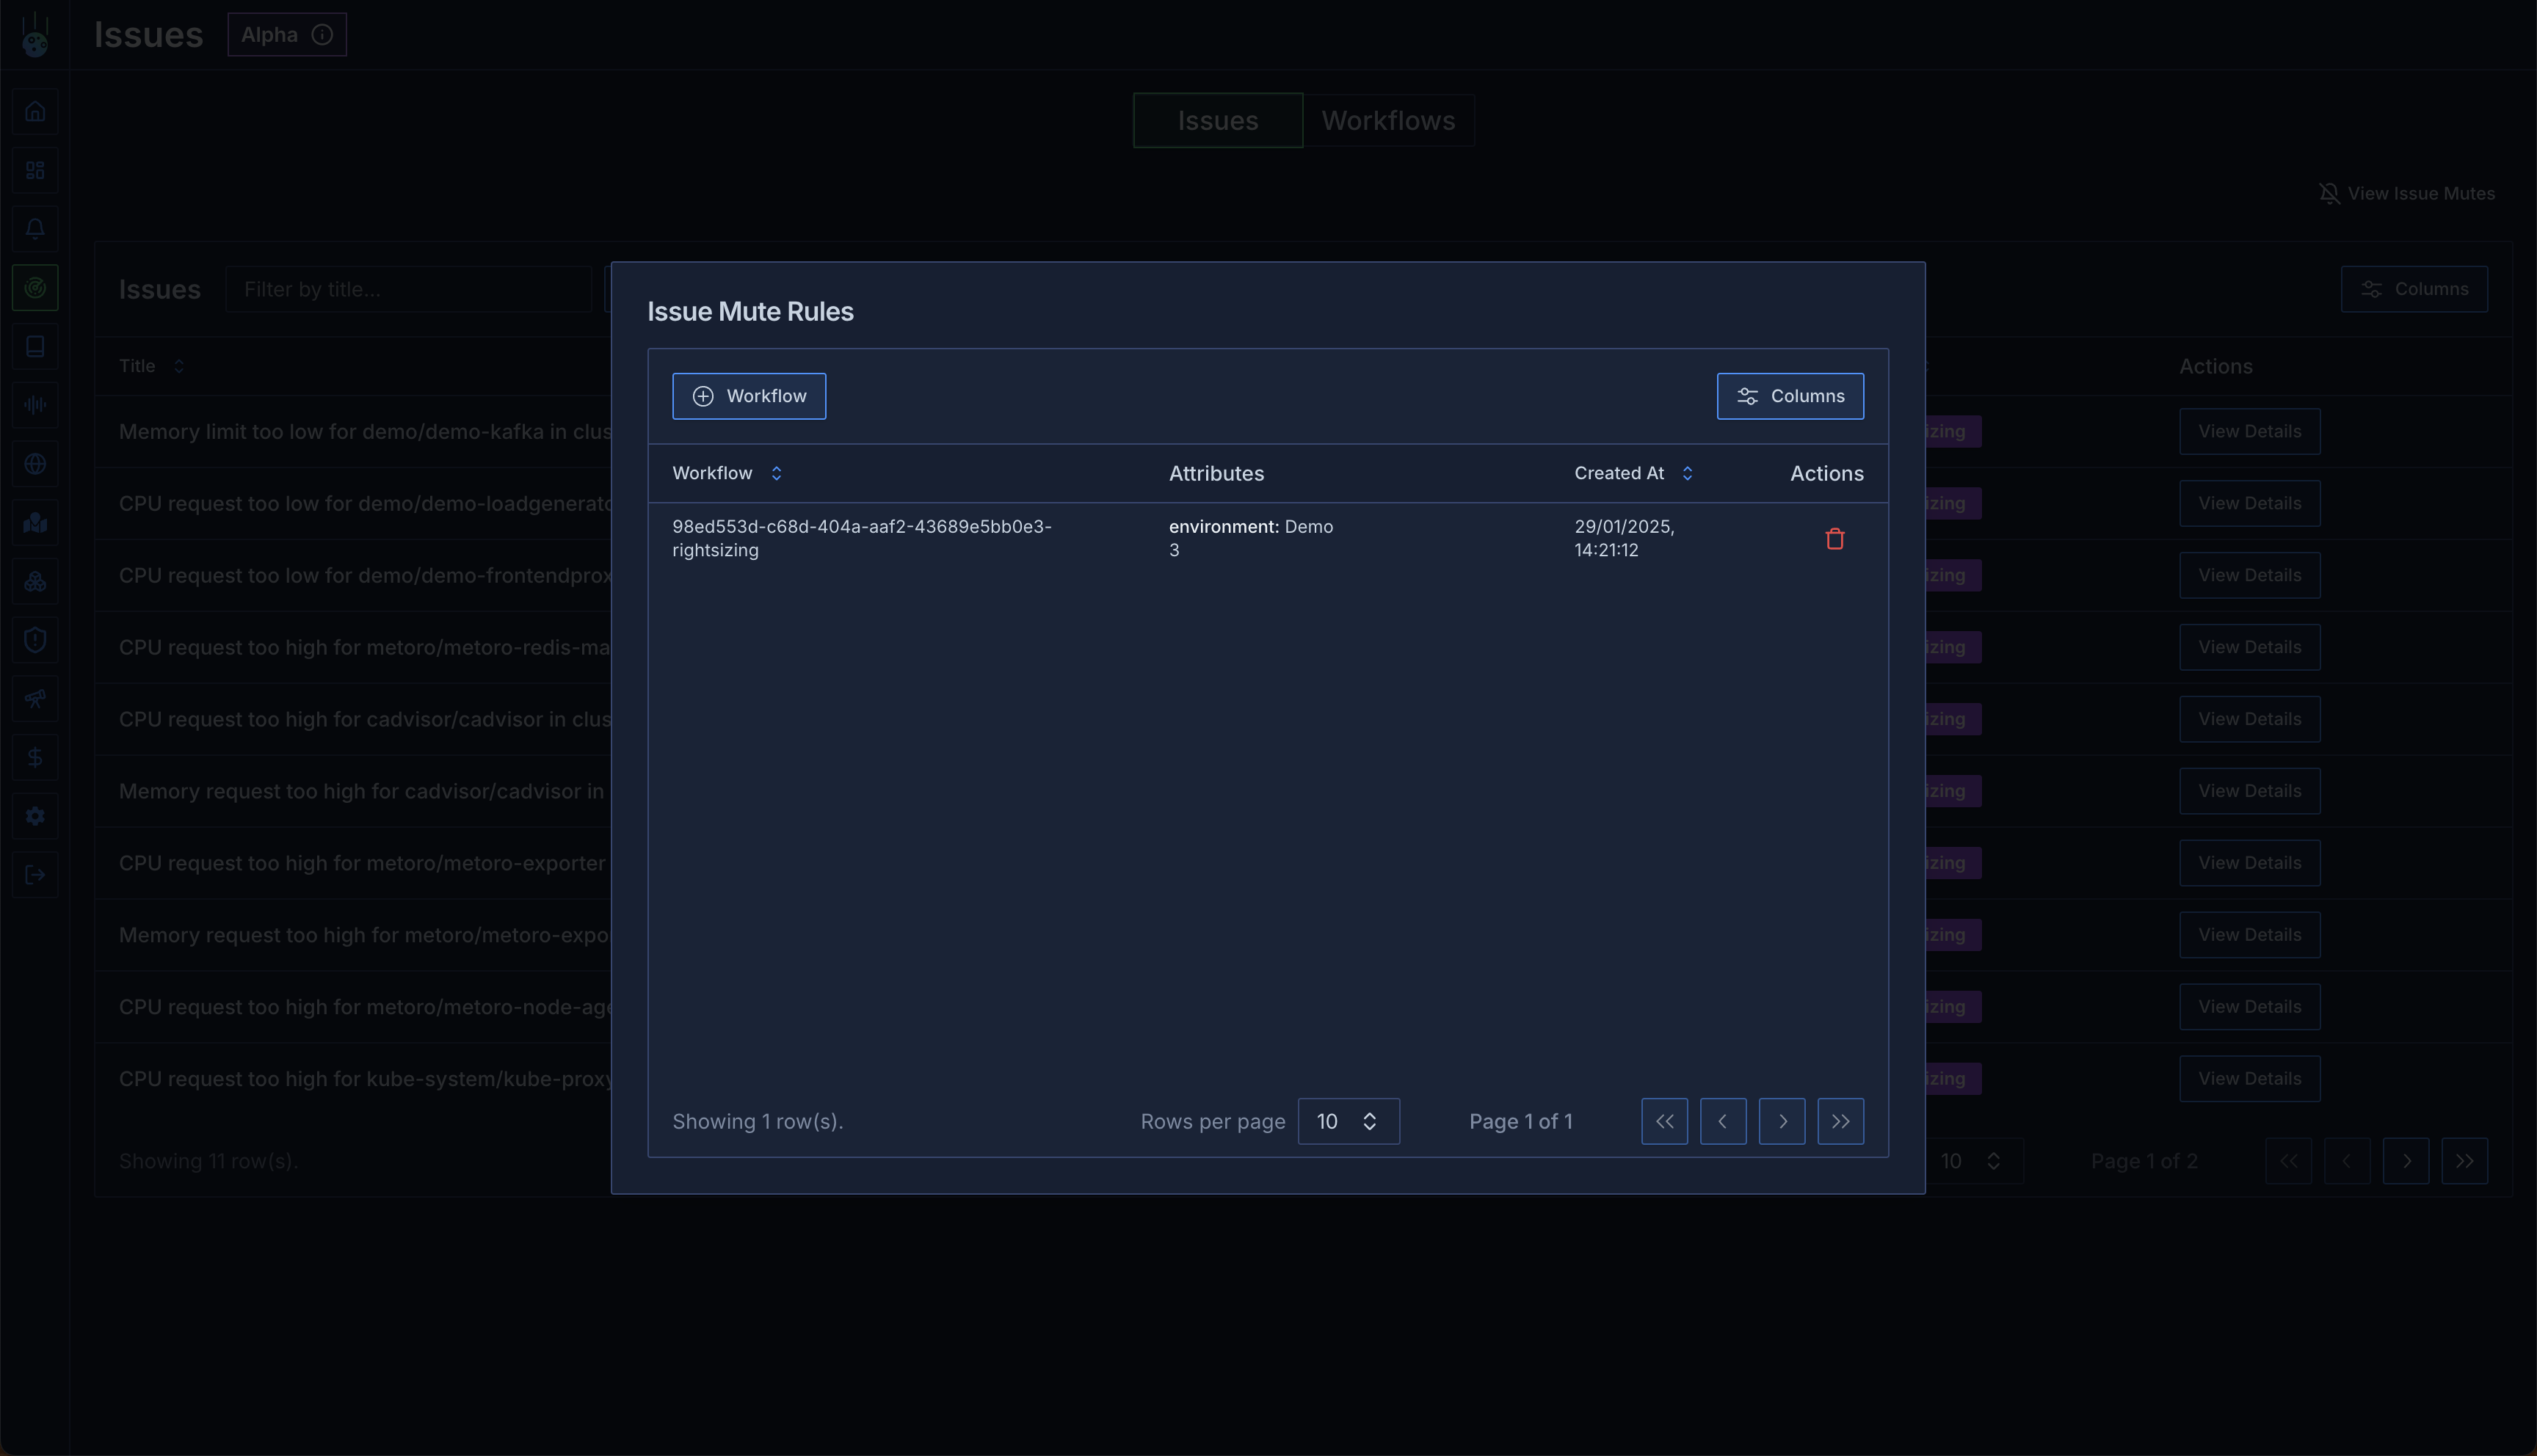 # Right-Sizing Workflow
Source: https://metoro.io/docs/issue-detection/right-sizing
Optimize your resource allocation with automated right-sizing recommendations
## Overview
The right-sizing workflow creates issues when services are over-provisioned or under-provisioned, or when limits are misconfigured.
For each service, the workflow compares actual usage to predefined efficiency parameters and generates issues accordingly.
## Parameters
The right-sizing workflow comes with default parameters that can be customized through the workflow UI.
```json
{
"maxCPULimitPercent": 90,
"minCPULimitPercent": 60,
"maxCPURequestPercent": 140,
"minCPURequestPercent": 61,
"maxMemoryLimitPercent": 90,
"minMemoryLimitPercent": 60,
"maxMemoryRequestPercent": 140,
"minMemoryRequestPercent": 60,
"minNumberOfCoreSavingsToCreateIssue": 0.1,
"minNumberOfBytesSavingsToCreateIssue": 1073741824
}
```
## Issue Types
The workflow can generate several types of issues:
1. **cpu\_request\_too\_high**:
* Low severity
* Indicates resource waste
* Includes potential cost savings estimates
2. **cpu\_request\_too\_low**:
* Medium severity
* Risk of performance impact
* May indicate CPU throttling or memory pressure
3. **cpu\_limit\_too\_low**:
* Medium severity
* Risk of performance impact
* May indicate CPU throttling
4. **memory\_request\_too\_high**:
* Low severity
* Indicates resource waste
* Includes potential cost savings estimates
5. **memory\_request\_too\_low**:
* Medium severity
* Risk of performance impact
* May indicate memory pressure
6. **memory\_limit\_too\_low**:
* Medium severity
* Risk of performance impact
* May indicate memory pressure
# Kubernetes Events
Source: https://metoro.io/docs/kubernetes-resources/kubernetes-events
Long-term storage and analysis of Kubernetes cluster events
## Overview
Unlike standard Kubernetes clusters where events are ephemeral and typically expire after an hour, Metoro provides permanent storage and analysis of all Kubernetes events. This allows you to track, analyze, and debug cluster activities over extended periods.
## Event Storage
Key features of Metoro's event storage:
* **Permanent Storage**: Events are retained for the full retention period
* **Complete History**: Records creation, updates, and deletion of events
* **Service Association**: Events are automatically linked to relevant services
* **Cross-Cluster View**: View events across all your clusters in one place
## Event Attributes
Each event in Metoro contains rich metadata:
* **Type**: Warning or Informational
* **Resource Name**: The affected resource
* **Service Name**: Associated service (Metoro-specific enhancement)
* **Reason**: The event trigger
* **Message**: Detailed event description
* **Namespace**: The involved object's namespace
* **Object Kind**: The type of resource involved
* **Reporting Component**: Source component (e.g., Horizontal Pod Autoscaler)
* **Count**: Number of times the event has occurred
Metoro enhances standard Kubernetes events by automatically associating them with services. For example, if an event
involves a pod within a deployment that's part of a service, the event will be linked to that service.
## Viewing Events
### Global Events View
Access the dedicated Kubernetes events view to:
* See events across all clusters
* Filter by any event attribute
* Search event messages using regex
* Track event frequency and patterns
# Right-Sizing Workflow
Source: https://metoro.io/docs/issue-detection/right-sizing
Optimize your resource allocation with automated right-sizing recommendations
## Overview
The right-sizing workflow creates issues when services are over-provisioned or under-provisioned, or when limits are misconfigured.
For each service, the workflow compares actual usage to predefined efficiency parameters and generates issues accordingly.
## Parameters
The right-sizing workflow comes with default parameters that can be customized through the workflow UI.
```json
{
"maxCPULimitPercent": 90,
"minCPULimitPercent": 60,
"maxCPURequestPercent": 140,
"minCPURequestPercent": 61,
"maxMemoryLimitPercent": 90,
"minMemoryLimitPercent": 60,
"maxMemoryRequestPercent": 140,
"minMemoryRequestPercent": 60,
"minNumberOfCoreSavingsToCreateIssue": 0.1,
"minNumberOfBytesSavingsToCreateIssue": 1073741824
}
```
## Issue Types
The workflow can generate several types of issues:
1. **cpu\_request\_too\_high**:
* Low severity
* Indicates resource waste
* Includes potential cost savings estimates
2. **cpu\_request\_too\_low**:
* Medium severity
* Risk of performance impact
* May indicate CPU throttling or memory pressure
3. **cpu\_limit\_too\_low**:
* Medium severity
* Risk of performance impact
* May indicate CPU throttling
4. **memory\_request\_too\_high**:
* Low severity
* Indicates resource waste
* Includes potential cost savings estimates
5. **memory\_request\_too\_low**:
* Medium severity
* Risk of performance impact
* May indicate memory pressure
6. **memory\_limit\_too\_low**:
* Medium severity
* Risk of performance impact
* May indicate memory pressure
# Kubernetes Events
Source: https://metoro.io/docs/kubernetes-resources/kubernetes-events
Long-term storage and analysis of Kubernetes cluster events
## Overview
Unlike standard Kubernetes clusters where events are ephemeral and typically expire after an hour, Metoro provides permanent storage and analysis of all Kubernetes events. This allows you to track, analyze, and debug cluster activities over extended periods.
## Event Storage
Key features of Metoro's event storage:
* **Permanent Storage**: Events are retained for the full retention period
* **Complete History**: Records creation, updates, and deletion of events
* **Service Association**: Events are automatically linked to relevant services
* **Cross-Cluster View**: View events across all your clusters in one place
## Event Attributes
Each event in Metoro contains rich metadata:
* **Type**: Warning or Informational
* **Resource Name**: The affected resource
* **Service Name**: Associated service (Metoro-specific enhancement)
* **Reason**: The event trigger
* **Message**: Detailed event description
* **Namespace**: The involved object's namespace
* **Object Kind**: The type of resource involved
* **Reporting Component**: Source component (e.g., Horizontal Pod Autoscaler)
* **Count**: Number of times the event has occurred
Metoro enhances standard Kubernetes events by automatically associating them with services. For example, if an event
involves a pod within a deployment that's part of a service, the event will be linked to that service.
## Viewing Events
### Global Events View
Access the dedicated Kubernetes events view to:
* See events across all clusters
* Filter by any event attribute
* Search event messages using regex
* Track event frequency and patterns
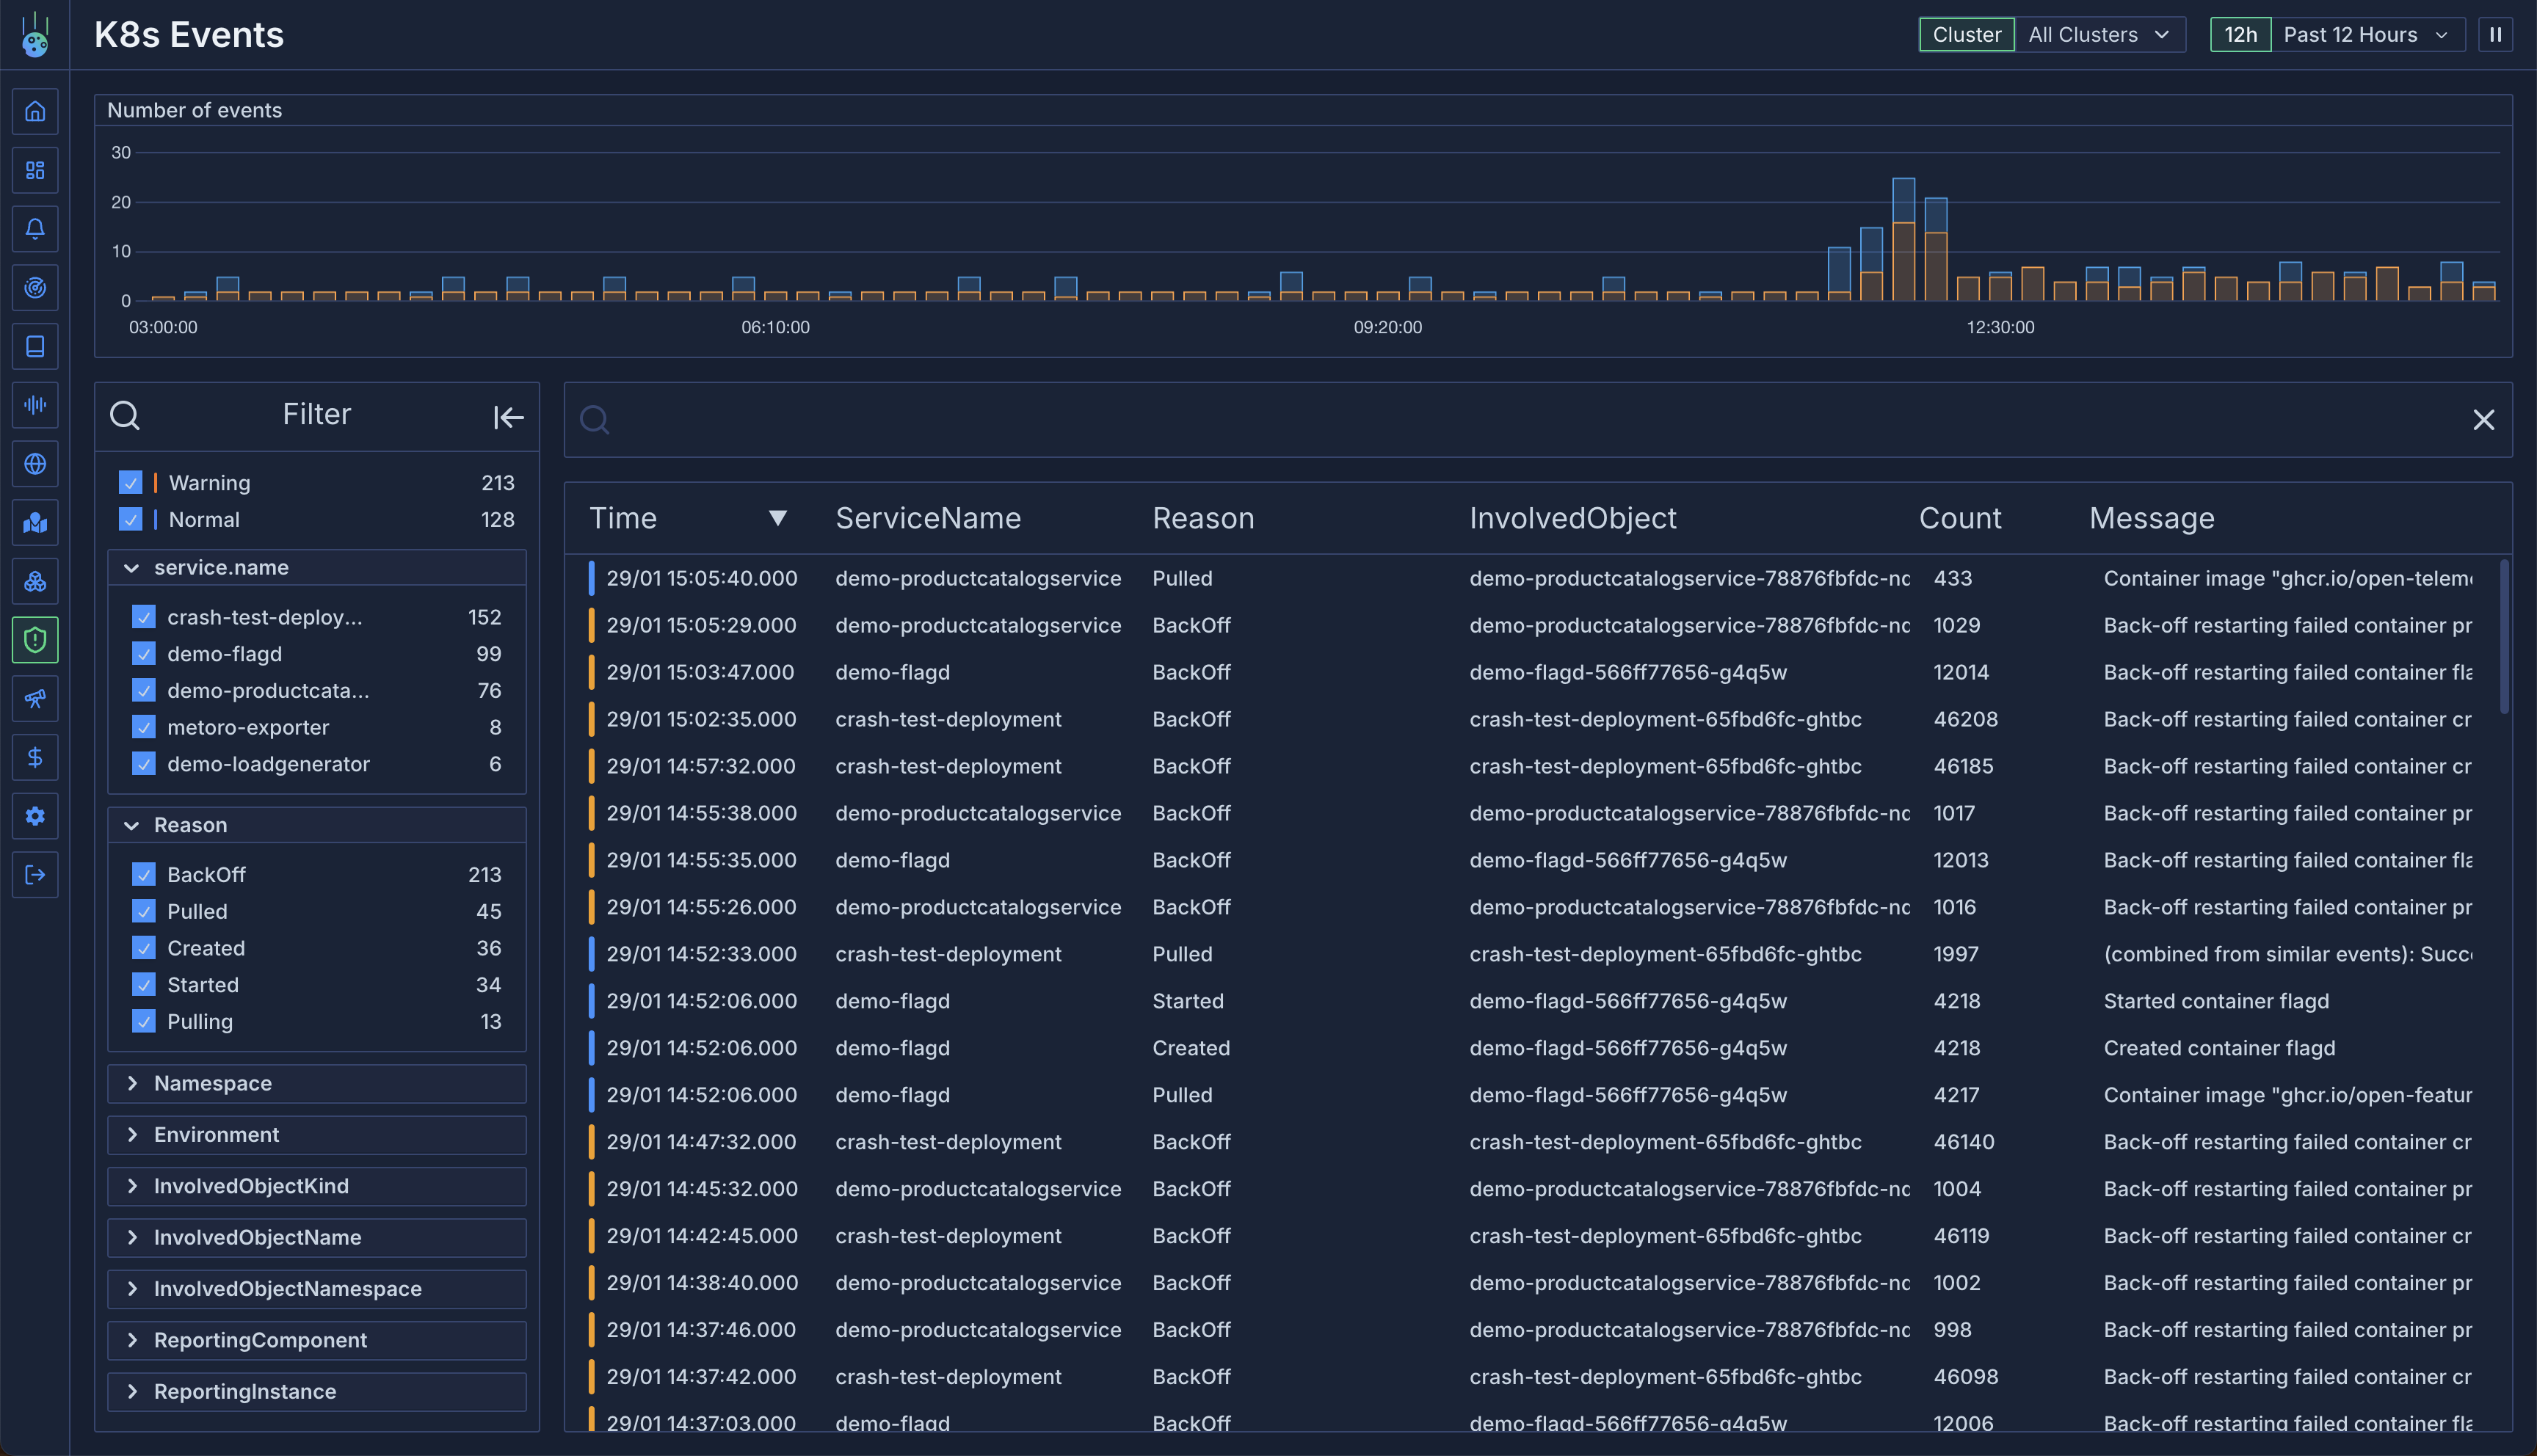 ### Service-Specific Events
View events for specific services:
1. Navigate to a service
2. Open the Events tab
3. View all events associated with the service
### Service-Specific Events
View events for specific services:
1. Navigate to a service
2. Open the Events tab
3. View all events associated with the service
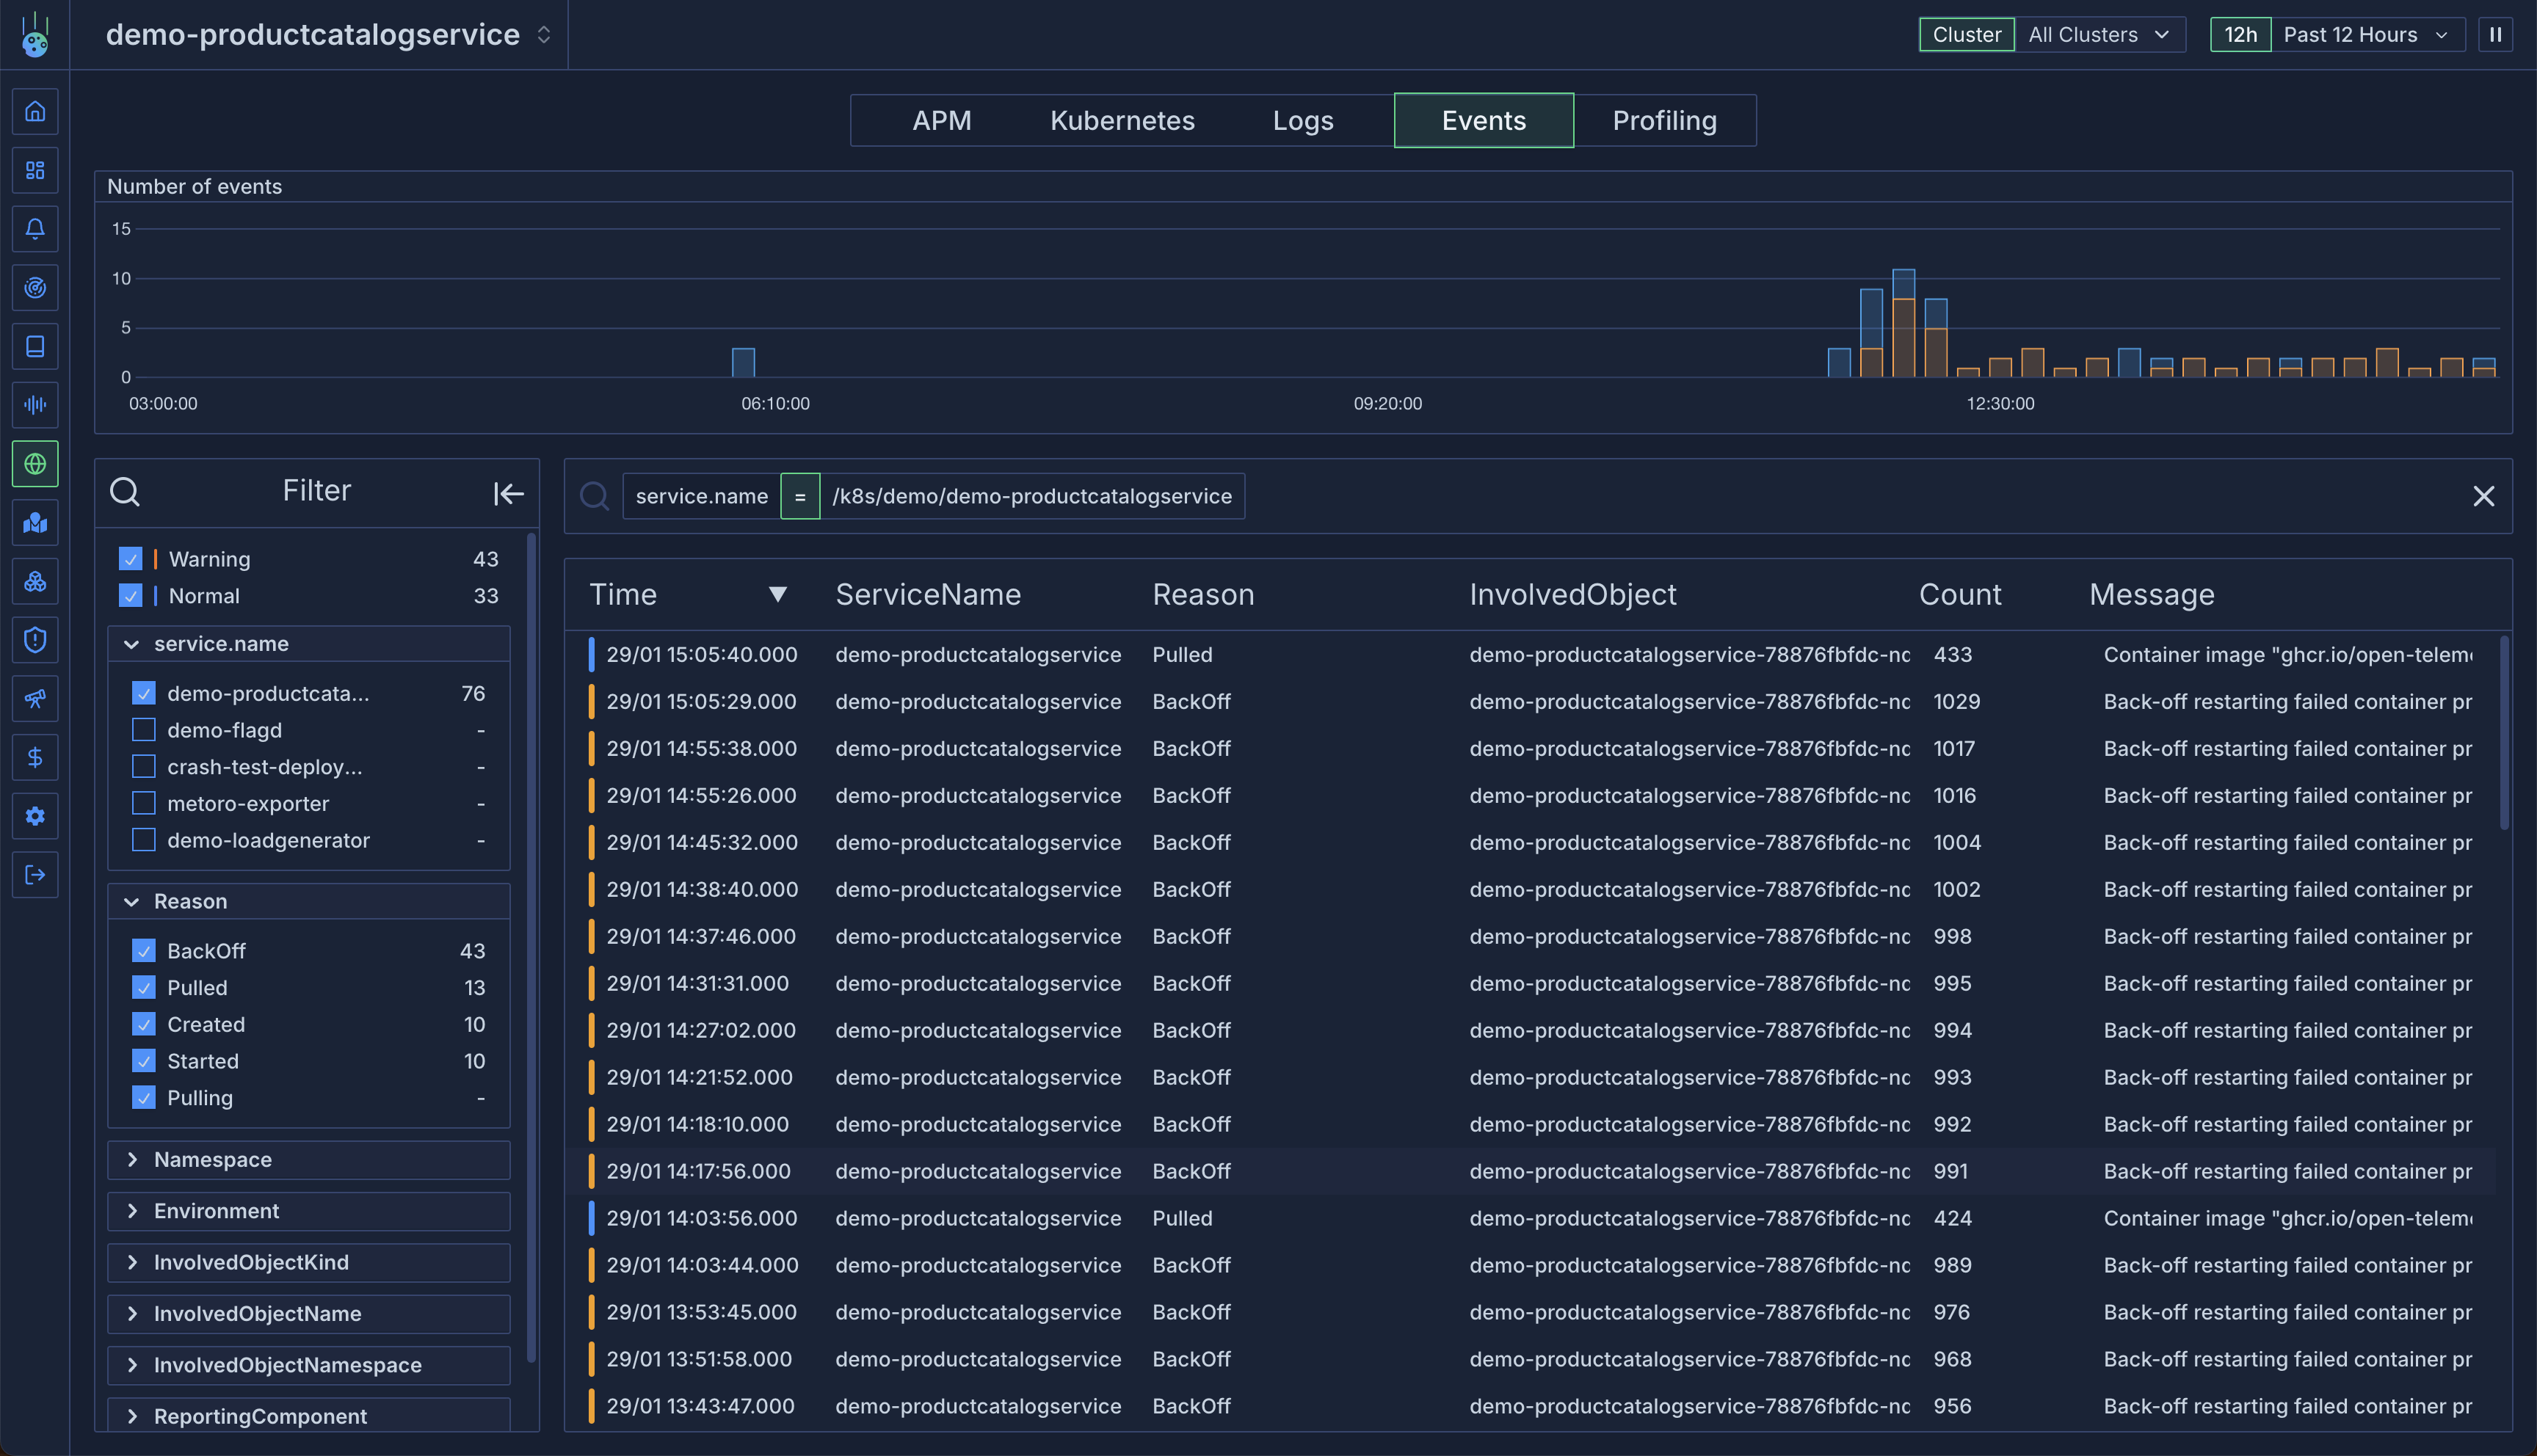 ## Filtering and Search
### Attribute Filtering
Filter events by any attribute:
* Event type (Warning/Informational)
* Service name
* Namespace
* Resource kind
* Reporting component
### Message Search
Use regex search to find specific events:
```
# Find HPA scaling failures
HPAfailed
# Find container crashes
container.*Error
# Find scheduling issues
FailedScheduling
```
## Best Practices
1. **Regular Monitoring**:
* Review warning events daily
* Track event patterns across services
* Monitor high-frequency events
2. **Troubleshooting**:
* Use service association to correlate events
* Combine event data with logs and metrics
* Track event history for recurring issues
3. **Filtering Strategy**:
* Create saved filters for common scenarios
* Use regex for complex pattern matching
* Filter by service for targeted analysis
# Kubernetes Resources
Source: https://metoro.io/docs/kubernetes-resources/kubernetes-resources
Track and analyze Kubernetes resource changes over time
## Overview
Metoro provides comprehensive tracking of Kubernetes resources, capturing every update to give you a complete history of your cluster's state. This "time-travel" capability allows you to view your cluster's state at any point in time, not just its current state.
## Resource Tracking
The cluster agent watches and exports the following Kubernetes resources:
* Pods
* Deployments
* StatefulSets
* ReplicaSets
* DaemonSets
* Nodes
* ConfigMaps
* Services
* Jobs
* CronJobs
* Endpoints
* Events
* Horizontal Pod Autoscalers
* Ingresses
* Namespaces
Metoro explicitly does not export secrets. If you have resources you want to exclude from exporting, you can remove
them from the service account permissions given to the cluster agent.
See the permissions
[here](https://github.com/Chrisbattarbee/metoro-helm-charts/blob/62b809debce64758c2995b9feb988f37aca87bff/charts/metoro-exporter/templates/exporter_service_account.yaml#L10).
## Resource Metrics
Kubernetes resources can be analyzed using the `kubernetes_resource` metric type. This allows you to:
### Count Resources
Track the number of resources by various attributes:
```sql
# Count pods by service
kubernetes_resource{kind="Pod"}
| group_by(service_name)
# Count resources by namespace
kubernetes_resource{kind="Deployment"}
| group_by(namespace)
```
### Resource Attributes
Common attributes available for filtering and grouping:
* Environment
* Namespace
* Kind
* Resource name
* Service name
* Additional attributes specific to resource types
### Track Resource State
Monitor specific resource attributes over time:
```sql
# Track HPA expected replicas
kubernetes_resource{kind="HorizontalPodAutoscaler"}
| select(max(status.expectedReplicas))
# Compare current vs desired replicas
kubernetes_resource{kind="HorizontalPodAutoscaler"}
| select(
max(status.currentReplicas),
max(status.desiredReplicas)
)
```
## JSON Path Queries
When querying Kubernetes resources metrics, you can use JSON Path expressions to extract specific values from the resource manifests. This is particularly useful when you want to aggregate or analyze specific fields within your Kubernetes resources.
### Using JSON Path in Metrics
The JSON Path functionality allows you to:
* Extract specific fields from Kubernetes resource manifests
* Aggregate values from nested structures
* Query array elements and complex objects
For example, you can:
* Get the number of replicas from a Deployment: `spec.replicas`
* Extract resource limits: `spec.template.spec.containers[*].resources.limits.cpu`
* Count available ports: `spec.ports[*].port`
### Syntax
The JSON Path syntax follows the standard format:
* `.` is used for child operator
* `[*]` is used for array iteration
* `[?()]` supports filters
### Examples
Here are some common use cases:
1. **Deployment Resource Requests and Limits**
```jsonpath
spec.template.spec.containers[*].resources.requests.memory
spec.template.spec.containers[*].resources.limits.cpu
```
2. **Pod Image**
```jsonpath
spec.template.spec.containers[*].image
```
3. **Deployment Configuration**
```jsonpath
spec.replicas
spec.strategy.type
```
3. **Service Configuration**
```jsonpath
$.spec.ports[*].port
$.spec.type
```
4. **Deployment Pod Template**
```jsonpath
$.spec.template.spec.containers[*].image
$.spec.template.spec.containers[*].name
```
### Usage in Metoro
An example of a JSON Path query in Metoro:

Note: If no JSON Path is specified or the path doesn't match any values, the metric will return null values.
## Viewing Resources
You can view resources associated with each [service](/concepts/overview) in the Metoro UI:
1. Navigate to a service page
2. Select the Kubernetes tab
3. View current and historical resource states
## Filtering and Search
### Attribute Filtering
Filter events by any attribute:
* Event type (Warning/Informational)
* Service name
* Namespace
* Resource kind
* Reporting component
### Message Search
Use regex search to find specific events:
```
# Find HPA scaling failures
HPAfailed
# Find container crashes
container.*Error
# Find scheduling issues
FailedScheduling
```
## Best Practices
1. **Regular Monitoring**:
* Review warning events daily
* Track event patterns across services
* Monitor high-frequency events
2. **Troubleshooting**:
* Use service association to correlate events
* Combine event data with logs and metrics
* Track event history for recurring issues
3. **Filtering Strategy**:
* Create saved filters for common scenarios
* Use regex for complex pattern matching
* Filter by service for targeted analysis
# Kubernetes Resources
Source: https://metoro.io/docs/kubernetes-resources/kubernetes-resources
Track and analyze Kubernetes resource changes over time
## Overview
Metoro provides comprehensive tracking of Kubernetes resources, capturing every update to give you a complete history of your cluster's state. This "time-travel" capability allows you to view your cluster's state at any point in time, not just its current state.
## Resource Tracking
The cluster agent watches and exports the following Kubernetes resources:
* Pods
* Deployments
* StatefulSets
* ReplicaSets
* DaemonSets
* Nodes
* ConfigMaps
* Services
* Jobs
* CronJobs
* Endpoints
* Events
* Horizontal Pod Autoscalers
* Ingresses
* Namespaces
Metoro explicitly does not export secrets. If you have resources you want to exclude from exporting, you can remove
them from the service account permissions given to the cluster agent.
See the permissions
[here](https://github.com/Chrisbattarbee/metoro-helm-charts/blob/62b809debce64758c2995b9feb988f37aca87bff/charts/metoro-exporter/templates/exporter_service_account.yaml#L10).
## Resource Metrics
Kubernetes resources can be analyzed using the `kubernetes_resource` metric type. This allows you to:
### Count Resources
Track the number of resources by various attributes:
```sql
# Count pods by service
kubernetes_resource{kind="Pod"}
| group_by(service_name)
# Count resources by namespace
kubernetes_resource{kind="Deployment"}
| group_by(namespace)
```
### Resource Attributes
Common attributes available for filtering and grouping:
* Environment
* Namespace
* Kind
* Resource name
* Service name
* Additional attributes specific to resource types
### Track Resource State
Monitor specific resource attributes over time:
```sql
# Track HPA expected replicas
kubernetes_resource{kind="HorizontalPodAutoscaler"}
| select(max(status.expectedReplicas))
# Compare current vs desired replicas
kubernetes_resource{kind="HorizontalPodAutoscaler"}
| select(
max(status.currentReplicas),
max(status.desiredReplicas)
)
```
## JSON Path Queries
When querying Kubernetes resources metrics, you can use JSON Path expressions to extract specific values from the resource manifests. This is particularly useful when you want to aggregate or analyze specific fields within your Kubernetes resources.
### Using JSON Path in Metrics
The JSON Path functionality allows you to:
* Extract specific fields from Kubernetes resource manifests
* Aggregate values from nested structures
* Query array elements and complex objects
For example, you can:
* Get the number of replicas from a Deployment: `spec.replicas`
* Extract resource limits: `spec.template.spec.containers[*].resources.limits.cpu`
* Count available ports: `spec.ports[*].port`
### Syntax
The JSON Path syntax follows the standard format:
* `.` is used for child operator
* `[*]` is used for array iteration
* `[?()]` supports filters
### Examples
Here are some common use cases:
1. **Deployment Resource Requests and Limits**
```jsonpath
spec.template.spec.containers[*].resources.requests.memory
spec.template.spec.containers[*].resources.limits.cpu
```
2. **Pod Image**
```jsonpath
spec.template.spec.containers[*].image
```
3. **Deployment Configuration**
```jsonpath
spec.replicas
spec.strategy.type
```
3. **Service Configuration**
```jsonpath
$.spec.ports[*].port
$.spec.type
```
4. **Deployment Pod Template**
```jsonpath
$.spec.template.spec.containers[*].image
$.spec.template.spec.containers[*].name
```
### Usage in Metoro
An example of a JSON Path query in Metoro:

Note: If no JSON Path is specified or the path doesn't match any values, the metric will return null values.
## Viewing Resources
You can view resources associated with each [service](/concepts/overview) in the Metoro UI:
1. Navigate to a service page
2. Select the Kubernetes tab
3. View current and historical resource states
 ## Use Cases
1. **Change Tracking**:
* Track configuration changes
* Monitor scaling events
* Debug resource modifications
2. **Resource Analysis**:
* Count resources by type
* Monitor replica counts
* Track resource distribution
3. **Historical Debugging**:
* View past cluster states
* Analyze resource evolution
* Investigate incidents
## Best Practices
1. **Resource Monitoring**:
* Track critical resource counts
* Monitor scaling patterns
* Set up alerts for unexpected changes
2. **Historical Analysis**:
* Use time-travel for debugging
* Compare states across time periods
* Track configuration evolution
3. **Metric Usage**:
* Group resources meaningfully
* Track relevant attributes
* Combine with other metric types
# Log Ingestion Settings
Source: https://metoro.io/docs/logs/ingestion-settings
Metoro provides granular control over which logs are sent from your cluster for ingestion. You can configure inclusion and exclusion patterns to manage your log data effectively.

## Overview
Log ingestion settings allow you to:
* Include only specific logs that match certain patterns
* Exclude sensitive or unnecessary logs from being sent out of your cluster
* Apply filters based on services or namespaces
* Control log ingestion across different environments
## Configuring Log Filters
You can configure log filters from the [settings page](https://us-east.metoro.io/settings) under the **Data Ingestion Settings -> Log Filters** tab.
Each log filter consists of:
1. **Include/Exclude Pattern**: Choose whether to include or exclude logs that match your filter
2. **Environment Selection**: Apply the filter to specific environments or all environments
3. **Filter Type**: Choose between filtering by specific services or namespaces
4. **Pattern Matching**: Define regex patterns in [re2](https://github.com/google/re2/wiki/Syntax) to match log content
### Include Filters
Include filters allow you to specify which logs should be sent to Metoro. Only logs matching these patterns will be **sent out of your cluster**. This is useful when you want to:
* Only collect logs from specific services
* Only ingest logs containing certain patterns
* Limit log ingestion to specific namespaces
### Exclude Filters
Exclude filters prevent matching logs from being sent to Metoro. This is useful for:
* Protecting sensitive data
* Reducing noise from verbose logging
* Managing ingestion costs
* Filtering out unnecessary debug logs
## Best Practices
1. **Start with Broad Patterns**: Begin with broader patterns and refine them based on your needs
2. **Test Your Patterns**: Use the regex pattern carefully to ensure you're not accidentally excluding important logs
3. **Regular Review**: Periodically review your filters to ensure they still align with your needs
4. **Adjust log alerts**: If you have log alerts set up, make sure they are up to date with your log filters
## Examples
Here are some common use cases for log filters:
1. **Exclude Sensitive Data**
```
Type: Exclude
Environment: All Environments
Filter Type: Service
Services: /k8s/authorization/auth-service
Pattern: password=.*
```
This filter will exclude logs containing the pattern `password=.*` from the `auth-service` service in `authorization` namespace in all environments.
2. **Include Only Error Logs**
```
Type: Include
Environment: All Environments
Pattern: .*ERROR.*|.*FATAL.*
Filter Type: Namespace
Namespaces: namespaceX
```
This filter will include logs containing the patterns `ERROR` or `FATAL` from all services in the `namespaceX` namespace in all environments.
3. **Exclude Debug Logs**
```
Type: Exclude
Environment: dev
Pattern: .*DEBUG.*
Filter Type: Service
Services: All Services
```
This filter will exclude logs containing the pattern `DEBUG` from all services in the `dev` environment.
# OpenTelemetry Integration
Source: https://metoro.io/docs/logs/opentelemetry
This guide explains how to send additional logs to Metoro using OpenTelemetry. Metoro supports the OpenTelemetry Protocol (OTLP) for log ingestion, allowing you to send logs from any application or service that can export OpenTelemetry logs.
## Prerequisites
* A Metoro account
* An application configured with OpenTelemetry
## Pricing
Custom logs are billed at \$0.30 per GB.
## High Level Overview
The metoro exporter running in each cluster is a fully compliant OpenTelemetry collector. This means that you can send logs to Metoro using any OpenTelemetry compatible tracing library.
## Endpoint Configuration
Configure your OpenTelemetry exporter to send logs to:
```
http://metoro-exporter.metoro.svc.cluster.local/api/v1/send/logs/otel
```
This endpoint is available within your Kubernetes cluster where the Metoro exporter is installed.
## Authentication
No additional authentication is required when sending logs from within the cluster to the Metoro exporter.
## OpenTelemetry Collector Configuration
If you're using the OpenTelemetry Collector to forward logs to Metoro, here's an example configuration:
```yaml
receivers:
otlp:
protocols:
http:
endpoint: 0.0.0.0:4318
grpc:
endpoint: 0.0.0.0:4317
processors:
batch:
timeout: 10s
send_batch_size: 1000
exporters:
otlphttp:
endpoint: http://metoro-exporter.metoro.svc.cluster.local:8080/api/v1/logs/otel
tls:
insecure: true # Since we're in-cluster
service:
pipelines:
logs:
receivers: [otlp]
processors: [batch]
exporters: [otlphttp]
```
This configuration:
* Receives logs via OTLP over both HTTP (4318) and gRPC (4317)
* Batches logs for efficient transmission
* Forwards logs to the Metoro exporter
* Uses insecure communication since we're within the cluster
## Language-Specific Examples
### Go
```go
package main
import (
"context"
"go.opentelemetry.io/otel"
"go.opentelemetry.io/otel/exporters/otlp/otlplog/otlploghttp"
"go.opentelemetry.io/otel/sdk/resource"
sdklog "go.opentelemetry.io/otel/sdk/log"
semconv "go.opentelemetry.io/otel/semconv/v1.24.0"
)
func initLogger() (*sdklog.LoggerProvider, error) {
ctx := context.Background()
exporter, err := otlploghttp.New(ctx,
otlploghttp.WithEndpoint("metoro-exporter.metoro.svc.cluster.local:8080"),
otlploghttp.WithURLPath("/api/v1/logs/otel"),
otlploghttp.WithInsecure(), // Since we're in-cluster
)
if err != nil {
return nil, err
}
resource := resource.NewWithAttributes(
semconv.SchemaURL,
semconv.ServiceName("your-service-name"),
)
loggerProvider := sdklog.NewLoggerProvider(
sdklog.WithBatcher(exporter),
sdklog.WithResource(resource),
)
return loggerProvider, nil
}
```
### Python
```python
from opentelemetry import trace
from opentelemetry.exporter.otlp.proto.http.trace_exporter import OTLPSpanExporter
from opentelemetry.sdk.resources import Resource
from opentelemetry.sdk.trace import TracerProvider
from opentelemetry.sdk.trace.export import BatchSpanProcessor
def init_logger():
exporter = OTLPSpanExporter(
endpoint="http://metoro-exporter.metoro.svc.cluster.local:8080/api/v1/logs/otel",
insecure=True # Since we're in-cluster
)
resource = Resource.create({
"service.name": "your-service-name"
})
provider = TracerProvider(resource=resource)
processor = BatchSpanProcessor(exporter)
provider.add_span_processor(processor)
return provider
```
### Node.js
```javascript
const { LoggerProvider } = require('@opentelemetry/sdk-logs');
const { OTLPLogExporter } = require('@opentelemetry/exporter-logs-otlp-http');
const { Resource } = require('@opentelemetry/resources');
const { SemanticResourceAttributes } = require('@opentelemetry/semantic-conventions');
const resource = new Resource({
[SemanticResourceAttributes.SERVICE_NAME]: 'your-service-name',
});
const logExporter = new OTLPLogExporter({
url: 'http://metoro-exporter.metoro.svc.cluster.local:8080/api/v1/logs/otel',
headers: {},
});
const loggerProvider = new LoggerProvider({
resource: resource,
});
loggerProvider.addLogRecordProcessor(new BatchLogRecordProcessor(logExporter));
```
## Attributes and Context
When sending logs via OpenTelemetry, you can include additional attributes that will be indexed and searchable in Metoro:
* Use resource attributes to define static information about the service
* Use log attributes to include dynamic information with each log entry
* Link logs with traces using trace context propagation
## Troubleshooting
If you encounter issues with OpenTelemetry log ingestion:
1. Verify your endpoint URL and API key are correct
2. Check your network connectivity to the Metoro OTLP endpoint
3. Enable debug logging in your OpenTelemetry SDK
4. Verify your logs appear in the Metoro logs view
5. Contact support if issues persist
## Additional Resources
* [OpenTelemetry Documentation](https://opentelemetry.io/docs/)
* [OpenTelemetry Specification](https://github.com/open-telemetry/opentelemetry-specification)
# Logs Overview
Source: https://metoro.io/docs/logs/overview
Metoro provides comprehensive logging capabilities by capturing every log emitted from all containers in your infrastructure. It automatically collects both standard output (stdout) and standard error (stderr) from every container, aggregating them in a centralized platform for easy access and analysis.
The log view is accessible from the left sidebar [or here](https://us-east.metoro.io/logs).

## Log Search and Performance
The log view allows you to filter logs using multiple methods:
* Regex search using [re2](https://github.com/google/re2/wiki/Syntax) format
* Attribute-based filtering
* Time range selection
* Clauses are combined with AND, by default
You can use regex search on any attribute by using the syntax `attribute = regex: `. For example:
* `service.name = regex: .*metoro.*` will match logs from any service containing "metoro"
* `message = regex: error|warning` will match logs containing "error" or "warning"
* `kubernetes.container.name = regex: ^api-.*` will match containers starting with "api-"
Metoro's logging system is highly performant, capable of searching through billions of logs in seconds.
## Default Attributes
Each log entry is automatically tagged with several default attributes:
* Container ID (the unique id of the container that emitted the log)
* Environment
* Namespace (the namespace the container belongs to)
* Service name (the service the container belongs to)
* Host (source of the log)
## Structured Logs
Metoro automatically parses structured JSON logs and other formats like LogZero, making every field searchable. Key features include:
* Automatic parsing of JSON log formats and LogZero format
* Flattening of nested JSON structures using dot notation
* Every key and value is indexed for searching
* Similar search performance to regex searches when filtering by specific JSON fields
For detailed information about structured log parsing and best practices, see our [Structured Logs Guide](/logs/structured-logs).
## Log Clustering and Hashing
Metoro implements an intelligent log clustering system that:
* Assigns unique hashes to similar log lines
* Groups logs that are similar but differ in dynamic elements (like timestamps)
* Enables searching for similar types of errors using hash-based clustering
* Helps identify patterns in your logs more effectively
You can see this as the pattern.hash attribute in each log entry.
## Log Analytics and Alerting
Beyond basic log viewing and searching, Metoro provides advanced analytics capabilities:
* Chart log volume over time - apply filters and group logs by any attribute
* Create visualizations filtered by specific log patterns
* Build alerts based on log patterns and frequencies
## Bring your own Logs (OpenTelemetry Log Ingestion)
In addition to automatically collecting container logs, Metoro supports ingesting logs from any source that implements the OpenTelemetry protocol. This allows you to:
* Send logs from applications running outside your Kubernetes cluster
* Integrate existing logging pipelines with Metoro
* Maintain a unified logging experience across all your infrastructure
To learn more about setting up OpenTelemetry log ingestion, see our [OpenTelemetry Log Integration Guide](/logs/opentelemetry).
# Structured Logs
Source: https://metoro.io/docs/logs/structured-logs
Metoro provides advanced parsing capabilities for structured logs, automatically extracting and indexing fields from various log formats. This makes your structured logs fully searchable and helps you get more value from your logging data.
## JSON Structured Logs
Metoro automatically detects and parses JSON-formatted logs. When a log entry is in JSON format, Metoro will:
1. Extract all fields from the JSON object
2. Flatten nested JSON structures using dot notation
3. Index all fields for searching
4. Handle the message field specially
For example, if your log entry is:
```json
{
"service": "payment-processor",
"region": "us-west",
"error": {
"code": 500,
"details": "Database connection failed"
},
"msg": "Transaction processing failed"
}
```
Metoro will:
1. Extract and index these fields:
* `service: "payment-processor"`
* `region: "us-west"`
* `error.code: "500"`
* `error.details: "Database connection failed"`
2. Use the `msg` field as the main log message
3. Make all fields searchable using attribute filters
You can then search for these logs using attribute filters like:
* `error.code = "500"`
* `service = "payment-processor"`
* `error.details = regex: .*connection.*`
### Message Field Handling
For JSON-formatted logs, Metoro looks for a dedicated message field in this order:
1. `msg` field
2. `message` field
3. If neither exists, the entire JSON object is preserved as the log body
Make sure to include a `msg` or `message` field in your JSON logs for better readability.
Move all other fields to log attributes for easy searching
For example, this JSON log:
```json
{
"timestamp": "2024-03-15T10:30:00Z",
"level": "error",
"service": "order-service",
"msg": "Failed to process order",
"order_id": "12345",
"error_code": 500
}
```
Will be displayed as:
* **Log Message**: "Failed to process order"
* **Log Attributes**:
* `timestamp: "2024-03-15T10:30:00Z"`
* `level: "error"`
* `service: "order-service"`
* `order_id: "12345"`
* `error_code: "500"`
This makes your logs more readable while keeping all fields searchable.
## LogZero Format
Metoro also supports the LogZero format, which follows this pattern:
```
[LEVEL DATE TIME module:line] message
```
For example:
```
[I 250313 16:24:23 my_handler:160] Request processed successfully
```
When parsing LogZero format, Metoro extracts:
* `level`: Log level (I=info, D=debug, W=warning, E=error, C=critical)
* `module`: The module name
* `line`: The line number
* Remaining text:
* Becomes the log message if the message is not JSON-formatted
* Is parsed as JSON if the message is JSON-formatted
These fields are then indexed and made searchable like any other log attribute.
## Best Practices
1. **Use Consistent Formats**: Stick to a consistent log format across your services
2. **Include Essential Fields**: Always include:
* Timestamp
* Service name
* Log level/severity
* A clear message field
3. **Structured Data**: Use JSON formatting for logs when possible
4. **Nested Data**: Feel free to use nested JSON objects - Metoro will flatten them automatically
5. **Field Naming**: Use clear, consistent field names across your services
## Searching Structured Logs
You can search through structured log fields using:
1. **Exact matches**: `field = "value"`
2. **Regex matches**: `field = regex: pattern`
3. **Multiple values**: `field = ["value1", "value2"]`
4. **Nested fields**: `parent.child = "value"`
For example:
```
error.code = "500"
service.name = regex: .*api.*
environment = ["prod", "staging"]
```
# null
Source: https://metoro.io/docs/logs/vector
# Sending Logs with Vector
This guide demonstrates how to send logs to Metoro using Vector and the OpenTelemetry Collector. This setup provides a robust and scalable way to collect and forward logs to Metoro.
For a complete working example, see our [Vector Logs Example](https://github.com/metoro-io/metoro_examples/tree/main/logs/vector) repository.
You must add a `service.name` attribute to your logs. This attribute is required by Metoro to properly organize and display your logs. You can set this using Vector's transforms (shown below) or directly in your application logging configuration.
## Architecture
The setup consists of two main components:
1. **Vector**: Acts as the log collector and forwarder. In this example, it generates sample syslog messages and forwards them to the OpenTelemetry Collector.
2. **OpenTelemetry Collector**: Receives logs from Vector, processes them, and forwards them to Metoro in the correct OpenTelemetry format.
```mermaid
%%{init: {
'theme': 'dark',
'themeVariables': {
'fontFamily': 'Inter',
'primaryColor': '#151F32',
'primaryTextColor': '#EBF1F7',
'primaryBorderColor': '#3793FF',
'lineColor': '#334670',
'secondaryColor': '#151F32',
'tertiaryColor': '#151F32',
'mainBkg': '#151F32',
'nodeBorder': '#3793FF',
'clusterBkg': '#182338',
'titleColor': '#EBF1F7',
'edgeLabelBackground': '#151F32',
'clusterBorder': '#334670'
},
'maxZoom': 2,
'minZoom': 0.5,
'zoom': true
}}%%
flowchart LR
A[Your External Applications] --> B[Vector]
B -->|Syslog TCP| C[OpenTelemetry Collector]
C -->|OTLP HTTP| D[Metoro Exporter]
style A fill:#182338,stroke:#3793FF,color:#EBF1F7
style B fill:#182338,stroke:#3793FF,color:#EBF1F7
style C fill:#182338,stroke:#3793FF,color:#EBF1F7
style D fill:#182338,stroke:#3793FF,color:#EBF1F7
```
## Vector Configuration
Vector needs to be configured to forward logs to the OpenTelemetry Collector. Here's the sink configuration:
```yaml
transforms:
add_service_name:
type: remap
inputs: ["your_source_name"]
source: |
# Add a service name to help organize logs in Metoro
.service.name = "your-service-name"
sinks:
syslog_sink:
type: socket
inputs: ["add_service_name"] # Use the transform output
address: "otel-collector:1514" # Address of your OpenTelemetry Collector
mode: "tcp"
encoding:
codec: "text"
```
### Vector Source Options
Vector supports many different sources for collecting logs:
* `kubernetes_logs`: Collect logs from Kubernetes containers
* `file`: Read logs from files
* `syslog`: Accept syslog messages
* `journald`: Read from systemd journal
* And [many more](https://vector.dev/docs/reference/configuration/sources/)
## OpenTelemetry Collector Configuration
The OpenTelemetry Collector needs to be configured to receive logs from Vector and forward them to Metoro. Here's the configuration:
```yaml
receivers:
# Configure the syslog receiver
syslog:
tcp:
listen_address: 0.0.0.0:1514
protocol: rfc5424
processors:
# Batch logs for efficient processing
batch:
timeout: 1s
send_batch_size: 4096
exporters:
# Configure the Metoro exporter
otlphttp:
endpoint: "http://metoro-exporter.metoro.svc.cluster.local/api/v1/send/logs/otel"
logs_endpoint: "http://metoro-exporter.metoro.svc.cluster.local/api/v1/send/logs/otel"
insecure: true
service:
# Set up the processing pipeline
pipelines:
logs:
receivers: [syslog]
processors: [batch]
exporters: [otlphttp]
```
### OpenTelemetry Collector Components
1. **Receivers**: Configure how the collector receives data
* In this case, we use the syslog receiver on port 1514
* Supports RFC5424 format syslog messages
2. **Processors**: Configure data processing
* Batch processor groups logs for efficient sending
* Adjustable timeout and batch size settings
3. **Exporters**: Configure where to send the data
* Uses OTLP HTTP protocol to send to Metoro
* Endpoint points to your Metoro instance
## Customization
### Log Sources
To collect logs from your applications, configure an appropriate Vector source for your use case. See the [Vector documentation](https://vector.dev/docs/reference/configuration/sources/) for available source types and their configurations.
### Batch Settings
Adjust the batch processor settings in the OpenTelemetry Collector for your needs:
```yaml
processors:
batch:
timeout: 1s # Increase for higher latency tolerance
send_batch_size: 4096 # Adjust based on log volume
```
## Troubleshooting
Common issues and solutions:
1. **Vector can't connect to the OpenTelemetry Collector**:
* Verify the collector address is correct
* Check that the collector is listening on the specified port
* Ensure network connectivity between Vector and the collector
2. **Logs not appearing in Metoro**:
* Check the OpenTelemetry Collector logs for errors
* Verify the Metoro endpoint is correct
* Check that logs are being received by the collector
## Next Steps
* Configure Vector to collect your application logs
* Add filters and transforms in Vector to process logs
* Set up monitoring for Vector and the OpenTelemetry Collector
* Configure log retention and archival policies
# OpenTelemetry Integration
Source: https://metoro.io/docs/metrics/custom-metrics
How to send custom metrics to Metoro via OpenTelemetry
This guide explains how to send custom metrics to Metoro using OpenTelemetry. Metoro supports the OpenTelemetry Protocol (OTLP) for metric ingestion, allowing you to send metrics from any application or service that can export OpenTelemetry metrics.
## Prerequisites
* A Metoro account
* An application configured with OpenTelemetry
## High Level Overview
The Metoro exporter running in each cluster is a fully compliant OpenTelemetry collector. This means that you can send metrics to Metoro using any OpenTelemetry compatible metrics library.
## Endpoint Configuration
Configure your OpenTelemetry exporter to send metrics to:
```
http://metoro-exporter.metoro.svc.cluster.local/api/v1/custom/otel/metrics
```
This endpoint is available within your Kubernetes cluster where the Metoro exporter is installed.
## Authentication
No additional authentication is required when sending metrics from within the cluster to the Metoro exporter.
## Language-Specific Examples
### Python
Here's an example Python script that publishes deployment metrics to Metoro:
```python
import sys
from kubernetes import client, config
from opentelemetry import metrics
from opentelemetry.exporter.otlp.proto.http.metric_exporter import OTLPMetricExporter
from opentelemetry.sdk.metrics import MeterProvider
from opentelemetry.sdk.metrics.export import (
PeriodicExportingMetricReader,
)
# Main
if __name__ == "__main__":
metric_reader = PeriodicExportingMetricReader(
OTLPMetricExporter(endpoint="http://metoro-exporter.metoro.svc.cluster.local/api/v1/custom/otel/metrics")
)
provider = MeterProvider(metric_readers=[metric_reader])
# Sets the global default meter provider
metrics.set_meter_provider(provider)
# Creates a meter from the global meter provider
meter = metrics.get_meter(__name__)
config.load_kube_config()
namespace = sys.argv[1]
app = client.AppsV1Api()
deployment_data = app.list_namespaced_deployment(namespace)
desired_replicas = meter.create_gauge("custom_metrics.desired_replicas")
available_replicas = meter.create_gauge("custom_metrics.available_replicas")
for item in deployment_data.items:
desired_replicas.set(item.status.replicas, {"deployment": item.metadata.name})
available_replicas.set(item.status.available_replicas, {"deployment": item.metadata.name})
# Make sure that all the metrics are exported before the application exits
provider.force_flush()
```
This script:
1. Creates two gauge metrics:
* `custom_metrics.desired_replicas` - The desired number of replicas for a deployment
* `custom_metrics.available_replicas` - The number of available replicas for a deployment
2. Includes a `deployment` attribute with the name of the deployment
3. Uses the OpenTelemetry SDK to export metrics to Metoro
### Go
```go
package main
import (
"context"
"go.opentelemetry.io/otel"
"go.opentelemetry.io/otel/exporters/otlp/otlpmetric/otlpmetrichttp"
"go.opentelemetry.io/otel/sdk/metric"
"go.opentelemetry.io/otel/sdk/resource"
semconv "go.opentelemetry.io/otel/semconv/v1.24.0"
)
func initMetrics() (*metric.MeterProvider, error) {
ctx := context.Background()
exporter, err := otlpmetrichttp.New(ctx,
otlpmetrichttp.WithEndpoint("metoro-exporter.metoro.svc.cluster.local"),
otlpmetrichttp.WithURLPath("/api/v1/custom/otel/metrics"),
otlpmetrichttp.WithInsecure(), // Since we're in-cluster
)
if err != nil {
return nil, err
}
resource := resource.NewWithAttributes(
semconv.SchemaURL,
semconv.ServiceName("your-service-name"),
)
meterProvider := metric.NewMeterProvider(
metric.WithReader(metric.NewPeriodicReader(exporter)),
metric.WithResource(resource),
)
return meterProvider, nil
}
```
### Node.js
```javascript
const { MeterProvider } = require('@opentelemetry/sdk-metrics');
const { OTLPMetricExporter } = require('@opentelemetry/exporter-metrics-otlp-http');
const { Resource } = require('@opentelemetry/resources');
const { SemanticResourceAttributes } = require('@opentelemetry/semantic-conventions');
const resource = new Resource({
[SemanticResourceAttributes.SERVICE_NAME]: 'your-service-name',
});
const metricExporter = new OTLPMetricExporter({
url: 'http://metoro-exporter.metoro.svc.cluster.local/api/v1/custom/otel/metrics',
headers: {},
});
const meterProvider = new MeterProvider({
resource: resource,
});
meterProvider.addMetricReader(new PeriodicExportingMetricReader({
exporter: metricExporter,
exportIntervalMillis: 1000,
}));
```
## Metric Types
OpenTelemetry supports several metric types that you can use:
1. **Counter** - A value that can only increase or be reset to zero
2. **Gauge** - A value that can arbitrarily go up and down
3. **Histogram** - Tracks the distribution of values over time
## Attributes and Context
When sending metrics via OpenTelemetry, you can include additional attributes that will be indexed and searchable in Metoro:
* Use resource attributes to define static information about the service
* Use metric attributes to include dynamic information with each metric value
* Link metrics with traces using trace context propagation
## Troubleshooting
If you encounter issues with OpenTelemetry metric ingestion:
1. Verify your endpoint URL is correct
2. Check your network connectivity to the Metoro OTLP endpoint
3. Enable debug logging in your OpenTelemetry SDK
4. Verify your metrics appear in the Metoro metrics view
5. Contact support if issues persist
## Additional Resources
* [OpenTelemetry Documentation](https://opentelemetry.io/docs/)
* [OpenTelemetry Metrics Specification](https://github.com/open-telemetry/opentelemetry-specification/blob/main/specification/metrics/data-model.md)
# Default Metrics
Source: https://metoro.io/docs/metrics/generated-metrics
This page lists all metrics that Metoro automatically generates for your containers and infrastructure.
## Common Kubernetes Attributes
All node and container metrics include the following Kubernetes attributes. These attributes provide detailed information about the node's infrastructure, architecture, and location:
### Node Information
* `kubernetes.io/hostname` - Node hostname
* `kubernetes.io/os` - Operating system (also available as `beta.kubernetes.io/os`)
* `kubernetes.io/arch` - CPU architecture (also available as `beta.kubernetes.io/arch`)
* `kubernetes.io/instance-type` - Instance type (also available as `node.kubernetes.io/instance-type`, `beta.kubernetes.io/instance-type`)
### Cloud Provider Information
* `k8s.io/cloud-provider-aws` - AWS cloud provider identifier
* `eks.amazonaws.com/nodegroup` - EKS node group name
* `eks.amazonaws.com/nodegroup-image` - EKS AMI image
* `eks.amazonaws.com/capacityType` - EKS capacity type
* `eks.amazonaws.com/sourceLaunchTemplateId` - EKS launch template ID
* `eks.amazonaws.com/sourceLaunchTemplateVersion` - EKS launch template version
### Location and Topology
* `topology.kubernetes.io/region` - Cloud provider region
* `topology.kubernetes.io/zone` - Availability zone
* `topology.k8s.aws/zone-id` - AWS zone ID
* `topology.ebs.csi.aws.com/zone` - EBS zone
* `failure-domain.beta.kubernetes.io/region` - Region (legacy label)
* `failure-domain.beta.kubernetes.io/zone` - Zone (legacy label)
### Karpenter-specific Information
* `karpenter.sh/nodepool` - Karpenter node pool
* `karpenter.sh/capacity-type` - Capacity type
* `karpenter.k8s.aws/instance-category` - AWS instance category
* `karpenter.k8s.aws/instance-family` - AWS instance family
* `karpenter.k8s.aws/instance-size` - AWS instance size
* `karpenter.k8s.aws/instance-generation` - AWS instance generation
* `karpenter.k8s.aws/instance-cpu` - CPU details
* `karpenter.k8s.aws/instance-cpu-manufacturer` - CPU manufacturer
* `karpenter.k8s.aws/instance-memory` - Memory capacity
* `karpenter.k8s.aws/instance-network-bandwidth` - Network bandwidth
* `karpenter.k8s.aws/instance-ebs-bandwidth` - EBS bandwidth
* `karpenter.k8s.aws/instance-hypervisor` - Hypervisor type
* `karpenter.k8s.aws/instance-local-nvme` - Local NVMe storage
### Other
* `pool` - Generic pool identifier
These attributes can be used for filtering and grouping metrics to analyze specific segments of your infrastructure.
## Container Attributes
* `instance` - The instance identifier
* `environment` - The environment name
* `container_name` - Name of the container
* `container_id` - Unique container identifier
* `service_name` - Name of the service the container belongs to
* `namespace` - Kubernetes namespace
* `pod_name` - Name of the pod
These attributes can be used for filtering and grouping metrics to analyze specific segments of your infrastructure.
## Node Metrics
### Node Information
| Metric Name | Type | Units | Attributes | Description |
| --------------------- | ----- | ------- | --------------------------------------------------------------------------------------------------------------------------------------------------------- | ----------------------------------------- |
| node\_info | gauge | - | hostname, kernel\_version | Meta information about the node |
| node\_cloud\_info | gauge | - | provider, account\_id, instance\_id, instance\_type, instance\_life\_cycle, region, availability\_zone, availability\_zone\_id, local\_ipv4, public\_ipv4 | Meta information about the cloud instance |
| node\_uptime\_seconds | gauge | seconds | - | Uptime of the node in seconds |
### Node Resource Metrics
| Metric Name | Type | Units | Attributes | Description |
| ------------------------------------------- | ------- | ------- | ---------- | ----------------------------------------- |
| node\_resources\_cpu\_usage\_seconds\_total | counter | seconds | mode | The amount of CPU time spent in each mode |
| node\_resources\_cpu\_logical\_cores | gauge | count | - | The number of logical CPU cores |
| node\_resources\_memory\_total\_bytes | gauge | bytes | - | The total amount of physical memory |
| node\_resources\_memory\_free\_bytes | gauge | bytes | - | The amount of unassigned memory |
| node\_resources\_memory\_available\_bytes | gauge | bytes | - | The total amount of available memory |
| node\_resources\_memory\_cached\_bytes | gauge | bytes | - | The amount of memory used as page cache |
### Node Disk Metrics
| Metric Name | Type | Units | Attributes | Description |
| -------------------------------------------------- | ------- | ------- | ---------- | ---------------------------------------------------- |
| node\_resources\_disk\_reads\_total | counter | count | device | The total number of reads completed successfully |
| node\_resources\_disk\_writes\_total | counter | count | device | The total number of writes completed successfully |
| node\_resources\_disk\_read\_bytes\_total | counter | bytes | device | The total number of bytes read from the disk |
| node\_resources\_disk\_written\_bytes\_total | counter | bytes | device | The total number of bytes written to the disk |
| node\_resources\_disk\_read\_time\_seconds\_total | counter | seconds | device | The total number of seconds spent reading |
| node\_resources\_disk\_write\_time\_seconds\_total | counter | seconds | device | The total number of seconds spent writing |
| node\_resources\_disk\_io\_time\_seconds\_total | counter | seconds | device | The total number of seconds the disk spent doing I/O |
### Node Network Metrics
| Metric Name | Type | Units | Attributes | Description |
| -------------------------------------- | ------- | ----- | ------------- | --------------------------------------- |
| node\_net\_received\_bytes\_total | counter | bytes | interface | The total number of bytes received |
| node\_net\_transmitted\_bytes\_total | counter | bytes | interface | The total number of bytes transmitted |
| node\_net\_received\_packets\_total | counter | count | interface | The total number of packets received |
| node\_net\_transmitted\_packets\_total | counter | count | interface | The total number of packets transmitted |
| node\_net\_interface\_up | gauge | - | interface | Status of the interface (0:down, 1:up) |
| node\_net\_interface\_ip | gauge | - | interface, ip | IP address assigned to the interface |
## Container Metrics
### Resource Metrics
| Metric Name | Type | Units | Attributes | Description |
| ---------------------------------------------------- | ------- | ------- | ----------------------------- | ------------------------------------------------------------------------------------------------- |
| container\_info | gauge | - | image, systemd\_triggered\_by | Meta information about the container |
| container\_restarts\_total | counter | count | - | Number of times the container was restarted |
| container\_resources\_cpu\_limit\_cores | gauge | cores | - | CPU limit of the container |
| container\_resources\_cpu\_usage\_seconds\_total | counter | seconds | - | Total CPU time consumed by the container |
| container\_resources\_cpu\_delay\_seconds\_total | counter | seconds | - | Total time duration processes of the container have been waiting for a CPU (while being runnable) |
| container\_resources\_cpu\_throttled\_seconds\_total | counter | seconds | - | Total time duration the container has been throttled |
| container\_resources\_memory\_limit\_bytes | gauge | bytes | - | Memory limit of the container |
| container\_resources\_memory\_rss\_bytes | gauge | bytes | - | Amount of physical memory used by the container (doesn't include page cache) |
| container\_resources\_memory\_cache\_bytes | gauge | bytes | - | Amount of page cache memory allocated by the container |
| container\_oom\_kills\_total | counter | count | - | Total number of times the container was terminated by the OOM killer |
### Disk Metrics
| Metric Name | Type | Units | Attributes | Description |
| ------------------------------------------------- | ------- | ------- | ---------------------------- | ------------------------------------------------------------------------------------- |
| container\_resources\_disk\_delay\_seconds\_total | counter | seconds | - | Total time duration processes of the container have been waiting for I/Os to complete |
| container\_resources\_disk\_size\_bytes | gauge | bytes | mount\_point, device, volume | Total capacity of the volume |
| container\_resources\_disk\_used\_bytes | gauge | bytes | mount\_point, device, volume | Used capacity of the volume |
| container\_resources\_disk\_reserved\_bytes | gauge | bytes | mount\_point, device, volume | Reserved capacity of the volume |
| container\_resources\_disk\_reads\_total | counter | count | mount\_point, device, volume | Total number of reads completed successfully by the container |
| container\_resources\_disk\_read\_bytes\_total | counter | bytes | mount\_point, device, volume | Total number of bytes read from the disk by the container |
| container\_resources\_disk\_writes\_total | counter | count | mount\_point, device, volume | Total number of writes completed successfully by the container |
| container\_resources\_disk\_written\_bytes\_total | counter | bytes | mount\_point, device, volume | Total number of bytes written to the disk by the container |
### Network Metrics
| Metric Name | Type | Units | Attributes | Description |
| ----------------------------------------------------- | ------- | ------- | ---------- | ----------------------------------------------------------- |
| container\_net\_tcp\_successful\_connects\_total | counter | count | - | Total number of successful TCP connects |
| container\_net\_tcp\_connection\_time\_seconds\_total | counter | seconds | - | Time spent on TCP connections |
| container\_net\_tcp\_failed\_connects\_total | counter | count | - | Total number of failed TCP connects |
| container\_net\_tcp\_active\_connections | gauge | count | - | Number of active outbound connections used by the container |
| container\_net\_tcp\_retransmits\_total | counter | count | - | Total number of retransmitted TCP segments |
| container\_net\_latency\_seconds | gauge | seconds | - | Round-trip time between the container and a remote IP |
| container\_net\_tcp\_bytes\_sent\_total | counter | bytes | - | Total number of bytes sent to the peer |
| container\_net\_tcp\_bytes\_received\_total | counter | bytes | - | Total number of bytes received from the peer |
| container\_net\_bytes\_sent\_total | counter | bytes | - | Total number of bytes sent by the container |
| container\_net\_bytes\_received\_total | counter | bytes | - | Total number of bytes received by the container |
### Application Metrics
| Metric Name | Type | Units | Attributes | Description |
| ----------------------------------- | ----- | ----- | ----------------- | ---------------------------------------------------------------------------------- |
| container\_application\_type | gauge | - | application\_type | Type of the application running in the container (e.g. memcached, postgres, mysql) |
| container\_golang\_binary\_location | gauge | - | binary\_location | Location of the Golang binary running in the container |
### JVM Metrics
| Metric Name | Type | Units | Attributes | Description |
| ---------------------------------------------- | ----- | ------- | ------------------ | ------------------------------------------------------------------------- |
| container\_jvm\_info | gauge | - | jvm, java\_version | Meta information about the JVM |
| container\_jvm\_heap\_size\_bytes | gauge | bytes | jvm | Total heap size in bytes |
| container\_jvm\_heap\_used\_bytes | gauge | bytes | jvm | Used heap size in bytes |
| container\_jvm\_gc\_time\_seconds | gauge | seconds | jvm, gc | Time spent in the given JVM garbage collector in seconds |
| container\_jvm\_safepoint\_time\_seconds | gauge | seconds | jvm | Time the application has been stopped for safepoint operations in seconds |
| container\_jvm\_safepoint\_sync\_time\_seconds | gauge | seconds | jvm | Time spent getting to safepoints in seconds |
### Python Metrics
| Metric Name | Type | Units | Attributes | Description |
| ---------------------------------------------------- | ----- | ------- | ---------- | ------------------------------------------- |
| container\_python\_thread\_lock\_wait\_time\_seconds | gauge | seconds | - | Time spent waiting acquiring GIL in seconds |
### Protocol-Specific Request Metrics
| Metric Name | Type | Units | Description |
| ------------------------------------ | ------- | ----- | ----------------------------------------------------------------------- |
| container\_http\_requests\_total | counter | count | Total number of outbound HTTP requests |
| container\_postgres\_queries\_total | counter | count | Total number of outbound Postgres queries |
| container\_redis\_queries\_total | counter | count | Total number of outbound Redis queries |
| container\_memcached\_queries\_total | counter | count | Total number of outbound Memcached queries |
| container\_mysql\_queries\_total | counter | count | Total number of outbound Mysql queries |
| container\_mongo\_queries\_total | counter | count | Total number of outbound Mongo queries |
| container\_kafka\_requests\_total | counter | count | Total number of outbound Kafka requests |
| container\_cassandra\_queries\_total | counter | count | Total number of outbound Cassandra requests |
| container\_rabbitmq\_messages\_total | counter | count | Total number of Rabbitmq messages produced or consumed by the container |
| container\_nats\_messages\_total | counter | count | Total number of NATS messages produced or consumed by the container |
| container\_dubbo\_requests\_total | counter | count | Total number of outbound DUBBO requests |
| container\_dns\_requests\_total | counter | count | Total number of outbound DNS requests |
### Protocol-Specific Latency Metrics
| Metric Name | Type | Units | Description |
| ------------------------------------------------------- | --------- | ------- | ------------------------------------------------------------------- |
| container\_http\_requests\_duration\_seconds\_total | histogram | seconds | Histogram of the response time for each outbound HTTP request |
| container\_postgres\_queries\_duration\_seconds\_total | histogram | seconds | Histogram of the execution time for each outbound Postgres query |
| container\_redis\_queries\_duration\_seconds\_total | histogram | seconds | Histogram of the execution time for each outbound Redis query |
| container\_memcached\_queries\_duration\_seconds\_total | histogram | seconds | Histogram of the execution time for each outbound Memcached query |
| container\_mysql\_queries\_duration\_seconds\_total | histogram | seconds | Histogram of the execution time for each outbound Mysql query |
| container\_mongo\_queries\_duration\_seconds\_total | histogram | seconds | Histogram of the execution time for each outbound Mongo query |
| container\_kafka\_requests\_duration\_seconds\_total | histogram | seconds | Histogram of the execution time for each outbound Kafka request |
| container\_cassandra\_queries\_duration\_seconds\_total | histogram | seconds | Histogram of the execution time for each outbound Cassandra request |
| container\_dubbo\_requests\_duration\_seconds\_total | histogram | seconds | Histogram of the response time for each outbound DUBBO request |
| container\_dns\_requests\_duration\_seconds\_total | histogram | seconds | Histogram of the response time for each outbound DNS request |
# MetoroQL
Source: https://metoro.io/docs/metrics/metoroql
MetoroQL (mQL for short) is Metoro's query language for observability data. It's designed to be familiar to users of PromQL but with several important enhancements that make it more powerful for querying across different types of observability data.
## Overview
MetoroQL has a PromQL-like syntax but provides unified access to different types of data:
* Metrics (both standard and custom)
* Logs
* Traces
* Kubernetes resources
This allows you to correlate and analyze data from different sources using a consistent query language.
## Key Differences from PromQL
MetoroQL is generally a subset of promql with a few notable difference:
1. Counters return the delta of consecutive values by default
2. Queries can be over resource types other than metrics
3. Timeseries queries *must* have an aggregate applied to them
### Counter Handling
In PromQL, counter metrics require explicit functions like `rate()` or `increase()` to calculate the rate of change. In MetoroQL, counter values are automatically presented as the difference between consecutive data points. This means:
* Values represent changes between points rather than cumulative values
* You should not apply `rate()` or `increase()` functions to chart changes
For example, consider a HTTP request counter metric with one minute buckets:
```PromQL
# In PromQL, a query to get the number of requests
# sent in a given minute might look something like this
sum(rate(http_requests_total{service="api"}[5m])) / 5
# or
sum(rate(http_requests_total{service="api"}[5m])) * 60
# In MetoroQL, you directly query the counter
sum(http_requests_total{service="api"})
```
The MetoroQL query will directly show the change in request count between data points, while in PromQL, the raw `http_requests_total` would show monotonically increasing cumulative values that generally aren't immediately useful without applying `rate()` or `increase()`.
### Multi-domain Queries
One of the most powerful features of MetoroQL is the ability to query across different observability domains using special metric names:
* `logs` - Log data
* `traces` - Distributed tracing data
* `kubernetes_resources` - Kubernetes resources information
* Any other metric identifier is treated as a regular metric
Each of these domains has specific functions and aggregations that can be applied to them.
### Forced aggregations
In mQL *all* timeseries queries require an explicit aggregation function such as:
* `sum`
* `avg`
* `min`
* `max`
* `count`
* `histogram_quantile`
For example
```PromQL
# The following is a valid query in promql, this will return
# all individual timeseries (unique combination of labels and values).
container_resources_cpu_usage_seconds_total
# In mQL you must specify an aggregate
sum(container_resources_cpu_usage_seconds_total)
```
This behaviour differs from the default promql behaviour.
## Basic Query Syntax
A simple MetoroQL timeseries query has the following structure:
```PromQL
aggregation(metric_name{label1="value1", label2="value2"}) by (grouplabel1, grouplabel2)
```
For example to get the cpu usage of all services running in the default namespace:
```PromQL
max(container_resources_cpu_usage_seconds_total{namespace="default"}) by (service_name)
```
You can also perform arithmetic on a timeseries or between multiple timeseries
For example to get the percent of allocated disk actually used by a service
```PromQL
(sum(container_resources_disk_used_bytes) by (service_name) /
sum(container_resources_disk_size_bytes) by (service_name)) * 100
```
## Special Data Types
In addition to metrics, you can write mQL queries over logs, traces and kubernetes\_resources.
Each of these resources have their own rules on how they can be queried.
### Log Queries
* Log queries just support only the count aggregate.
* They support all filtering and group by operation.
* Structured json logs attributes are parsed into filterable fields.
```PromQL
# Count of error logs
count(logs{log_level="error"})
# Number of logs with a message matching a regex
count(logs{message=~".*failed.*"})
# Error logs by service
count(logs{log_level="error"}) by (service.name)
# Count each of the individual values of the
# custom "caller" field for all logs that have the field.
count(logs{caller=~".+"}) by (caller)
```
### Trace Queries
* Trace queries support both the `count` aggregation and the `trace_duration_quantile`.
* They support all filtering and group by operation.
* All custom attributes are queryable for filtering and group bys
```PromQL
# Count of all requests being served by currency services
count(traces{server.service.name=~".*currency.*"})
# Percent of 5XX requests served by the currency services
count(traces{http.status_code=~"5..", server.service.name=~".*currency.*"}) * 100
/ count(traces{server.service.name=~".*currency.*"})
# P95 for the convert endpoint
trace_duration_quantile(0.95, traces{http.path="/convert",
server.service.name=~".*currency.*"})
```
### Kubernetes Resources Queries
* Trace queries support both the `count` aggregation and all other aggerations after the `json_path` function is applied.
* They support all filtering and group by operation.
```PromQL
# Count of pods by namespace
count(kubernetes_resources{Kind="Pod"}) by (Namespace)
# Total number of replicas specified by deployments per service
sum(json_path("spec.replicas", kubernetes_resources)) by (ServiceName)
```
With `json_path`, you can:
* Extract and analyze specific fields from Kubernetes resources
* Use `sum`, `avg`, `min`, or `max` aggregations with the extracted values
## Advanced Features
### Filtering
MetoroQL supports several filtering operators:
```PromQL
# Exact match
metric{label="value"}
# Negation
metric{label!="value"}
# Regex matching
metric{label=~"pattern"}
# Negated regex
metric{label!~"pattern"}
```
### Binary Operations
You can create complex queries using arithmetic operations.
Supported operations are:
* `+` addition
* `-` subtraction
* `*` multiplication
* `/` division
* `%` modulo
* `^` exponentiation
* `==` equal
* `!=` not equal
* `<=` less than or equal
* `>=` greater than or equal
```PromQL
# Calculate logs error rate percentage
100 * (count(logs{log_level="error"}) / sum(logs))
# Compare CPU usage across environments
sum(container_resources_cpu_usage_seconds_total{environment="production"}) - sum(container_resources_cpu_usage_seconds_total{environment="staging"})
```
### Grouping
Group data by specific labels:
```
# Group by container and namespace
sum(container_memory_working_set_bytes) by (container, namespace)
# Top 5 pods by CPU usage
topk(5, max(container_cpu_usage) by (pod_name))
```
# Metrics Overview
Source: https://metoro.io/docs/metrics/overview
Metrics are a great way to understand the performance and internal characteristics of your services and infrastructure.
## Metoro Produced Metrics
Metoro automatically generates a large number of metrics from your services and infrastructure. These metrics are collected by the in-cluster agents and provide detailed information about the performance of your services and infrastructure. This includes things like
These are collected by the in-cluster agents and provide detailed information about the performance of your services and infrastructure. This includes things like:
* Network metrics at the container level
* Disk metrics at the container level
* CPU metrics at the container level
* Memory metrics at the container level
* Node level metrics
* And many many more...
You can check out all of the available metrics in the [metric explorer](https://demo.us-east.metoro.io/metric-explorer?chart=%7B%22startTime%22%3A1731371066%2C%22endTime%22%3A1731371966%2C%22metricName%22%3A%22container_net_tcp_active_connections%22%2C%22filters%22%3A%7B%22dataType%22%3A%22Map%22%2C%22value%22%3A%5B%5D%7D%2C%22excludeFilters%22%3A%7B%22dataType%22%3A%22Map%22%2C%22value%22%3A%5B%5D%7D%2C%22splits%22%3A%5B%5D%2C%22metricType%22%3A%22metric%22%2C%22type%22%3A%22line%22%2C%22functions%22%3A%5B%5D%2C%22aggregation%22%3A%22avg%22%7D\&tab=catalog\&startEnd=)
For a complete list of metrics that Metoro automatically generates, see [Default Metrics](/metrics/generated-metrics) or look at the [metric explorer](https://demo.us-east.metoro.io/metric-explorer) in platform.
## Custom Metrics
In addition to the automatically generated metrics, you can also send your own custom metrics to Metoro using OpenTelemetry. See [Custom Metrics](/metrics/custom-metrics) for details on how to send custom metrics to Metoro.
Learn how to send your own metrics to Metoro
## MetoroQL
Metoro provides a powerful query language called MetoroQL for working with metrics and other observability data. MetoroQL is designed to be familiar to users of PromQL but with enhanced capabilities:
* Query not just metrics, but also logs, traces, and Kubernetes resources with a unified syntax
* Simplified counter handling that doesn't require `rate()` or `increase()` functions
* Advanced filtering and correlation capabilities across different data types
MetoroQL is used throughout Metoro's UI, including in dashboards, charts, and alerts.
Learn how to query observability data with MetoroQL
## Searching and Filtering Metrics
Metoro provides powerful search capabilities for your metrics. You can filter metrics using:
* Metric names
* Label values
* Time ranges
* Regular expressions
For any metric label, you can use regex search with the syntax `label = regex: `. For example:
* `service.name = regex: .*metoro.*` will match metrics from any service containing "metoro"
* `container.name = regex: ^api-.*` will match containers starting with "api-"
* `kubernetes.namespace = regex: prod|staging` will match namespaces "prod" or "staging"
## Dashboarding
Metoro supports custom [dashboarding](/dashboards/overview) to help you gain insights into your services and infrastructure. See [Dashboards](/dashboards/overview) for more details.
# Prometheus Integration
Source: https://metoro.io/docs/metrics/prometheus
How to send Prometheus metrics to Metoro
There are two ways to send Prometheus metrics to Metoro.
## 1. OpenTelemetry Collector (Recommended)
The recommended approach is to use the OpenTelemetry Collector to scrape and forward Prometheus metrics to the exporter. This method preserves metric type information better than Prometheus Remote Write due to the more sophisticated type system in OpenTelemetry.
Here's an example configuration for the OpenTelemetry Collector:
```yaml
apiVersion: v1
kind: ConfigMap
metadata:
name: otel-collector-config
data:
collector-config.yaml: |
receivers:
prometheus:
config:
scrape_configs:
- job_name: 'prometheus-federate'
scrape_interval: 60s
metrics_path: /federate
params:
match[]:
- '{job=~".+"}'
static_configs:
- targets: ['PROMETHEUS_TO_SCRAPE_URL:9090']
# Uncomment this to rename the metrics to include the company name so it's easier to identify in Metoro vs the inbuilt metrics
# processors:
# metricstransform:
# transforms:
# - include: '(.*)'
# match_type: regexp
# action: update
# new_name: 'COMPANY_NAME_$1'
# batch: {}
exporters:
otlphttp:
endpoint: "http://metoro-exporter.metoro.svc.cluster.local/api/v1/custom/otel/metrics"
tls:
# Disable TLS for in-cluster communication, this is safe because the endpoint is internal to the cluster, when data is sent from the exporter out, it is encrypted
insecure: true
encoding: json
service:
pipelines:
metrics:
receivers: [prometheus]
processors: [metricstransform, batch]
exporters: [otlphttp]
```
This configuration:
1. Sets up a Prometheus receiver to scrape metrics from your Prometheus instance
2. Processes the metrics through a transformation pipeline
3. Exports them to Metoro using the OTLP protocol
A full example can be seen [here](https://github.com/metoro-io/metoro_examples/tree/main/metrics/otel-collector)
## 2. Prometheus Remote Write
This method is not recommended as it may not preserve all metric type information due to limitations in the Prometheus Remote Write protocol. You may see that some metrics end up as gauges instead of counters, histograms or summaries.
If you are unable to use the OpenTelemetry Collector, you can configure Prometheus to directly send metrics to Metoro using Remote Write. While this method is simpler to set up, it may not preserve all metric type information due to limitations in the Prometheus Remote Write protocol.
Add the following to your Prometheus configuration:
```yaml
# The rest of your configuration here
remote_write:
- url: "http://metoro-exporter.metoro.svc.cluster.local/api/v1/send/prometheus/remote_write"
```
This configuration will send all scraped metrics directly to the exporter from your Prometheus instance using Prometheus Remote Write.
A full example can be seen [here](https://github.com/metoro-io/metoro_examples/tree/main/metrics/prometheus-remote-write)
# Profiling Overview
Source: https://metoro.io/docs/profiling/overview
By default Metoro collects CPU-profiles for all containers running in the cluster.
## What are CPU profiles?
A CPU profile is simply a list of [stacktraces](https://en.wikipedia.org/wiki/Stack_trace) and time spent at each stack traces.
Metoro aggregates these lists together to show you how exactly which function your program is spending time in.
## Why are CPU profiles useful?
A CPU profile allows you to understand where that time is being spent down to the function level.
This means that you can investigate performance issues much more easily than by just observing that the program is using a lot of CPU, you can see where that CPU time is being spent.
In practice profiling is mainly used to understand performance regressions after something has changed: new code releases, a change in usage patterns or a new environment.
## Where can you view CPU profiles in Metoro?
You can view CPU profiles for each service in its respective [service](/concepts/overview#service-page) page under the **Profiling** tab.
This view provides an aggregated view of all profiles taken across all pods associated with the service in the time period you have selected.
You can filter by the specific container in the pod or by the cluster that the service is in.

## How does Metoro collect CPU profiles?
Metoro runs a sampling profiler to understand exactly which container is running on each CPU on a host.
The sampler runs at 97Hz to get the stacktraces of any program which is currently on the CPU.
### Profiling overhead
Running the sampling profiler has a small overhead of typically \< 0.5% of total cpu usage.
## Supported languages
CPU profiling currently supports:
* C
* C++
* Rust
* Golang
* Python
Other languages will show their native runtime methods but the cpu time won't be attributed to the interpreted function itself.
# Product Roadmap
Source: https://metoro.io/docs/roadmap/overview
Upcoming features and improvements
# Metoro Roadmap
Welcome to the Metoro product roadmap! Here you can find information about features and improvements we're working on. Our roadmap may change based on user feedback.
## Coming Soon (Q2 2025)
* Status Page Customization with Vanity URLs and Branding
* High Level Service/Environment Health Views
* Ability to Filter traces in Traces View where latency is greater/less than a certain threshold
* Easier time period comparison for graphs with predefined Xhr/Xday/Xweek ago options.
* Send the dimension that the metrics is alarming on in Alert notifications.
* Ability to export/download logs from Metoro.
* Improve Log level detection
* Improved documentation for metrics that are available in Metoro.
## Coming Soon (Q3 2025)
* Hierarchical Alerts and Dashboards organization
* Sub resource level (e.g. dashboards/myDashboards) RBAC
* Embedded Trace and Log View in the Dashboards
* Overlay for graphs showing min, max, avg by default.
* Support Unit selection on graphs
* Personal/Shared dashboards
* Ability to create alerts from code.
* Ability to create dashboards from code.
* Ability to create status pages and uptime monitors from code.
* More issue detection workflows.
* Cmd + K support for quick navigation.
## Future Plans
* AI Powered Q\&A
* AI Powered RCA
* Anomaly Detection
## Recently Completed
Check out our [changelog](/changelog/overview) to see what we've recently shipped!
This roadmap is for informational purposes only and does not represent a commitment to deliver specific features by specific dates.
# Common Questions
Source: https://metoro.io/docs/traces/common-questions
Frequently asked questions about tracing in Metoro
## Why is the trace destination showing as "Unknown External Service"?
When Metoro monitors calls from services inside your cluster to external services, it uses a combination of client-side tracing and DNS resolution to identify the destination services. Here's how it works:
### The Process
1. **Client-Side Tracing**:
Metoro monitors all calls made from inside your cluster to external services. For example, when Service A (inside your cluster) calls Service B (outside your cluster), through client-side traces, Metoro can see the IP address of the destination.
2. **Protocol-Specific Resolution**:
**HTTP/HTTPS Protocols**:
For HTTP-based protocols, the destination hostname is present in the request headers. Metoro directly uses this hostname without needing additional DNS resolution. This provides accurate service identification for HTTP/HTTPS calls.
**Other Protocols (Redis, MongoDB, etc.)**:
For protocols where hostname isn't part of the protocol data, Metoro captures DNS resolution results when the connection is first established. This information is saved to a key-value store (Redis node running in your cluster). The stored mapping helps identify services in subsequent traces.
3. **IP Resolution Process**:
When exporters encounter a trace with an unknown IP address (external cluster IP), they attempt to resolve it by looking up the IP in the key-value store. If the IP address cannot be found in the key-value store, the service gets labeled as "External Unknown Service".
The DNS resolution results are stored with different retention periods based on your tier:
* Hobby tier: DNS results are stored for 1 hour
* Scale tier: DNS results are stored for 1 week
This becomes important for long-lived connections, especially with protocols like Redis. For example, if you're using Redis in the Hobby tier and your connection stays alive for more than an hour, subsequent traces might show "Unknown External Service". This happens because the original DNS resolution has expired, but the connection is still active and no new DNS resolution has occurred.
If a container makes a request to an IP address without making a DNS query that resolves to that IP, it will be shown as "Unknown External Service". Here's an example:
```python
import requests
# Example 1: HTTP request directly to IP
# This will show as "Unknown External Service" because no DNS query is made
response = requests.get("http://1.2.3.4:8080/api/data")
# Example 2: Using hostname
# This will show the proper service name because DNS resolution occurs
response = requests.get("http://api.example.com/api/data")
```
## What are the different types of traces in Metoro?
Metoro captures two main types of traces to provide comprehensive visibility into your service communications.
### Client-Side Traces
Client-side traces are generated by inspecting the outgoing system calls from services within your cluster. When Service A makes requests, Metoro monitors these calls at the system level to understand the destination IP address, the protocol being used, the timing of the request, and other relevant metadata.
### Server-Side Traces
Server-side traces are generated when your services receive incoming requests. These traces provide information about the incoming request details, how your service processed the request, the response sent back, and performance metrics for the request handling. Server-side traces are particularly useful for understanding how your services handle incoming traffic.
By default, all traces you see are client-side traces when the client IP is within your cluster. However, for incoming calls from external sources (where the client IP is outside your cluster), Metoro automatically switches to using server-side traces.
### How do I know if a trace is a client-side or server-side trace?
You can identify the type of trace by looking at the trace attributes. If the attribute `metoro.is_server_span` is set to `true`, then it's a server-side trace. If this attribute is not present or set to `false`, then it's a client-side trace.
# OpenTelemetry Integration
Source: https://metoro.io/docs/traces/opentelemetry
This guide explains how to send distributed traces to Metoro using OpenTelemetry. Metoro supports the OpenTelemetry Protocol (OTLP) for trace ingestion, allowing you to send traces from any application or service that can export OpenTelemetry traces.
## Prerequisites
* A Metoro account
* An application configured with OpenTelemetry
## Pricing
Custom traces are billed at \$0.30 per GB.
## High Level Overview
The metoro exporter running in each cluster is a fully compliant OpenTelemetry collector. This means that you can send traces to Metoro using any OpenTelemetry compatible tracing library.
## Endpoint Configuration
Configure your OpenTelemetry exporter to send traces to:
```
http://metoro-exporter.metoro.svc.cluster.local:8080/api/v1/traces/otel
```
This endpoint is available within your Kubernetes cluster where the Metoro exporter is installed.
## Authentication
No additional authentication is required when sending traces from within the cluster to the Metoro exporter.
## OpenTelemetry Collector Configuration
If you're using the OpenTelemetry Collector to forward traces to Metoro, here's an example configuration:
```yaml
receivers:
otlp:
protocols:
http:
endpoint: 0.0.0.0:4318
grpc:
endpoint: 0.0.0.0:4317
processors:
batch:
timeout: 10s
send_batch_size: 1000
exporters:
otlphttp:
endpoint: http://metoro-exporter.metoro.svc.cluster.local:8080/api/v1/traces/otel
tls:
insecure: true # Since we're in-cluster
service:
pipelines:
traces:
receivers: [otlp]
processors: [batch]
exporters: [otlphttp]
```
This configuration:
* Receives traces via OTLP over both HTTP (4318) and gRPC (4317)
* Batches traces for efficient transmission
* Forwards traces to the Metoro exporter
* Uses insecure communication since we're within the cluster
## Language-Specific Examples
### Go
```go
package main
import (
"context"
"go.opentelemetry.io/otel"
"go.opentelemetry.io/otel/exporters/otlp/otlptrace/otlptracehttp"
"go.opentelemetry.io/otel/sdk/resource"
sdktrace "go.opentelemetry.io/otel/sdk/trace"
semconv "go.opentelemetry.io/otel/semconv/v1.24.0"
)
func initTracer() (*sdktrace.TracerProvider, error) {
ctx := context.Background()
exporter, err := otlptracehttp.New(ctx,
otlptracehttp.WithEndpoint("metoro-exporter.metoro.svc.cluster.local:8080"),
otlptracehttp.WithURLPath("/api/v1/traces/otel"),
otlptracehttp.WithInsecure(), // Since we're in-cluster
)
if err != nil {
return nil, err
}
resource := resource.NewWithAttributes(
semconv.SchemaURL,
semconv.ServiceName("your-service-name"),
)
tracerProvider := sdktrace.NewTracerProvider(
sdktrace.WithBatcher(exporter),
sdktrace.WithResource(resource),
sdktrace.WithSampler(sdktrace.AlwaysSample()),
)
otel.SetTracerProvider(tracerProvider)
return tracerProvider, nil
}
```
### Python
```python
from opentelemetry import trace
from opentelemetry.exporter.otlp.proto.http.trace_exporter import OTLPSpanExporter
from opentelemetry.sdk.resources import Resource
from opentelemetry.sdk.trace import TracerProvider
from opentelemetry.sdk.trace.export import BatchSpanProcessor
def init_tracer():
exporter = OTLPSpanExporter(
endpoint="http://metoro-exporter.metoro.svc.cluster.local:8080/api/v1/traces/otel",
insecure=True # Since we're in-cluster
)
resource = Resource.create({
"service.name": "your-service-name"
})
provider = TracerProvider(resource=resource)
processor = BatchSpanProcessor(exporter)
provider.add_span_processor(processor)
trace.set_tracer_provider(provider)
return provider
```
### Node.js
```javascript
const { NodeTracerProvider } = require('@opentelemetry/sdk-trace-node');
const { OTLPTraceExporter } = require('@opentelemetry/exporter-trace-otlp-http');
const { Resource } = require('@opentelemetry/resources');
const { SemanticResourceAttributes } = require('@opentelemetry/semantic-conventions');
const { BatchSpanProcessor } = require('@opentelemetry/sdk-trace-base');
const resource = new Resource({
[SemanticResourceAttributes.SERVICE_NAME]: 'your-service-name',
});
const traceExporter = new OTLPTraceExporter({
url: 'http://metoro-exporter.metoro.svc.cluster.local:8080/api/v1/traces/otel',
headers: {},
});
const provider = new NodeTracerProvider({
resource: resource,
});
provider.addSpanProcessor(new BatchSpanProcessor(traceExporter));
provider.register();
```
## Attributes and Context
When sending traces via OpenTelemetry, you can include additional attributes that will be indexed and searchable in Metoro:
* Use resource attributes to define static information about the service
* Use span attributes to include dynamic information with each span
* Link spans with logs using trace context propagation
* Add custom attributes to spans for business-specific data
## Best Practices
1. **Sampling**: Configure appropriate sampling rates based on your traffic volume
2. **Span Names**: Use descriptive span names that identify the operation
3. **Error Handling**: Set span status to error when exceptions occur
4. **Attributes**: Add relevant attributes but avoid excessive data
5. **Context Propagation**: Properly propagate trace context across service boundaries
## Troubleshooting
If you encounter issues with OpenTelemetry trace ingestion:
1. Verify your endpoint URL is correct
2. Check your network connectivity to the Metoro OTLP endpoint
3. Enable debug logging in your OpenTelemetry SDK
4. Verify your traces appear in the Metoro traces view
5. Contact support if issues persist
## Additional Resources
* [OpenTelemetry Documentation](https://opentelemetry.io/docs/)
* [OpenTelemetry Specification](https://github.com/open-telemetry/opentelemetry-specification)
# Traces Overview
Source: https://metoro.io/docs/traces/overview
Understanding and utilizing traces in Metoro
Traces are a powerful tool to understand the flow of requests through your services. Metoro provides a centralized
location to view and query traces with zero configuration required. Traces are automatically generated for all your
services, including third party services through eBPF.
## How Tracing Works in Metoro
Metoro uses eBPF technology at its core to provide comprehensive tracing capabilities. The Metoro node agent runs on every host in your cluster and monitors all network calls, deserializing them to inspect the underlying protocols and create traces.
This means that you don't need to instrument your code to get tracing data. You can just start using Metoro and get traces for all your services, including third party services.
### Supported Protocols
Metoro currently supports tracing for the following protocols:
* HTTP(s)
* gRPC
* Postgres
* MySQL
* Redis
* Memcache
* MongoDB
* Kafka
* Cassandra
Every request made using these protocols from any container in your cluster is automatically recorded and sent to Metoro's observability backend for inspection.
### HTTPs Support
Metoro supports HTTPS tracing through eBPF instrumentation of SSL libraries (like OpenSSL and BoringSSL) within the binary itself. When calls to read or write TLS are made, Metoro inspects the unencrypted content at the kernel level, without modifying any application code.
## Trace Attributes
Each trace is enriched with various attributes depending on the protocol. Common attributes across all protocols include:
* Client namespace
* Server namespace
* Client container ID
* Server container ID
* Client availability zone
* Server availability zone
* Server service name
* Client service name
Protocol-specific attributes are also captured. For example, HTTP traces include:
* HTTP path
* HTTP status code
* HTTP URL
* HTTP host
* HTTP flavor
* Request duration
For database protocols, Metoro decodes and records the actual queries, providing visibility into every database operation.
## Trace Redaction
Metoro provides comprehensive trace redaction capabilities to protect sensitive information in your traces. For detailed information about configuring and managing trace redaction, see the [Trace Redaction](/traces/redaction) documentation.
## The Trace View
The trace view provides a powerful interface to explore and analyze your traces across all clusters. You can filter traces using:
* Any trace attribute
* Regex search patterns
* Time-based filtering
You can use regex search on any trace attribute by using the syntax `attribute = regex: `. For example:
* `service.name = regex: .*metoro.*` will match traces from any service containing "metoro"
* `http.path = regex: /api/v1/.*` will match HTTP paths starting with "/api/v1/"
* `http.status_code = regex: ^5.*` will match all 5XX status codes

## Service Map Generation
Metoro automatically generates [service maps](/concepts/overview) based on the traced communications between services. This provides a visual representation of how your services interact with each other, making it easier to understand your application's architecture and dependencies.
### Bring Your Own Tracing (OpenTelemetry)
eBPF tracing is a powerful tool, but it does have some limitations, it does not support all protocols and does not currently support distributed tracing (ebpf creates individual spans but is unable to track chains of request calls currently). If you are already using OpenTelemetry, you can send your traces to Metoro by configuring the [OpenTelemetry Collector](https://opentelemetry.io/docs/collector/) to send traces to Metoro.
The Metoro exporter is a fully compliant opentelemetry collector, so you can send your traces to Metoro to be queried and visualized.
Follow the guide at [OpenTelemetry Tracing Integration](/traces/opentelemetry)
## RED Metrics Generation
The trace data is used to generate various RED Metrics (Rate, Errors, Duration), including:
* Request metrics
* Error metrics
* Duration metrics
These metrics are available in the [Service View](/concepts/overview) or in [Custom Dashboards](/dashboards/overview) and provide valuable insights into your application's performance and behavior.
Discover how Metoro organizes and visualizes your service data
# Trace Redaction
Source: https://metoro.io/docs/traces/redaction
Configure and manage trace redaction rules to protect sensitive information
Trace redaction allows you to protect sensitive information in your traces before they are stored. This feature is essential
for maintaining data privacy and compliance while still getting the full benefits of tracing.
## How Trace Redaction Works
Metoro provides the ability to redact sensitive information from your traces before they are stored. This is particularly useful for protecting sensitive data like:
* User IDs in URLs
* Account numbers in paths
* Authentication tokens
* Personal information in query parameters
The redaction process follows these steps:
1. **Pattern Matching**: Define regex patterns in [re2](https://github.com/google/re2/wiki/Syntax) format to match sensitive information in URLs and paths
2. **Service-Specific Rules**: Apply redaction rules to specific services or globally across all services
3. **Replacement**: Replace matched patterns with custom text (e.g., replace user IDs with "\[REDACTED]")
Redaction is applied to both:
* `http.url` attributes (full URLs)
* `http.path` attributes (path components)
## Configuration
Redaction rules can be configured in the Settings page. To add a new redaction rule:
1. Navigate to **Settings**
2. Select the **Data Ingestion Settings** tab
3. Click on **Trace Redactions** in the left sidebar
4. Click the **Add Rule** button in the top right corner

The same view will show you all your current redaction rules, allowing you to manage and remove existing rules as needed.
Each rule consists of:
* Environments (default is all environments)
* Service names (default is all services)
* Pattern (regex to match text to redact)
* Replacement text (text to replace matched text with)
For example, to redact user IDs from a URL path:
* Pattern: `/users/(\d+)`
* Replacement: `/users/[REDACTED_USER_ID]`

Make sure to test your redaction regex rules in a regex tester before saving!
You can test your regex rules in the modal above by clicking "Test Regex" button, or use an online regex tester.

## Reliability Features
The redaction system includes several reliability features:
* **Invalid Pattern Handling**: If a regex pattern is invalid, the original URL is preserved
* **Synchronization**: Background process keeps redaction rules up-to-date
* **Environment Isolation**: Rules can be scoped to specific environments
## Order of Operations
1. Traces are collected from your services by the `metoro-node-agent` component running in your cluster
2. The collected traces are sent to the `metoro-exporter` component, also running in your cluster
3. In the `metoro-exporter`:
* Redaction rules are validated and compiled
* Rules are applied based on service name and environment matches
* Both client and server service names are checked against the rules
* Matching traces are redacted according to the rules
4. Only after redaction are the traces sent to Metoro's observability backend for storage and display
The `metoro-exporter` automatically resyncs the redaction rules every minute to ensure it has the latest configuration. This means that any changes you make to redaction rules will be picked up automatically within a minute, without requiring a manual restart.
This architecture ensures that sensitive information never leaves your cluster and is redacted before it reaches any external system, including Metoro's observability backend. The redaction happens as close to the source as possible, providing an additional layer of security for your sensitive data.
## Important Note About Rule Order
The order in which redaction rules are applied is non-deterministic. Therefore, you should design your redaction rules to be independent of each other. For example:
❌ Incorrect approach (rules depending on order):
```
Rule 1: Pattern: `/users/(\d+)/details` → `/users/[ID]/details`
Rule 2: Pattern: `/users/[ID]` → `/[REDACTED]`
```
✅ Correct approach (independent rules):
```
Rule 1: Pattern: `/users/(\d+)/details` → `/users/[REDACTED_ID]/details`
Rule 2: Pattern: `/users/(\d+)` → `/users/[REDACTED_ID]`
```
Each rule should be self-contained and not rely on the output of other rules. This ensures consistent redaction regardless of the order of application.
## Troubleshooting
If your trace redaction rules are not working as expected, here are some common issues and solutions:
1. **Invalid Regex Patterns**
* Make sure your regex patterns are valid [re2](https://github.com/google/re2/wiki/Syntax) expressions
* Invalid regex patterns will not compile and therefore will not be applied to trace endpoints
* Use the "Test Regex" feature in the UI or an online regex tester to validate your patterns
2. **Attribute Limitations**
* Currently, redactions are only applied to `http.path` and `http.url` attributes
* If you need to redact data from different attributes, please contact the Metoro team for support.
# Service Map
Source: https://metoro.io/docs/traces/service-map
Visualize and analyze service-to-service communication in your clusters
## Overview
The service map is a powerful visualization tool in Metoro that displays connections between services in your cluster. Built on [trace data](/traces/overview), it provides insights into:
* Service-to-service communication within your cluster
* External client requests entering your cluster
* Outbound requests from your services to external dependencies
## How It Works
The service map is dynamically generated from trace data by:
1. Analyzing each request's client and server containers
2. Identifying service boundaries
3. Creating visual connections between communicating services
4. Detecting external traffic patterns
## Use Cases
1. **Change Tracking**:
* Track configuration changes
* Monitor scaling events
* Debug resource modifications
2. **Resource Analysis**:
* Count resources by type
* Monitor replica counts
* Track resource distribution
3. **Historical Debugging**:
* View past cluster states
* Analyze resource evolution
* Investigate incidents
## Best Practices
1. **Resource Monitoring**:
* Track critical resource counts
* Monitor scaling patterns
* Set up alerts for unexpected changes
2. **Historical Analysis**:
* Use time-travel for debugging
* Compare states across time periods
* Track configuration evolution
3. **Metric Usage**:
* Group resources meaningfully
* Track relevant attributes
* Combine with other metric types
# Log Ingestion Settings
Source: https://metoro.io/docs/logs/ingestion-settings
Metoro provides granular control over which logs are sent from your cluster for ingestion. You can configure inclusion and exclusion patterns to manage your log data effectively.

## Overview
Log ingestion settings allow you to:
* Include only specific logs that match certain patterns
* Exclude sensitive or unnecessary logs from being sent out of your cluster
* Apply filters based on services or namespaces
* Control log ingestion across different environments
## Configuring Log Filters
You can configure log filters from the [settings page](https://us-east.metoro.io/settings) under the **Data Ingestion Settings -> Log Filters** tab.
Each log filter consists of:
1. **Include/Exclude Pattern**: Choose whether to include or exclude logs that match your filter
2. **Environment Selection**: Apply the filter to specific environments or all environments
3. **Filter Type**: Choose between filtering by specific services or namespaces
4. **Pattern Matching**: Define regex patterns in [re2](https://github.com/google/re2/wiki/Syntax) to match log content
### Include Filters
Include filters allow you to specify which logs should be sent to Metoro. Only logs matching these patterns will be **sent out of your cluster**. This is useful when you want to:
* Only collect logs from specific services
* Only ingest logs containing certain patterns
* Limit log ingestion to specific namespaces
### Exclude Filters
Exclude filters prevent matching logs from being sent to Metoro. This is useful for:
* Protecting sensitive data
* Reducing noise from verbose logging
* Managing ingestion costs
* Filtering out unnecessary debug logs
## Best Practices
1. **Start with Broad Patterns**: Begin with broader patterns and refine them based on your needs
2. **Test Your Patterns**: Use the regex pattern carefully to ensure you're not accidentally excluding important logs
3. **Regular Review**: Periodically review your filters to ensure they still align with your needs
4. **Adjust log alerts**: If you have log alerts set up, make sure they are up to date with your log filters
## Examples
Here are some common use cases for log filters:
1. **Exclude Sensitive Data**
```
Type: Exclude
Environment: All Environments
Filter Type: Service
Services: /k8s/authorization/auth-service
Pattern: password=.*
```
This filter will exclude logs containing the pattern `password=.*` from the `auth-service` service in `authorization` namespace in all environments.
2. **Include Only Error Logs**
```
Type: Include
Environment: All Environments
Pattern: .*ERROR.*|.*FATAL.*
Filter Type: Namespace
Namespaces: namespaceX
```
This filter will include logs containing the patterns `ERROR` or `FATAL` from all services in the `namespaceX` namespace in all environments.
3. **Exclude Debug Logs**
```
Type: Exclude
Environment: dev
Pattern: .*DEBUG.*
Filter Type: Service
Services: All Services
```
This filter will exclude logs containing the pattern `DEBUG` from all services in the `dev` environment.
# OpenTelemetry Integration
Source: https://metoro.io/docs/logs/opentelemetry
This guide explains how to send additional logs to Metoro using OpenTelemetry. Metoro supports the OpenTelemetry Protocol (OTLP) for log ingestion, allowing you to send logs from any application or service that can export OpenTelemetry logs.
## Prerequisites
* A Metoro account
* An application configured with OpenTelemetry
## Pricing
Custom logs are billed at \$0.30 per GB.
## High Level Overview
The metoro exporter running in each cluster is a fully compliant OpenTelemetry collector. This means that you can send logs to Metoro using any OpenTelemetry compatible tracing library.
## Endpoint Configuration
Configure your OpenTelemetry exporter to send logs to:
```
http://metoro-exporter.metoro.svc.cluster.local/api/v1/send/logs/otel
```
This endpoint is available within your Kubernetes cluster where the Metoro exporter is installed.
## Authentication
No additional authentication is required when sending logs from within the cluster to the Metoro exporter.
## OpenTelemetry Collector Configuration
If you're using the OpenTelemetry Collector to forward logs to Metoro, here's an example configuration:
```yaml
receivers:
otlp:
protocols:
http:
endpoint: 0.0.0.0:4318
grpc:
endpoint: 0.0.0.0:4317
processors:
batch:
timeout: 10s
send_batch_size: 1000
exporters:
otlphttp:
endpoint: http://metoro-exporter.metoro.svc.cluster.local:8080/api/v1/logs/otel
tls:
insecure: true # Since we're in-cluster
service:
pipelines:
logs:
receivers: [otlp]
processors: [batch]
exporters: [otlphttp]
```
This configuration:
* Receives logs via OTLP over both HTTP (4318) and gRPC (4317)
* Batches logs for efficient transmission
* Forwards logs to the Metoro exporter
* Uses insecure communication since we're within the cluster
## Language-Specific Examples
### Go
```go
package main
import (
"context"
"go.opentelemetry.io/otel"
"go.opentelemetry.io/otel/exporters/otlp/otlplog/otlploghttp"
"go.opentelemetry.io/otel/sdk/resource"
sdklog "go.opentelemetry.io/otel/sdk/log"
semconv "go.opentelemetry.io/otel/semconv/v1.24.0"
)
func initLogger() (*sdklog.LoggerProvider, error) {
ctx := context.Background()
exporter, err := otlploghttp.New(ctx,
otlploghttp.WithEndpoint("metoro-exporter.metoro.svc.cluster.local:8080"),
otlploghttp.WithURLPath("/api/v1/logs/otel"),
otlploghttp.WithInsecure(), // Since we're in-cluster
)
if err != nil {
return nil, err
}
resource := resource.NewWithAttributes(
semconv.SchemaURL,
semconv.ServiceName("your-service-name"),
)
loggerProvider := sdklog.NewLoggerProvider(
sdklog.WithBatcher(exporter),
sdklog.WithResource(resource),
)
return loggerProvider, nil
}
```
### Python
```python
from opentelemetry import trace
from opentelemetry.exporter.otlp.proto.http.trace_exporter import OTLPSpanExporter
from opentelemetry.sdk.resources import Resource
from opentelemetry.sdk.trace import TracerProvider
from opentelemetry.sdk.trace.export import BatchSpanProcessor
def init_logger():
exporter = OTLPSpanExporter(
endpoint="http://metoro-exporter.metoro.svc.cluster.local:8080/api/v1/logs/otel",
insecure=True # Since we're in-cluster
)
resource = Resource.create({
"service.name": "your-service-name"
})
provider = TracerProvider(resource=resource)
processor = BatchSpanProcessor(exporter)
provider.add_span_processor(processor)
return provider
```
### Node.js
```javascript
const { LoggerProvider } = require('@opentelemetry/sdk-logs');
const { OTLPLogExporter } = require('@opentelemetry/exporter-logs-otlp-http');
const { Resource } = require('@opentelemetry/resources');
const { SemanticResourceAttributes } = require('@opentelemetry/semantic-conventions');
const resource = new Resource({
[SemanticResourceAttributes.SERVICE_NAME]: 'your-service-name',
});
const logExporter = new OTLPLogExporter({
url: 'http://metoro-exporter.metoro.svc.cluster.local:8080/api/v1/logs/otel',
headers: {},
});
const loggerProvider = new LoggerProvider({
resource: resource,
});
loggerProvider.addLogRecordProcessor(new BatchLogRecordProcessor(logExporter));
```
## Attributes and Context
When sending logs via OpenTelemetry, you can include additional attributes that will be indexed and searchable in Metoro:
* Use resource attributes to define static information about the service
* Use log attributes to include dynamic information with each log entry
* Link logs with traces using trace context propagation
## Troubleshooting
If you encounter issues with OpenTelemetry log ingestion:
1. Verify your endpoint URL and API key are correct
2. Check your network connectivity to the Metoro OTLP endpoint
3. Enable debug logging in your OpenTelemetry SDK
4. Verify your logs appear in the Metoro logs view
5. Contact support if issues persist
## Additional Resources
* [OpenTelemetry Documentation](https://opentelemetry.io/docs/)
* [OpenTelemetry Specification](https://github.com/open-telemetry/opentelemetry-specification)
# Logs Overview
Source: https://metoro.io/docs/logs/overview
Metoro provides comprehensive logging capabilities by capturing every log emitted from all containers in your infrastructure. It automatically collects both standard output (stdout) and standard error (stderr) from every container, aggregating them in a centralized platform for easy access and analysis.
The log view is accessible from the left sidebar [or here](https://us-east.metoro.io/logs).

## Log Search and Performance
The log view allows you to filter logs using multiple methods:
* Regex search using [re2](https://github.com/google/re2/wiki/Syntax) format
* Attribute-based filtering
* Time range selection
* Clauses are combined with AND, by default
You can use regex search on any attribute by using the syntax `attribute = regex: `. For example:
* `service.name = regex: .*metoro.*` will match logs from any service containing "metoro"
* `message = regex: error|warning` will match logs containing "error" or "warning"
* `kubernetes.container.name = regex: ^api-.*` will match containers starting with "api-"
Metoro's logging system is highly performant, capable of searching through billions of logs in seconds.
## Default Attributes
Each log entry is automatically tagged with several default attributes:
* Container ID (the unique id of the container that emitted the log)
* Environment
* Namespace (the namespace the container belongs to)
* Service name (the service the container belongs to)
* Host (source of the log)
## Structured Logs
Metoro automatically parses structured JSON logs and other formats like LogZero, making every field searchable. Key features include:
* Automatic parsing of JSON log formats and LogZero format
* Flattening of nested JSON structures using dot notation
* Every key and value is indexed for searching
* Similar search performance to regex searches when filtering by specific JSON fields
For detailed information about structured log parsing and best practices, see our [Structured Logs Guide](/logs/structured-logs).
## Log Clustering and Hashing
Metoro implements an intelligent log clustering system that:
* Assigns unique hashes to similar log lines
* Groups logs that are similar but differ in dynamic elements (like timestamps)
* Enables searching for similar types of errors using hash-based clustering
* Helps identify patterns in your logs more effectively
You can see this as the pattern.hash attribute in each log entry.
## Log Analytics and Alerting
Beyond basic log viewing and searching, Metoro provides advanced analytics capabilities:
* Chart log volume over time - apply filters and group logs by any attribute
* Create visualizations filtered by specific log patterns
* Build alerts based on log patterns and frequencies
## Bring your own Logs (OpenTelemetry Log Ingestion)
In addition to automatically collecting container logs, Metoro supports ingesting logs from any source that implements the OpenTelemetry protocol. This allows you to:
* Send logs from applications running outside your Kubernetes cluster
* Integrate existing logging pipelines with Metoro
* Maintain a unified logging experience across all your infrastructure
To learn more about setting up OpenTelemetry log ingestion, see our [OpenTelemetry Log Integration Guide](/logs/opentelemetry).
# Structured Logs
Source: https://metoro.io/docs/logs/structured-logs
Metoro provides advanced parsing capabilities for structured logs, automatically extracting and indexing fields from various log formats. This makes your structured logs fully searchable and helps you get more value from your logging data.
## JSON Structured Logs
Metoro automatically detects and parses JSON-formatted logs. When a log entry is in JSON format, Metoro will:
1. Extract all fields from the JSON object
2. Flatten nested JSON structures using dot notation
3. Index all fields for searching
4. Handle the message field specially
For example, if your log entry is:
```json
{
"service": "payment-processor",
"region": "us-west",
"error": {
"code": 500,
"details": "Database connection failed"
},
"msg": "Transaction processing failed"
}
```
Metoro will:
1. Extract and index these fields:
* `service: "payment-processor"`
* `region: "us-west"`
* `error.code: "500"`
* `error.details: "Database connection failed"`
2. Use the `msg` field as the main log message
3. Make all fields searchable using attribute filters
You can then search for these logs using attribute filters like:
* `error.code = "500"`
* `service = "payment-processor"`
* `error.details = regex: .*connection.*`
### Message Field Handling
For JSON-formatted logs, Metoro looks for a dedicated message field in this order:
1. `msg` field
2. `message` field
3. If neither exists, the entire JSON object is preserved as the log body
Make sure to include a `msg` or `message` field in your JSON logs for better readability.
Move all other fields to log attributes for easy searching
For example, this JSON log:
```json
{
"timestamp": "2024-03-15T10:30:00Z",
"level": "error",
"service": "order-service",
"msg": "Failed to process order",
"order_id": "12345",
"error_code": 500
}
```
Will be displayed as:
* **Log Message**: "Failed to process order"
* **Log Attributes**:
* `timestamp: "2024-03-15T10:30:00Z"`
* `level: "error"`
* `service: "order-service"`
* `order_id: "12345"`
* `error_code: "500"`
This makes your logs more readable while keeping all fields searchable.
## LogZero Format
Metoro also supports the LogZero format, which follows this pattern:
```
[LEVEL DATE TIME module:line] message
```
For example:
```
[I 250313 16:24:23 my_handler:160] Request processed successfully
```
When parsing LogZero format, Metoro extracts:
* `level`: Log level (I=info, D=debug, W=warning, E=error, C=critical)
* `module`: The module name
* `line`: The line number
* Remaining text:
* Becomes the log message if the message is not JSON-formatted
* Is parsed as JSON if the message is JSON-formatted
These fields are then indexed and made searchable like any other log attribute.
## Best Practices
1. **Use Consistent Formats**: Stick to a consistent log format across your services
2. **Include Essential Fields**: Always include:
* Timestamp
* Service name
* Log level/severity
* A clear message field
3. **Structured Data**: Use JSON formatting for logs when possible
4. **Nested Data**: Feel free to use nested JSON objects - Metoro will flatten them automatically
5. **Field Naming**: Use clear, consistent field names across your services
## Searching Structured Logs
You can search through structured log fields using:
1. **Exact matches**: `field = "value"`
2. **Regex matches**: `field = regex: pattern`
3. **Multiple values**: `field = ["value1", "value2"]`
4. **Nested fields**: `parent.child = "value"`
For example:
```
error.code = "500"
service.name = regex: .*api.*
environment = ["prod", "staging"]
```
# null
Source: https://metoro.io/docs/logs/vector
# Sending Logs with Vector
This guide demonstrates how to send logs to Metoro using Vector and the OpenTelemetry Collector. This setup provides a robust and scalable way to collect and forward logs to Metoro.
For a complete working example, see our [Vector Logs Example](https://github.com/metoro-io/metoro_examples/tree/main/logs/vector) repository.
You must add a `service.name` attribute to your logs. This attribute is required by Metoro to properly organize and display your logs. You can set this using Vector's transforms (shown below) or directly in your application logging configuration.
## Architecture
The setup consists of two main components:
1. **Vector**: Acts as the log collector and forwarder. In this example, it generates sample syslog messages and forwards them to the OpenTelemetry Collector.
2. **OpenTelemetry Collector**: Receives logs from Vector, processes them, and forwards them to Metoro in the correct OpenTelemetry format.
```mermaid
%%{init: {
'theme': 'dark',
'themeVariables': {
'fontFamily': 'Inter',
'primaryColor': '#151F32',
'primaryTextColor': '#EBF1F7',
'primaryBorderColor': '#3793FF',
'lineColor': '#334670',
'secondaryColor': '#151F32',
'tertiaryColor': '#151F32',
'mainBkg': '#151F32',
'nodeBorder': '#3793FF',
'clusterBkg': '#182338',
'titleColor': '#EBF1F7',
'edgeLabelBackground': '#151F32',
'clusterBorder': '#334670'
},
'maxZoom': 2,
'minZoom': 0.5,
'zoom': true
}}%%
flowchart LR
A[Your External Applications] --> B[Vector]
B -->|Syslog TCP| C[OpenTelemetry Collector]
C -->|OTLP HTTP| D[Metoro Exporter]
style A fill:#182338,stroke:#3793FF,color:#EBF1F7
style B fill:#182338,stroke:#3793FF,color:#EBF1F7
style C fill:#182338,stroke:#3793FF,color:#EBF1F7
style D fill:#182338,stroke:#3793FF,color:#EBF1F7
```
## Vector Configuration
Vector needs to be configured to forward logs to the OpenTelemetry Collector. Here's the sink configuration:
```yaml
transforms:
add_service_name:
type: remap
inputs: ["your_source_name"]
source: |
# Add a service name to help organize logs in Metoro
.service.name = "your-service-name"
sinks:
syslog_sink:
type: socket
inputs: ["add_service_name"] # Use the transform output
address: "otel-collector:1514" # Address of your OpenTelemetry Collector
mode: "tcp"
encoding:
codec: "text"
```
### Vector Source Options
Vector supports many different sources for collecting logs:
* `kubernetes_logs`: Collect logs from Kubernetes containers
* `file`: Read logs from files
* `syslog`: Accept syslog messages
* `journald`: Read from systemd journal
* And [many more](https://vector.dev/docs/reference/configuration/sources/)
## OpenTelemetry Collector Configuration
The OpenTelemetry Collector needs to be configured to receive logs from Vector and forward them to Metoro. Here's the configuration:
```yaml
receivers:
# Configure the syslog receiver
syslog:
tcp:
listen_address: 0.0.0.0:1514
protocol: rfc5424
processors:
# Batch logs for efficient processing
batch:
timeout: 1s
send_batch_size: 4096
exporters:
# Configure the Metoro exporter
otlphttp:
endpoint: "http://metoro-exporter.metoro.svc.cluster.local/api/v1/send/logs/otel"
logs_endpoint: "http://metoro-exporter.metoro.svc.cluster.local/api/v1/send/logs/otel"
insecure: true
service:
# Set up the processing pipeline
pipelines:
logs:
receivers: [syslog]
processors: [batch]
exporters: [otlphttp]
```
### OpenTelemetry Collector Components
1. **Receivers**: Configure how the collector receives data
* In this case, we use the syslog receiver on port 1514
* Supports RFC5424 format syslog messages
2. **Processors**: Configure data processing
* Batch processor groups logs for efficient sending
* Adjustable timeout and batch size settings
3. **Exporters**: Configure where to send the data
* Uses OTLP HTTP protocol to send to Metoro
* Endpoint points to your Metoro instance
## Customization
### Log Sources
To collect logs from your applications, configure an appropriate Vector source for your use case. See the [Vector documentation](https://vector.dev/docs/reference/configuration/sources/) for available source types and their configurations.
### Batch Settings
Adjust the batch processor settings in the OpenTelemetry Collector for your needs:
```yaml
processors:
batch:
timeout: 1s # Increase for higher latency tolerance
send_batch_size: 4096 # Adjust based on log volume
```
## Troubleshooting
Common issues and solutions:
1. **Vector can't connect to the OpenTelemetry Collector**:
* Verify the collector address is correct
* Check that the collector is listening on the specified port
* Ensure network connectivity between Vector and the collector
2. **Logs not appearing in Metoro**:
* Check the OpenTelemetry Collector logs for errors
* Verify the Metoro endpoint is correct
* Check that logs are being received by the collector
## Next Steps
* Configure Vector to collect your application logs
* Add filters and transforms in Vector to process logs
* Set up monitoring for Vector and the OpenTelemetry Collector
* Configure log retention and archival policies
# OpenTelemetry Integration
Source: https://metoro.io/docs/metrics/custom-metrics
How to send custom metrics to Metoro via OpenTelemetry
This guide explains how to send custom metrics to Metoro using OpenTelemetry. Metoro supports the OpenTelemetry Protocol (OTLP) for metric ingestion, allowing you to send metrics from any application or service that can export OpenTelemetry metrics.
## Prerequisites
* A Metoro account
* An application configured with OpenTelemetry
## High Level Overview
The Metoro exporter running in each cluster is a fully compliant OpenTelemetry collector. This means that you can send metrics to Metoro using any OpenTelemetry compatible metrics library.
## Endpoint Configuration
Configure your OpenTelemetry exporter to send metrics to:
```
http://metoro-exporter.metoro.svc.cluster.local/api/v1/custom/otel/metrics
```
This endpoint is available within your Kubernetes cluster where the Metoro exporter is installed.
## Authentication
No additional authentication is required when sending metrics from within the cluster to the Metoro exporter.
## Language-Specific Examples
### Python
Here's an example Python script that publishes deployment metrics to Metoro:
```python
import sys
from kubernetes import client, config
from opentelemetry import metrics
from opentelemetry.exporter.otlp.proto.http.metric_exporter import OTLPMetricExporter
from opentelemetry.sdk.metrics import MeterProvider
from opentelemetry.sdk.metrics.export import (
PeriodicExportingMetricReader,
)
# Main
if __name__ == "__main__":
metric_reader = PeriodicExportingMetricReader(
OTLPMetricExporter(endpoint="http://metoro-exporter.metoro.svc.cluster.local/api/v1/custom/otel/metrics")
)
provider = MeterProvider(metric_readers=[metric_reader])
# Sets the global default meter provider
metrics.set_meter_provider(provider)
# Creates a meter from the global meter provider
meter = metrics.get_meter(__name__)
config.load_kube_config()
namespace = sys.argv[1]
app = client.AppsV1Api()
deployment_data = app.list_namespaced_deployment(namespace)
desired_replicas = meter.create_gauge("custom_metrics.desired_replicas")
available_replicas = meter.create_gauge("custom_metrics.available_replicas")
for item in deployment_data.items:
desired_replicas.set(item.status.replicas, {"deployment": item.metadata.name})
available_replicas.set(item.status.available_replicas, {"deployment": item.metadata.name})
# Make sure that all the metrics are exported before the application exits
provider.force_flush()
```
This script:
1. Creates two gauge metrics:
* `custom_metrics.desired_replicas` - The desired number of replicas for a deployment
* `custom_metrics.available_replicas` - The number of available replicas for a deployment
2. Includes a `deployment` attribute with the name of the deployment
3. Uses the OpenTelemetry SDK to export metrics to Metoro
### Go
```go
package main
import (
"context"
"go.opentelemetry.io/otel"
"go.opentelemetry.io/otel/exporters/otlp/otlpmetric/otlpmetrichttp"
"go.opentelemetry.io/otel/sdk/metric"
"go.opentelemetry.io/otel/sdk/resource"
semconv "go.opentelemetry.io/otel/semconv/v1.24.0"
)
func initMetrics() (*metric.MeterProvider, error) {
ctx := context.Background()
exporter, err := otlpmetrichttp.New(ctx,
otlpmetrichttp.WithEndpoint("metoro-exporter.metoro.svc.cluster.local"),
otlpmetrichttp.WithURLPath("/api/v1/custom/otel/metrics"),
otlpmetrichttp.WithInsecure(), // Since we're in-cluster
)
if err != nil {
return nil, err
}
resource := resource.NewWithAttributes(
semconv.SchemaURL,
semconv.ServiceName("your-service-name"),
)
meterProvider := metric.NewMeterProvider(
metric.WithReader(metric.NewPeriodicReader(exporter)),
metric.WithResource(resource),
)
return meterProvider, nil
}
```
### Node.js
```javascript
const { MeterProvider } = require('@opentelemetry/sdk-metrics');
const { OTLPMetricExporter } = require('@opentelemetry/exporter-metrics-otlp-http');
const { Resource } = require('@opentelemetry/resources');
const { SemanticResourceAttributes } = require('@opentelemetry/semantic-conventions');
const resource = new Resource({
[SemanticResourceAttributes.SERVICE_NAME]: 'your-service-name',
});
const metricExporter = new OTLPMetricExporter({
url: 'http://metoro-exporter.metoro.svc.cluster.local/api/v1/custom/otel/metrics',
headers: {},
});
const meterProvider = new MeterProvider({
resource: resource,
});
meterProvider.addMetricReader(new PeriodicExportingMetricReader({
exporter: metricExporter,
exportIntervalMillis: 1000,
}));
```
## Metric Types
OpenTelemetry supports several metric types that you can use:
1. **Counter** - A value that can only increase or be reset to zero
2. **Gauge** - A value that can arbitrarily go up and down
3. **Histogram** - Tracks the distribution of values over time
## Attributes and Context
When sending metrics via OpenTelemetry, you can include additional attributes that will be indexed and searchable in Metoro:
* Use resource attributes to define static information about the service
* Use metric attributes to include dynamic information with each metric value
* Link metrics with traces using trace context propagation
## Troubleshooting
If you encounter issues with OpenTelemetry metric ingestion:
1. Verify your endpoint URL is correct
2. Check your network connectivity to the Metoro OTLP endpoint
3. Enable debug logging in your OpenTelemetry SDK
4. Verify your metrics appear in the Metoro metrics view
5. Contact support if issues persist
## Additional Resources
* [OpenTelemetry Documentation](https://opentelemetry.io/docs/)
* [OpenTelemetry Metrics Specification](https://github.com/open-telemetry/opentelemetry-specification/blob/main/specification/metrics/data-model.md)
# Default Metrics
Source: https://metoro.io/docs/metrics/generated-metrics
This page lists all metrics that Metoro automatically generates for your containers and infrastructure.
## Common Kubernetes Attributes
All node and container metrics include the following Kubernetes attributes. These attributes provide detailed information about the node's infrastructure, architecture, and location:
### Node Information
* `kubernetes.io/hostname` - Node hostname
* `kubernetes.io/os` - Operating system (also available as `beta.kubernetes.io/os`)
* `kubernetes.io/arch` - CPU architecture (also available as `beta.kubernetes.io/arch`)
* `kubernetes.io/instance-type` - Instance type (also available as `node.kubernetes.io/instance-type`, `beta.kubernetes.io/instance-type`)
### Cloud Provider Information
* `k8s.io/cloud-provider-aws` - AWS cloud provider identifier
* `eks.amazonaws.com/nodegroup` - EKS node group name
* `eks.amazonaws.com/nodegroup-image` - EKS AMI image
* `eks.amazonaws.com/capacityType` - EKS capacity type
* `eks.amazonaws.com/sourceLaunchTemplateId` - EKS launch template ID
* `eks.amazonaws.com/sourceLaunchTemplateVersion` - EKS launch template version
### Location and Topology
* `topology.kubernetes.io/region` - Cloud provider region
* `topology.kubernetes.io/zone` - Availability zone
* `topology.k8s.aws/zone-id` - AWS zone ID
* `topology.ebs.csi.aws.com/zone` - EBS zone
* `failure-domain.beta.kubernetes.io/region` - Region (legacy label)
* `failure-domain.beta.kubernetes.io/zone` - Zone (legacy label)
### Karpenter-specific Information
* `karpenter.sh/nodepool` - Karpenter node pool
* `karpenter.sh/capacity-type` - Capacity type
* `karpenter.k8s.aws/instance-category` - AWS instance category
* `karpenter.k8s.aws/instance-family` - AWS instance family
* `karpenter.k8s.aws/instance-size` - AWS instance size
* `karpenter.k8s.aws/instance-generation` - AWS instance generation
* `karpenter.k8s.aws/instance-cpu` - CPU details
* `karpenter.k8s.aws/instance-cpu-manufacturer` - CPU manufacturer
* `karpenter.k8s.aws/instance-memory` - Memory capacity
* `karpenter.k8s.aws/instance-network-bandwidth` - Network bandwidth
* `karpenter.k8s.aws/instance-ebs-bandwidth` - EBS bandwidth
* `karpenter.k8s.aws/instance-hypervisor` - Hypervisor type
* `karpenter.k8s.aws/instance-local-nvme` - Local NVMe storage
### Other
* `pool` - Generic pool identifier
These attributes can be used for filtering and grouping metrics to analyze specific segments of your infrastructure.
## Container Attributes
* `instance` - The instance identifier
* `environment` - The environment name
* `container_name` - Name of the container
* `container_id` - Unique container identifier
* `service_name` - Name of the service the container belongs to
* `namespace` - Kubernetes namespace
* `pod_name` - Name of the pod
These attributes can be used for filtering and grouping metrics to analyze specific segments of your infrastructure.
## Node Metrics
### Node Information
| Metric Name | Type | Units | Attributes | Description |
| --------------------- | ----- | ------- | --------------------------------------------------------------------------------------------------------------------------------------------------------- | ----------------------------------------- |
| node\_info | gauge | - | hostname, kernel\_version | Meta information about the node |
| node\_cloud\_info | gauge | - | provider, account\_id, instance\_id, instance\_type, instance\_life\_cycle, region, availability\_zone, availability\_zone\_id, local\_ipv4, public\_ipv4 | Meta information about the cloud instance |
| node\_uptime\_seconds | gauge | seconds | - | Uptime of the node in seconds |
### Node Resource Metrics
| Metric Name | Type | Units | Attributes | Description |
| ------------------------------------------- | ------- | ------- | ---------- | ----------------------------------------- |
| node\_resources\_cpu\_usage\_seconds\_total | counter | seconds | mode | The amount of CPU time spent in each mode |
| node\_resources\_cpu\_logical\_cores | gauge | count | - | The number of logical CPU cores |
| node\_resources\_memory\_total\_bytes | gauge | bytes | - | The total amount of physical memory |
| node\_resources\_memory\_free\_bytes | gauge | bytes | - | The amount of unassigned memory |
| node\_resources\_memory\_available\_bytes | gauge | bytes | - | The total amount of available memory |
| node\_resources\_memory\_cached\_bytes | gauge | bytes | - | The amount of memory used as page cache |
### Node Disk Metrics
| Metric Name | Type | Units | Attributes | Description |
| -------------------------------------------------- | ------- | ------- | ---------- | ---------------------------------------------------- |
| node\_resources\_disk\_reads\_total | counter | count | device | The total number of reads completed successfully |
| node\_resources\_disk\_writes\_total | counter | count | device | The total number of writes completed successfully |
| node\_resources\_disk\_read\_bytes\_total | counter | bytes | device | The total number of bytes read from the disk |
| node\_resources\_disk\_written\_bytes\_total | counter | bytes | device | The total number of bytes written to the disk |
| node\_resources\_disk\_read\_time\_seconds\_total | counter | seconds | device | The total number of seconds spent reading |
| node\_resources\_disk\_write\_time\_seconds\_total | counter | seconds | device | The total number of seconds spent writing |
| node\_resources\_disk\_io\_time\_seconds\_total | counter | seconds | device | The total number of seconds the disk spent doing I/O |
### Node Network Metrics
| Metric Name | Type | Units | Attributes | Description |
| -------------------------------------- | ------- | ----- | ------------- | --------------------------------------- |
| node\_net\_received\_bytes\_total | counter | bytes | interface | The total number of bytes received |
| node\_net\_transmitted\_bytes\_total | counter | bytes | interface | The total number of bytes transmitted |
| node\_net\_received\_packets\_total | counter | count | interface | The total number of packets received |
| node\_net\_transmitted\_packets\_total | counter | count | interface | The total number of packets transmitted |
| node\_net\_interface\_up | gauge | - | interface | Status of the interface (0:down, 1:up) |
| node\_net\_interface\_ip | gauge | - | interface, ip | IP address assigned to the interface |
## Container Metrics
### Resource Metrics
| Metric Name | Type | Units | Attributes | Description |
| ---------------------------------------------------- | ------- | ------- | ----------------------------- | ------------------------------------------------------------------------------------------------- |
| container\_info | gauge | - | image, systemd\_triggered\_by | Meta information about the container |
| container\_restarts\_total | counter | count | - | Number of times the container was restarted |
| container\_resources\_cpu\_limit\_cores | gauge | cores | - | CPU limit of the container |
| container\_resources\_cpu\_usage\_seconds\_total | counter | seconds | - | Total CPU time consumed by the container |
| container\_resources\_cpu\_delay\_seconds\_total | counter | seconds | - | Total time duration processes of the container have been waiting for a CPU (while being runnable) |
| container\_resources\_cpu\_throttled\_seconds\_total | counter | seconds | - | Total time duration the container has been throttled |
| container\_resources\_memory\_limit\_bytes | gauge | bytes | - | Memory limit of the container |
| container\_resources\_memory\_rss\_bytes | gauge | bytes | - | Amount of physical memory used by the container (doesn't include page cache) |
| container\_resources\_memory\_cache\_bytes | gauge | bytes | - | Amount of page cache memory allocated by the container |
| container\_oom\_kills\_total | counter | count | - | Total number of times the container was terminated by the OOM killer |
### Disk Metrics
| Metric Name | Type | Units | Attributes | Description |
| ------------------------------------------------- | ------- | ------- | ---------------------------- | ------------------------------------------------------------------------------------- |
| container\_resources\_disk\_delay\_seconds\_total | counter | seconds | - | Total time duration processes of the container have been waiting for I/Os to complete |
| container\_resources\_disk\_size\_bytes | gauge | bytes | mount\_point, device, volume | Total capacity of the volume |
| container\_resources\_disk\_used\_bytes | gauge | bytes | mount\_point, device, volume | Used capacity of the volume |
| container\_resources\_disk\_reserved\_bytes | gauge | bytes | mount\_point, device, volume | Reserved capacity of the volume |
| container\_resources\_disk\_reads\_total | counter | count | mount\_point, device, volume | Total number of reads completed successfully by the container |
| container\_resources\_disk\_read\_bytes\_total | counter | bytes | mount\_point, device, volume | Total number of bytes read from the disk by the container |
| container\_resources\_disk\_writes\_total | counter | count | mount\_point, device, volume | Total number of writes completed successfully by the container |
| container\_resources\_disk\_written\_bytes\_total | counter | bytes | mount\_point, device, volume | Total number of bytes written to the disk by the container |
### Network Metrics
| Metric Name | Type | Units | Attributes | Description |
| ----------------------------------------------------- | ------- | ------- | ---------- | ----------------------------------------------------------- |
| container\_net\_tcp\_successful\_connects\_total | counter | count | - | Total number of successful TCP connects |
| container\_net\_tcp\_connection\_time\_seconds\_total | counter | seconds | - | Time spent on TCP connections |
| container\_net\_tcp\_failed\_connects\_total | counter | count | - | Total number of failed TCP connects |
| container\_net\_tcp\_active\_connections | gauge | count | - | Number of active outbound connections used by the container |
| container\_net\_tcp\_retransmits\_total | counter | count | - | Total number of retransmitted TCP segments |
| container\_net\_latency\_seconds | gauge | seconds | - | Round-trip time between the container and a remote IP |
| container\_net\_tcp\_bytes\_sent\_total | counter | bytes | - | Total number of bytes sent to the peer |
| container\_net\_tcp\_bytes\_received\_total | counter | bytes | - | Total number of bytes received from the peer |
| container\_net\_bytes\_sent\_total | counter | bytes | - | Total number of bytes sent by the container |
| container\_net\_bytes\_received\_total | counter | bytes | - | Total number of bytes received by the container |
### Application Metrics
| Metric Name | Type | Units | Attributes | Description |
| ----------------------------------- | ----- | ----- | ----------------- | ---------------------------------------------------------------------------------- |
| container\_application\_type | gauge | - | application\_type | Type of the application running in the container (e.g. memcached, postgres, mysql) |
| container\_golang\_binary\_location | gauge | - | binary\_location | Location of the Golang binary running in the container |
### JVM Metrics
| Metric Name | Type | Units | Attributes | Description |
| ---------------------------------------------- | ----- | ------- | ------------------ | ------------------------------------------------------------------------- |
| container\_jvm\_info | gauge | - | jvm, java\_version | Meta information about the JVM |
| container\_jvm\_heap\_size\_bytes | gauge | bytes | jvm | Total heap size in bytes |
| container\_jvm\_heap\_used\_bytes | gauge | bytes | jvm | Used heap size in bytes |
| container\_jvm\_gc\_time\_seconds | gauge | seconds | jvm, gc | Time spent in the given JVM garbage collector in seconds |
| container\_jvm\_safepoint\_time\_seconds | gauge | seconds | jvm | Time the application has been stopped for safepoint operations in seconds |
| container\_jvm\_safepoint\_sync\_time\_seconds | gauge | seconds | jvm | Time spent getting to safepoints in seconds |
### Python Metrics
| Metric Name | Type | Units | Attributes | Description |
| ---------------------------------------------------- | ----- | ------- | ---------- | ------------------------------------------- |
| container\_python\_thread\_lock\_wait\_time\_seconds | gauge | seconds | - | Time spent waiting acquiring GIL in seconds |
### Protocol-Specific Request Metrics
| Metric Name | Type | Units | Description |
| ------------------------------------ | ------- | ----- | ----------------------------------------------------------------------- |
| container\_http\_requests\_total | counter | count | Total number of outbound HTTP requests |
| container\_postgres\_queries\_total | counter | count | Total number of outbound Postgres queries |
| container\_redis\_queries\_total | counter | count | Total number of outbound Redis queries |
| container\_memcached\_queries\_total | counter | count | Total number of outbound Memcached queries |
| container\_mysql\_queries\_total | counter | count | Total number of outbound Mysql queries |
| container\_mongo\_queries\_total | counter | count | Total number of outbound Mongo queries |
| container\_kafka\_requests\_total | counter | count | Total number of outbound Kafka requests |
| container\_cassandra\_queries\_total | counter | count | Total number of outbound Cassandra requests |
| container\_rabbitmq\_messages\_total | counter | count | Total number of Rabbitmq messages produced or consumed by the container |
| container\_nats\_messages\_total | counter | count | Total number of NATS messages produced or consumed by the container |
| container\_dubbo\_requests\_total | counter | count | Total number of outbound DUBBO requests |
| container\_dns\_requests\_total | counter | count | Total number of outbound DNS requests |
### Protocol-Specific Latency Metrics
| Metric Name | Type | Units | Description |
| ------------------------------------------------------- | --------- | ------- | ------------------------------------------------------------------- |
| container\_http\_requests\_duration\_seconds\_total | histogram | seconds | Histogram of the response time for each outbound HTTP request |
| container\_postgres\_queries\_duration\_seconds\_total | histogram | seconds | Histogram of the execution time for each outbound Postgres query |
| container\_redis\_queries\_duration\_seconds\_total | histogram | seconds | Histogram of the execution time for each outbound Redis query |
| container\_memcached\_queries\_duration\_seconds\_total | histogram | seconds | Histogram of the execution time for each outbound Memcached query |
| container\_mysql\_queries\_duration\_seconds\_total | histogram | seconds | Histogram of the execution time for each outbound Mysql query |
| container\_mongo\_queries\_duration\_seconds\_total | histogram | seconds | Histogram of the execution time for each outbound Mongo query |
| container\_kafka\_requests\_duration\_seconds\_total | histogram | seconds | Histogram of the execution time for each outbound Kafka request |
| container\_cassandra\_queries\_duration\_seconds\_total | histogram | seconds | Histogram of the execution time for each outbound Cassandra request |
| container\_dubbo\_requests\_duration\_seconds\_total | histogram | seconds | Histogram of the response time for each outbound DUBBO request |
| container\_dns\_requests\_duration\_seconds\_total | histogram | seconds | Histogram of the response time for each outbound DNS request |
# MetoroQL
Source: https://metoro.io/docs/metrics/metoroql
MetoroQL (mQL for short) is Metoro's query language for observability data. It's designed to be familiar to users of PromQL but with several important enhancements that make it more powerful for querying across different types of observability data.
## Overview
MetoroQL has a PromQL-like syntax but provides unified access to different types of data:
* Metrics (both standard and custom)
* Logs
* Traces
* Kubernetes resources
This allows you to correlate and analyze data from different sources using a consistent query language.
## Key Differences from PromQL
MetoroQL is generally a subset of promql with a few notable difference:
1. Counters return the delta of consecutive values by default
2. Queries can be over resource types other than metrics
3. Timeseries queries *must* have an aggregate applied to them
### Counter Handling
In PromQL, counter metrics require explicit functions like `rate()` or `increase()` to calculate the rate of change. In MetoroQL, counter values are automatically presented as the difference between consecutive data points. This means:
* Values represent changes between points rather than cumulative values
* You should not apply `rate()` or `increase()` functions to chart changes
For example, consider a HTTP request counter metric with one minute buckets:
```PromQL
# In PromQL, a query to get the number of requests
# sent in a given minute might look something like this
sum(rate(http_requests_total{service="api"}[5m])) / 5
# or
sum(rate(http_requests_total{service="api"}[5m])) * 60
# In MetoroQL, you directly query the counter
sum(http_requests_total{service="api"})
```
The MetoroQL query will directly show the change in request count between data points, while in PromQL, the raw `http_requests_total` would show monotonically increasing cumulative values that generally aren't immediately useful without applying `rate()` or `increase()`.
### Multi-domain Queries
One of the most powerful features of MetoroQL is the ability to query across different observability domains using special metric names:
* `logs` - Log data
* `traces` - Distributed tracing data
* `kubernetes_resources` - Kubernetes resources information
* Any other metric identifier is treated as a regular metric
Each of these domains has specific functions and aggregations that can be applied to them.
### Forced aggregations
In mQL *all* timeseries queries require an explicit aggregation function such as:
* `sum`
* `avg`
* `min`
* `max`
* `count`
* `histogram_quantile`
For example
```PromQL
# The following is a valid query in promql, this will return
# all individual timeseries (unique combination of labels and values).
container_resources_cpu_usage_seconds_total
# In mQL you must specify an aggregate
sum(container_resources_cpu_usage_seconds_total)
```
This behaviour differs from the default promql behaviour.
## Basic Query Syntax
A simple MetoroQL timeseries query has the following structure:
```PromQL
aggregation(metric_name{label1="value1", label2="value2"}) by (grouplabel1, grouplabel2)
```
For example to get the cpu usage of all services running in the default namespace:
```PromQL
max(container_resources_cpu_usage_seconds_total{namespace="default"}) by (service_name)
```
You can also perform arithmetic on a timeseries or between multiple timeseries
For example to get the percent of allocated disk actually used by a service
```PromQL
(sum(container_resources_disk_used_bytes) by (service_name) /
sum(container_resources_disk_size_bytes) by (service_name)) * 100
```
## Special Data Types
In addition to metrics, you can write mQL queries over logs, traces and kubernetes\_resources.
Each of these resources have their own rules on how they can be queried.
### Log Queries
* Log queries just support only the count aggregate.
* They support all filtering and group by operation.
* Structured json logs attributes are parsed into filterable fields.
```PromQL
# Count of error logs
count(logs{log_level="error"})
# Number of logs with a message matching a regex
count(logs{message=~".*failed.*"})
# Error logs by service
count(logs{log_level="error"}) by (service.name)
# Count each of the individual values of the
# custom "caller" field for all logs that have the field.
count(logs{caller=~".+"}) by (caller)
```
### Trace Queries
* Trace queries support both the `count` aggregation and the `trace_duration_quantile`.
* They support all filtering and group by operation.
* All custom attributes are queryable for filtering and group bys
```PromQL
# Count of all requests being served by currency services
count(traces{server.service.name=~".*currency.*"})
# Percent of 5XX requests served by the currency services
count(traces{http.status_code=~"5..", server.service.name=~".*currency.*"}) * 100
/ count(traces{server.service.name=~".*currency.*"})
# P95 for the convert endpoint
trace_duration_quantile(0.95, traces{http.path="/convert",
server.service.name=~".*currency.*"})
```
### Kubernetes Resources Queries
* Trace queries support both the `count` aggregation and all other aggerations after the `json_path` function is applied.
* They support all filtering and group by operation.
```PromQL
# Count of pods by namespace
count(kubernetes_resources{Kind="Pod"}) by (Namespace)
# Total number of replicas specified by deployments per service
sum(json_path("spec.replicas", kubernetes_resources)) by (ServiceName)
```
With `json_path`, you can:
* Extract and analyze specific fields from Kubernetes resources
* Use `sum`, `avg`, `min`, or `max` aggregations with the extracted values
## Advanced Features
### Filtering
MetoroQL supports several filtering operators:
```PromQL
# Exact match
metric{label="value"}
# Negation
metric{label!="value"}
# Regex matching
metric{label=~"pattern"}
# Negated regex
metric{label!~"pattern"}
```
### Binary Operations
You can create complex queries using arithmetic operations.
Supported operations are:
* `+` addition
* `-` subtraction
* `*` multiplication
* `/` division
* `%` modulo
* `^` exponentiation
* `==` equal
* `!=` not equal
* `<=` less than or equal
* `>=` greater than or equal
```PromQL
# Calculate logs error rate percentage
100 * (count(logs{log_level="error"}) / sum(logs))
# Compare CPU usage across environments
sum(container_resources_cpu_usage_seconds_total{environment="production"}) - sum(container_resources_cpu_usage_seconds_total{environment="staging"})
```
### Grouping
Group data by specific labels:
```
# Group by container and namespace
sum(container_memory_working_set_bytes) by (container, namespace)
# Top 5 pods by CPU usage
topk(5, max(container_cpu_usage) by (pod_name))
```
# Metrics Overview
Source: https://metoro.io/docs/metrics/overview
Metrics are a great way to understand the performance and internal characteristics of your services and infrastructure.
## Metoro Produced Metrics
Metoro automatically generates a large number of metrics from your services and infrastructure. These metrics are collected by the in-cluster agents and provide detailed information about the performance of your services and infrastructure. This includes things like
These are collected by the in-cluster agents and provide detailed information about the performance of your services and infrastructure. This includes things like:
* Network metrics at the container level
* Disk metrics at the container level
* CPU metrics at the container level
* Memory metrics at the container level
* Node level metrics
* And many many more...
You can check out all of the available metrics in the [metric explorer](https://demo.us-east.metoro.io/metric-explorer?chart=%7B%22startTime%22%3A1731371066%2C%22endTime%22%3A1731371966%2C%22metricName%22%3A%22container_net_tcp_active_connections%22%2C%22filters%22%3A%7B%22dataType%22%3A%22Map%22%2C%22value%22%3A%5B%5D%7D%2C%22excludeFilters%22%3A%7B%22dataType%22%3A%22Map%22%2C%22value%22%3A%5B%5D%7D%2C%22splits%22%3A%5B%5D%2C%22metricType%22%3A%22metric%22%2C%22type%22%3A%22line%22%2C%22functions%22%3A%5B%5D%2C%22aggregation%22%3A%22avg%22%7D\&tab=catalog\&startEnd=)
For a complete list of metrics that Metoro automatically generates, see [Default Metrics](/metrics/generated-metrics) or look at the [metric explorer](https://demo.us-east.metoro.io/metric-explorer) in platform.
## Custom Metrics
In addition to the automatically generated metrics, you can also send your own custom metrics to Metoro using OpenTelemetry. See [Custom Metrics](/metrics/custom-metrics) for details on how to send custom metrics to Metoro.
Learn how to send your own metrics to Metoro
## MetoroQL
Metoro provides a powerful query language called MetoroQL for working with metrics and other observability data. MetoroQL is designed to be familiar to users of PromQL but with enhanced capabilities:
* Query not just metrics, but also logs, traces, and Kubernetes resources with a unified syntax
* Simplified counter handling that doesn't require `rate()` or `increase()` functions
* Advanced filtering and correlation capabilities across different data types
MetoroQL is used throughout Metoro's UI, including in dashboards, charts, and alerts.
Learn how to query observability data with MetoroQL
## Searching and Filtering Metrics
Metoro provides powerful search capabilities for your metrics. You can filter metrics using:
* Metric names
* Label values
* Time ranges
* Regular expressions
For any metric label, you can use regex search with the syntax `label = regex: `. For example:
* `service.name = regex: .*metoro.*` will match metrics from any service containing "metoro"
* `container.name = regex: ^api-.*` will match containers starting with "api-"
* `kubernetes.namespace = regex: prod|staging` will match namespaces "prod" or "staging"
## Dashboarding
Metoro supports custom [dashboarding](/dashboards/overview) to help you gain insights into your services and infrastructure. See [Dashboards](/dashboards/overview) for more details.
# Prometheus Integration
Source: https://metoro.io/docs/metrics/prometheus
How to send Prometheus metrics to Metoro
There are two ways to send Prometheus metrics to Metoro.
## 1. OpenTelemetry Collector (Recommended)
The recommended approach is to use the OpenTelemetry Collector to scrape and forward Prometheus metrics to the exporter. This method preserves metric type information better than Prometheus Remote Write due to the more sophisticated type system in OpenTelemetry.
Here's an example configuration for the OpenTelemetry Collector:
```yaml
apiVersion: v1
kind: ConfigMap
metadata:
name: otel-collector-config
data:
collector-config.yaml: |
receivers:
prometheus:
config:
scrape_configs:
- job_name: 'prometheus-federate'
scrape_interval: 60s
metrics_path: /federate
params:
match[]:
- '{job=~".+"}'
static_configs:
- targets: ['PROMETHEUS_TO_SCRAPE_URL:9090']
# Uncomment this to rename the metrics to include the company name so it's easier to identify in Metoro vs the inbuilt metrics
# processors:
# metricstransform:
# transforms:
# - include: '(.*)'
# match_type: regexp
# action: update
# new_name: 'COMPANY_NAME_$1'
# batch: {}
exporters:
otlphttp:
endpoint: "http://metoro-exporter.metoro.svc.cluster.local/api/v1/custom/otel/metrics"
tls:
# Disable TLS for in-cluster communication, this is safe because the endpoint is internal to the cluster, when data is sent from the exporter out, it is encrypted
insecure: true
encoding: json
service:
pipelines:
metrics:
receivers: [prometheus]
processors: [metricstransform, batch]
exporters: [otlphttp]
```
This configuration:
1. Sets up a Prometheus receiver to scrape metrics from your Prometheus instance
2. Processes the metrics through a transformation pipeline
3. Exports them to Metoro using the OTLP protocol
A full example can be seen [here](https://github.com/metoro-io/metoro_examples/tree/main/metrics/otel-collector)
## 2. Prometheus Remote Write
This method is not recommended as it may not preserve all metric type information due to limitations in the Prometheus Remote Write protocol. You may see that some metrics end up as gauges instead of counters, histograms or summaries.
If you are unable to use the OpenTelemetry Collector, you can configure Prometheus to directly send metrics to Metoro using Remote Write. While this method is simpler to set up, it may not preserve all metric type information due to limitations in the Prometheus Remote Write protocol.
Add the following to your Prometheus configuration:
```yaml
# The rest of your configuration here
remote_write:
- url: "http://metoro-exporter.metoro.svc.cluster.local/api/v1/send/prometheus/remote_write"
```
This configuration will send all scraped metrics directly to the exporter from your Prometheus instance using Prometheus Remote Write.
A full example can be seen [here](https://github.com/metoro-io/metoro_examples/tree/main/metrics/prometheus-remote-write)
# Profiling Overview
Source: https://metoro.io/docs/profiling/overview
By default Metoro collects CPU-profiles for all containers running in the cluster.
## What are CPU profiles?
A CPU profile is simply a list of [stacktraces](https://en.wikipedia.org/wiki/Stack_trace) and time spent at each stack traces.
Metoro aggregates these lists together to show you how exactly which function your program is spending time in.
## Why are CPU profiles useful?
A CPU profile allows you to understand where that time is being spent down to the function level.
This means that you can investigate performance issues much more easily than by just observing that the program is using a lot of CPU, you can see where that CPU time is being spent.
In practice profiling is mainly used to understand performance regressions after something has changed: new code releases, a change in usage patterns or a new environment.
## Where can you view CPU profiles in Metoro?
You can view CPU profiles for each service in its respective [service](/concepts/overview#service-page) page under the **Profiling** tab.
This view provides an aggregated view of all profiles taken across all pods associated with the service in the time period you have selected.
You can filter by the specific container in the pod or by the cluster that the service is in.

## How does Metoro collect CPU profiles?
Metoro runs a sampling profiler to understand exactly which container is running on each CPU on a host.
The sampler runs at 97Hz to get the stacktraces of any program which is currently on the CPU.
### Profiling overhead
Running the sampling profiler has a small overhead of typically \< 0.5% of total cpu usage.
## Supported languages
CPU profiling currently supports:
* C
* C++
* Rust
* Golang
* Python
Other languages will show their native runtime methods but the cpu time won't be attributed to the interpreted function itself.
# Product Roadmap
Source: https://metoro.io/docs/roadmap/overview
Upcoming features and improvements
# Metoro Roadmap
Welcome to the Metoro product roadmap! Here you can find information about features and improvements we're working on. Our roadmap may change based on user feedback.
## Coming Soon (Q2 2025)
* Status Page Customization with Vanity URLs and Branding
* High Level Service/Environment Health Views
* Ability to Filter traces in Traces View where latency is greater/less than a certain threshold
* Easier time period comparison for graphs with predefined Xhr/Xday/Xweek ago options.
* Send the dimension that the metrics is alarming on in Alert notifications.
* Ability to export/download logs from Metoro.
* Improve Log level detection
* Improved documentation for metrics that are available in Metoro.
## Coming Soon (Q3 2025)
* Hierarchical Alerts and Dashboards organization
* Sub resource level (e.g. dashboards/myDashboards) RBAC
* Embedded Trace and Log View in the Dashboards
* Overlay for graphs showing min, max, avg by default.
* Support Unit selection on graphs
* Personal/Shared dashboards
* Ability to create alerts from code.
* Ability to create dashboards from code.
* Ability to create status pages and uptime monitors from code.
* More issue detection workflows.
* Cmd + K support for quick navigation.
## Future Plans
* AI Powered Q\&A
* AI Powered RCA
* Anomaly Detection
## Recently Completed
Check out our [changelog](/changelog/overview) to see what we've recently shipped!
This roadmap is for informational purposes only and does not represent a commitment to deliver specific features by specific dates.
# Common Questions
Source: https://metoro.io/docs/traces/common-questions
Frequently asked questions about tracing in Metoro
## Why is the trace destination showing as "Unknown External Service"?
When Metoro monitors calls from services inside your cluster to external services, it uses a combination of client-side tracing and DNS resolution to identify the destination services. Here's how it works:
### The Process
1. **Client-Side Tracing**:
Metoro monitors all calls made from inside your cluster to external services. For example, when Service A (inside your cluster) calls Service B (outside your cluster), through client-side traces, Metoro can see the IP address of the destination.
2. **Protocol-Specific Resolution**:
**HTTP/HTTPS Protocols**:
For HTTP-based protocols, the destination hostname is present in the request headers. Metoro directly uses this hostname without needing additional DNS resolution. This provides accurate service identification for HTTP/HTTPS calls.
**Other Protocols (Redis, MongoDB, etc.)**:
For protocols where hostname isn't part of the protocol data, Metoro captures DNS resolution results when the connection is first established. This information is saved to a key-value store (Redis node running in your cluster). The stored mapping helps identify services in subsequent traces.
3. **IP Resolution Process**:
When exporters encounter a trace with an unknown IP address (external cluster IP), they attempt to resolve it by looking up the IP in the key-value store. If the IP address cannot be found in the key-value store, the service gets labeled as "External Unknown Service".
The DNS resolution results are stored with different retention periods based on your tier:
* Hobby tier: DNS results are stored for 1 hour
* Scale tier: DNS results are stored for 1 week
This becomes important for long-lived connections, especially with protocols like Redis. For example, if you're using Redis in the Hobby tier and your connection stays alive for more than an hour, subsequent traces might show "Unknown External Service". This happens because the original DNS resolution has expired, but the connection is still active and no new DNS resolution has occurred.
If a container makes a request to an IP address without making a DNS query that resolves to that IP, it will be shown as "Unknown External Service". Here's an example:
```python
import requests
# Example 1: HTTP request directly to IP
# This will show as "Unknown External Service" because no DNS query is made
response = requests.get("http://1.2.3.4:8080/api/data")
# Example 2: Using hostname
# This will show the proper service name because DNS resolution occurs
response = requests.get("http://api.example.com/api/data")
```
## What are the different types of traces in Metoro?
Metoro captures two main types of traces to provide comprehensive visibility into your service communications.
### Client-Side Traces
Client-side traces are generated by inspecting the outgoing system calls from services within your cluster. When Service A makes requests, Metoro monitors these calls at the system level to understand the destination IP address, the protocol being used, the timing of the request, and other relevant metadata.
### Server-Side Traces
Server-side traces are generated when your services receive incoming requests. These traces provide information about the incoming request details, how your service processed the request, the response sent back, and performance metrics for the request handling. Server-side traces are particularly useful for understanding how your services handle incoming traffic.
By default, all traces you see are client-side traces when the client IP is within your cluster. However, for incoming calls from external sources (where the client IP is outside your cluster), Metoro automatically switches to using server-side traces.
### How do I know if a trace is a client-side or server-side trace?
You can identify the type of trace by looking at the trace attributes. If the attribute `metoro.is_server_span` is set to `true`, then it's a server-side trace. If this attribute is not present or set to `false`, then it's a client-side trace.
# OpenTelemetry Integration
Source: https://metoro.io/docs/traces/opentelemetry
This guide explains how to send distributed traces to Metoro using OpenTelemetry. Metoro supports the OpenTelemetry Protocol (OTLP) for trace ingestion, allowing you to send traces from any application or service that can export OpenTelemetry traces.
## Prerequisites
* A Metoro account
* An application configured with OpenTelemetry
## Pricing
Custom traces are billed at \$0.30 per GB.
## High Level Overview
The metoro exporter running in each cluster is a fully compliant OpenTelemetry collector. This means that you can send traces to Metoro using any OpenTelemetry compatible tracing library.
## Endpoint Configuration
Configure your OpenTelemetry exporter to send traces to:
```
http://metoro-exporter.metoro.svc.cluster.local:8080/api/v1/traces/otel
```
This endpoint is available within your Kubernetes cluster where the Metoro exporter is installed.
## Authentication
No additional authentication is required when sending traces from within the cluster to the Metoro exporter.
## OpenTelemetry Collector Configuration
If you're using the OpenTelemetry Collector to forward traces to Metoro, here's an example configuration:
```yaml
receivers:
otlp:
protocols:
http:
endpoint: 0.0.0.0:4318
grpc:
endpoint: 0.0.0.0:4317
processors:
batch:
timeout: 10s
send_batch_size: 1000
exporters:
otlphttp:
endpoint: http://metoro-exporter.metoro.svc.cluster.local:8080/api/v1/traces/otel
tls:
insecure: true # Since we're in-cluster
service:
pipelines:
traces:
receivers: [otlp]
processors: [batch]
exporters: [otlphttp]
```
This configuration:
* Receives traces via OTLP over both HTTP (4318) and gRPC (4317)
* Batches traces for efficient transmission
* Forwards traces to the Metoro exporter
* Uses insecure communication since we're within the cluster
## Language-Specific Examples
### Go
```go
package main
import (
"context"
"go.opentelemetry.io/otel"
"go.opentelemetry.io/otel/exporters/otlp/otlptrace/otlptracehttp"
"go.opentelemetry.io/otel/sdk/resource"
sdktrace "go.opentelemetry.io/otel/sdk/trace"
semconv "go.opentelemetry.io/otel/semconv/v1.24.0"
)
func initTracer() (*sdktrace.TracerProvider, error) {
ctx := context.Background()
exporter, err := otlptracehttp.New(ctx,
otlptracehttp.WithEndpoint("metoro-exporter.metoro.svc.cluster.local:8080"),
otlptracehttp.WithURLPath("/api/v1/traces/otel"),
otlptracehttp.WithInsecure(), // Since we're in-cluster
)
if err != nil {
return nil, err
}
resource := resource.NewWithAttributes(
semconv.SchemaURL,
semconv.ServiceName("your-service-name"),
)
tracerProvider := sdktrace.NewTracerProvider(
sdktrace.WithBatcher(exporter),
sdktrace.WithResource(resource),
sdktrace.WithSampler(sdktrace.AlwaysSample()),
)
otel.SetTracerProvider(tracerProvider)
return tracerProvider, nil
}
```
### Python
```python
from opentelemetry import trace
from opentelemetry.exporter.otlp.proto.http.trace_exporter import OTLPSpanExporter
from opentelemetry.sdk.resources import Resource
from opentelemetry.sdk.trace import TracerProvider
from opentelemetry.sdk.trace.export import BatchSpanProcessor
def init_tracer():
exporter = OTLPSpanExporter(
endpoint="http://metoro-exporter.metoro.svc.cluster.local:8080/api/v1/traces/otel",
insecure=True # Since we're in-cluster
)
resource = Resource.create({
"service.name": "your-service-name"
})
provider = TracerProvider(resource=resource)
processor = BatchSpanProcessor(exporter)
provider.add_span_processor(processor)
trace.set_tracer_provider(provider)
return provider
```
### Node.js
```javascript
const { NodeTracerProvider } = require('@opentelemetry/sdk-trace-node');
const { OTLPTraceExporter } = require('@opentelemetry/exporter-trace-otlp-http');
const { Resource } = require('@opentelemetry/resources');
const { SemanticResourceAttributes } = require('@opentelemetry/semantic-conventions');
const { BatchSpanProcessor } = require('@opentelemetry/sdk-trace-base');
const resource = new Resource({
[SemanticResourceAttributes.SERVICE_NAME]: 'your-service-name',
});
const traceExporter = new OTLPTraceExporter({
url: 'http://metoro-exporter.metoro.svc.cluster.local:8080/api/v1/traces/otel',
headers: {},
});
const provider = new NodeTracerProvider({
resource: resource,
});
provider.addSpanProcessor(new BatchSpanProcessor(traceExporter));
provider.register();
```
## Attributes and Context
When sending traces via OpenTelemetry, you can include additional attributes that will be indexed and searchable in Metoro:
* Use resource attributes to define static information about the service
* Use span attributes to include dynamic information with each span
* Link spans with logs using trace context propagation
* Add custom attributes to spans for business-specific data
## Best Practices
1. **Sampling**: Configure appropriate sampling rates based on your traffic volume
2. **Span Names**: Use descriptive span names that identify the operation
3. **Error Handling**: Set span status to error when exceptions occur
4. **Attributes**: Add relevant attributes but avoid excessive data
5. **Context Propagation**: Properly propagate trace context across service boundaries
## Troubleshooting
If you encounter issues with OpenTelemetry trace ingestion:
1. Verify your endpoint URL is correct
2. Check your network connectivity to the Metoro OTLP endpoint
3. Enable debug logging in your OpenTelemetry SDK
4. Verify your traces appear in the Metoro traces view
5. Contact support if issues persist
## Additional Resources
* [OpenTelemetry Documentation](https://opentelemetry.io/docs/)
* [OpenTelemetry Specification](https://github.com/open-telemetry/opentelemetry-specification)
# Traces Overview
Source: https://metoro.io/docs/traces/overview
Understanding and utilizing traces in Metoro
Traces are a powerful tool to understand the flow of requests through your services. Metoro provides a centralized
location to view and query traces with zero configuration required. Traces are automatically generated for all your
services, including third party services through eBPF.
## How Tracing Works in Metoro
Metoro uses eBPF technology at its core to provide comprehensive tracing capabilities. The Metoro node agent runs on every host in your cluster and monitors all network calls, deserializing them to inspect the underlying protocols and create traces.
This means that you don't need to instrument your code to get tracing data. You can just start using Metoro and get traces for all your services, including third party services.
### Supported Protocols
Metoro currently supports tracing for the following protocols:
* HTTP(s)
* gRPC
* Postgres
* MySQL
* Redis
* Memcache
* MongoDB
* Kafka
* Cassandra
Every request made using these protocols from any container in your cluster is automatically recorded and sent to Metoro's observability backend for inspection.
### HTTPs Support
Metoro supports HTTPS tracing through eBPF instrumentation of SSL libraries (like OpenSSL and BoringSSL) within the binary itself. When calls to read or write TLS are made, Metoro inspects the unencrypted content at the kernel level, without modifying any application code.
## Trace Attributes
Each trace is enriched with various attributes depending on the protocol. Common attributes across all protocols include:
* Client namespace
* Server namespace
* Client container ID
* Server container ID
* Client availability zone
* Server availability zone
* Server service name
* Client service name
Protocol-specific attributes are also captured. For example, HTTP traces include:
* HTTP path
* HTTP status code
* HTTP URL
* HTTP host
* HTTP flavor
* Request duration
For database protocols, Metoro decodes and records the actual queries, providing visibility into every database operation.
## Trace Redaction
Metoro provides comprehensive trace redaction capabilities to protect sensitive information in your traces. For detailed information about configuring and managing trace redaction, see the [Trace Redaction](/traces/redaction) documentation.
## The Trace View
The trace view provides a powerful interface to explore and analyze your traces across all clusters. You can filter traces using:
* Any trace attribute
* Regex search patterns
* Time-based filtering
You can use regex search on any trace attribute by using the syntax `attribute = regex: `. For example:
* `service.name = regex: .*metoro.*` will match traces from any service containing "metoro"
* `http.path = regex: /api/v1/.*` will match HTTP paths starting with "/api/v1/"
* `http.status_code = regex: ^5.*` will match all 5XX status codes

## Service Map Generation
Metoro automatically generates [service maps](/concepts/overview) based on the traced communications between services. This provides a visual representation of how your services interact with each other, making it easier to understand your application's architecture and dependencies.
### Bring Your Own Tracing (OpenTelemetry)
eBPF tracing is a powerful tool, but it does have some limitations, it does not support all protocols and does not currently support distributed tracing (ebpf creates individual spans but is unable to track chains of request calls currently). If you are already using OpenTelemetry, you can send your traces to Metoro by configuring the [OpenTelemetry Collector](https://opentelemetry.io/docs/collector/) to send traces to Metoro.
The Metoro exporter is a fully compliant opentelemetry collector, so you can send your traces to Metoro to be queried and visualized.
Follow the guide at [OpenTelemetry Tracing Integration](/traces/opentelemetry)
## RED Metrics Generation
The trace data is used to generate various RED Metrics (Rate, Errors, Duration), including:
* Request metrics
* Error metrics
* Duration metrics
These metrics are available in the [Service View](/concepts/overview) or in [Custom Dashboards](/dashboards/overview) and provide valuable insights into your application's performance and behavior.
Discover how Metoro organizes and visualizes your service data
# Trace Redaction
Source: https://metoro.io/docs/traces/redaction
Configure and manage trace redaction rules to protect sensitive information
Trace redaction allows you to protect sensitive information in your traces before they are stored. This feature is essential
for maintaining data privacy and compliance while still getting the full benefits of tracing.
## How Trace Redaction Works
Metoro provides the ability to redact sensitive information from your traces before they are stored. This is particularly useful for protecting sensitive data like:
* User IDs in URLs
* Account numbers in paths
* Authentication tokens
* Personal information in query parameters
The redaction process follows these steps:
1. **Pattern Matching**: Define regex patterns in [re2](https://github.com/google/re2/wiki/Syntax) format to match sensitive information in URLs and paths
2. **Service-Specific Rules**: Apply redaction rules to specific services or globally across all services
3. **Replacement**: Replace matched patterns with custom text (e.g., replace user IDs with "\[REDACTED]")
Redaction is applied to both:
* `http.url` attributes (full URLs)
* `http.path` attributes (path components)
## Configuration
Redaction rules can be configured in the Settings page. To add a new redaction rule:
1. Navigate to **Settings**
2. Select the **Data Ingestion Settings** tab
3. Click on **Trace Redactions** in the left sidebar
4. Click the **Add Rule** button in the top right corner

The same view will show you all your current redaction rules, allowing you to manage and remove existing rules as needed.
Each rule consists of:
* Environments (default is all environments)
* Service names (default is all services)
* Pattern (regex to match text to redact)
* Replacement text (text to replace matched text with)
For example, to redact user IDs from a URL path:
* Pattern: `/users/(\d+)`
* Replacement: `/users/[REDACTED_USER_ID]`

Make sure to test your redaction regex rules in a regex tester before saving!
You can test your regex rules in the modal above by clicking "Test Regex" button, or use an online regex tester.

## Reliability Features
The redaction system includes several reliability features:
* **Invalid Pattern Handling**: If a regex pattern is invalid, the original URL is preserved
* **Synchronization**: Background process keeps redaction rules up-to-date
* **Environment Isolation**: Rules can be scoped to specific environments
## Order of Operations
1. Traces are collected from your services by the `metoro-node-agent` component running in your cluster
2. The collected traces are sent to the `metoro-exporter` component, also running in your cluster
3. In the `metoro-exporter`:
* Redaction rules are validated and compiled
* Rules are applied based on service name and environment matches
* Both client and server service names are checked against the rules
* Matching traces are redacted according to the rules
4. Only after redaction are the traces sent to Metoro's observability backend for storage and display
The `metoro-exporter` automatically resyncs the redaction rules every minute to ensure it has the latest configuration. This means that any changes you make to redaction rules will be picked up automatically within a minute, without requiring a manual restart.
This architecture ensures that sensitive information never leaves your cluster and is redacted before it reaches any external system, including Metoro's observability backend. The redaction happens as close to the source as possible, providing an additional layer of security for your sensitive data.
## Important Note About Rule Order
The order in which redaction rules are applied is non-deterministic. Therefore, you should design your redaction rules to be independent of each other. For example:
❌ Incorrect approach (rules depending on order):
```
Rule 1: Pattern: `/users/(\d+)/details` → `/users/[ID]/details`
Rule 2: Pattern: `/users/[ID]` → `/[REDACTED]`
```
✅ Correct approach (independent rules):
```
Rule 1: Pattern: `/users/(\d+)/details` → `/users/[REDACTED_ID]/details`
Rule 2: Pattern: `/users/(\d+)` → `/users/[REDACTED_ID]`
```
Each rule should be self-contained and not rely on the output of other rules. This ensures consistent redaction regardless of the order of application.
## Troubleshooting
If your trace redaction rules are not working as expected, here are some common issues and solutions:
1. **Invalid Regex Patterns**
* Make sure your regex patterns are valid [re2](https://github.com/google/re2/wiki/Syntax) expressions
* Invalid regex patterns will not compile and therefore will not be applied to trace endpoints
* Use the "Test Regex" feature in the UI or an online regex tester to validate your patterns
2. **Attribute Limitations**
* Currently, redactions are only applied to `http.path` and `http.url` attributes
* If you need to redact data from different attributes, please contact the Metoro team for support.
# Service Map
Source: https://metoro.io/docs/traces/service-map
Visualize and analyze service-to-service communication in your clusters
## Overview
The service map is a powerful visualization tool in Metoro that displays connections between services in your cluster. Built on [trace data](/traces/overview), it provides insights into:
* Service-to-service communication within your cluster
* External client requests entering your cluster
* Outbound requests from your services to external dependencies
## How It Works
The service map is dynamically generated from trace data by:
1. Analyzing each request's client and server containers
2. Identifying service boundaries
3. Creating visual connections between communicating services
4. Detecting external traffic patterns
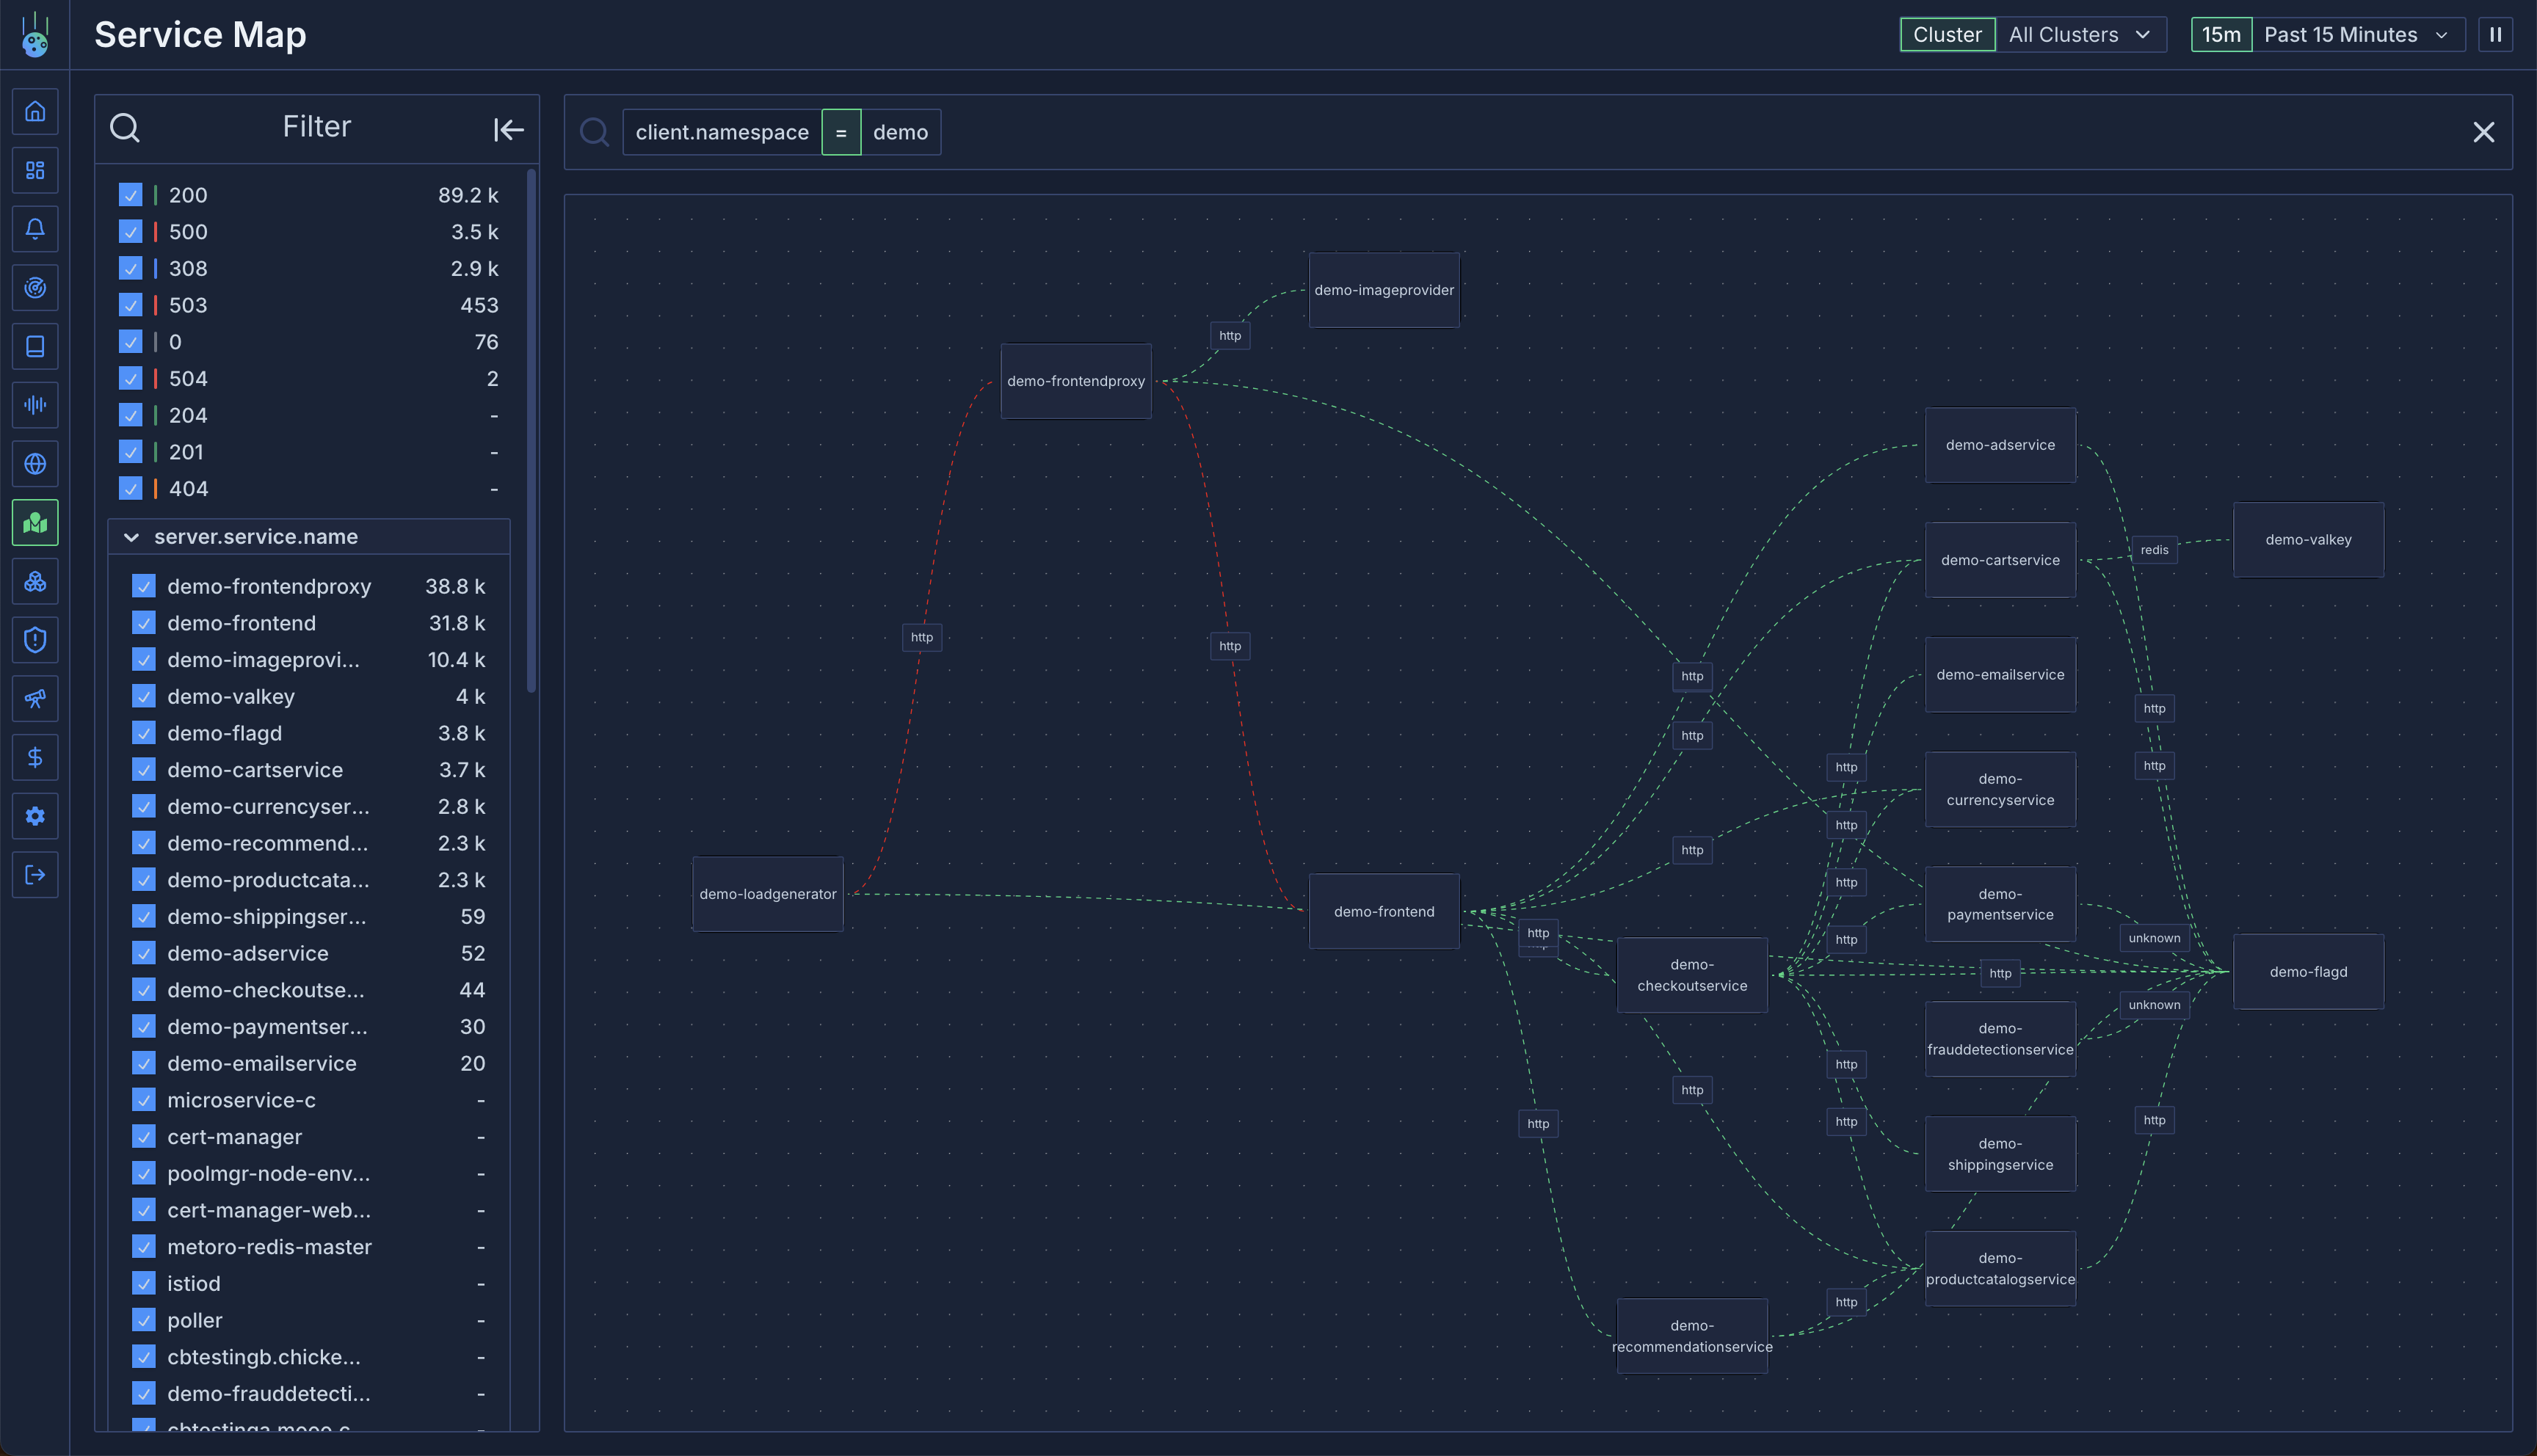 ## Connection Types
### Internal Connections
Lines between services represent internal cluster communication:
* Green lines indicate healthy connections
* Red lines indicate errors (5xx responses or traced errors)
* Line thickness represents traffic volume
### External Traffic
The service map identifies two types of external traffic:
1. **External Clients**:
* Detected when only server-side traces exist
* Shows incoming traffic from outside the cluster
* Helps monitor external access patterns
2. **External Services**:
* Identified by analyzing outbound request destinations
* Groups requests by hostname (e.g., `api.stripe.com`)
* Falls back to "Unknown External Service" for unresolvable IPs
## Connection Types
### Internal Connections
Lines between services represent internal cluster communication:
* Green lines indicate healthy connections
* Red lines indicate errors (5xx responses or traced errors)
* Line thickness represents traffic volume
### External Traffic
The service map identifies two types of external traffic:
1. **External Clients**:
* Detected when only server-side traces exist
* Shows incoming traffic from outside the cluster
* Helps monitor external access patterns
2. **External Services**:
* Identified by analyzing outbound request destinations
* Groups requests by hostname (e.g., `api.stripe.com`)
* Falls back to "Unknown External Service" for unresolvable IPs
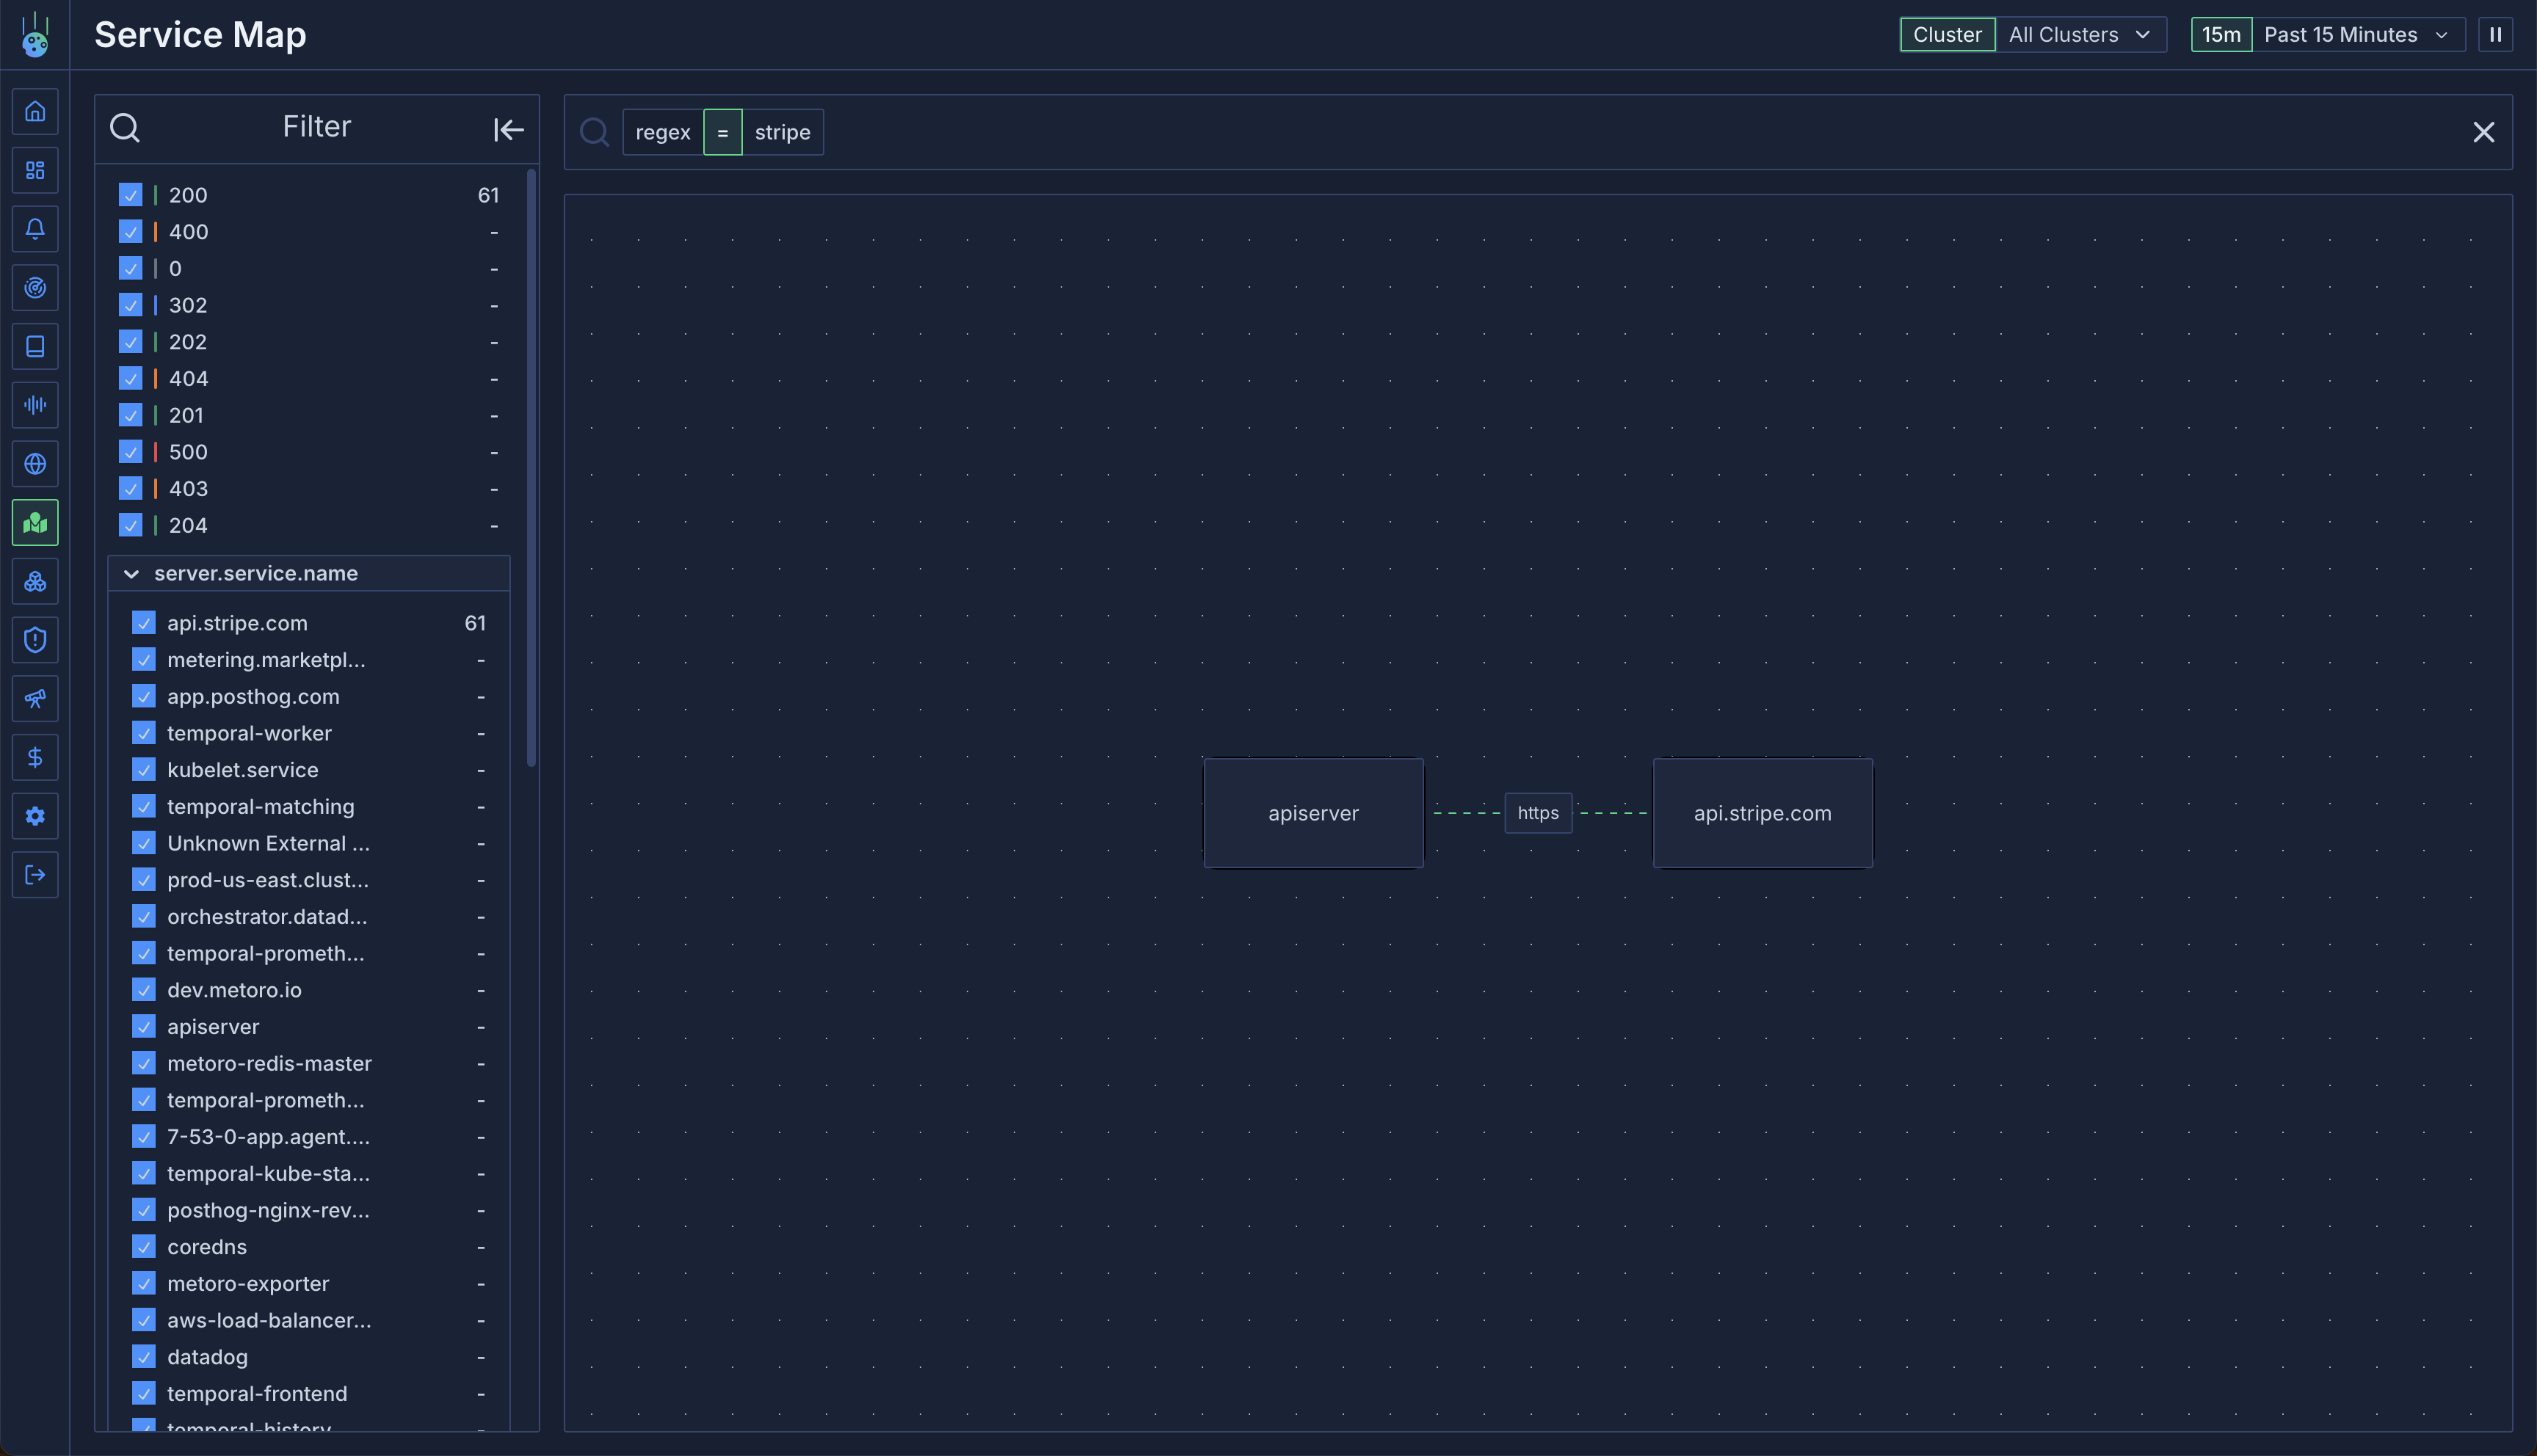 ## Interactive Features
### Connection Details
Mouse over any connection to:
* View request rate statistics
* Access underlying traces
* See error rates and patterns
* Filter by connection attributes
### Service Details
Mouse over any service node to see:
* Incoming request rates
* Connected services
* Traffic patterns
* Service health metrics
## Interactive Features
### Connection Details
Mouse over any connection to:
* View request rate statistics
* Access underlying traces
* See error rates and patterns
* Filter by connection attributes
### Service Details
Mouse over any service node to see:
* Incoming request rates
* Connected services
* Traffic patterns
* Service health metrics
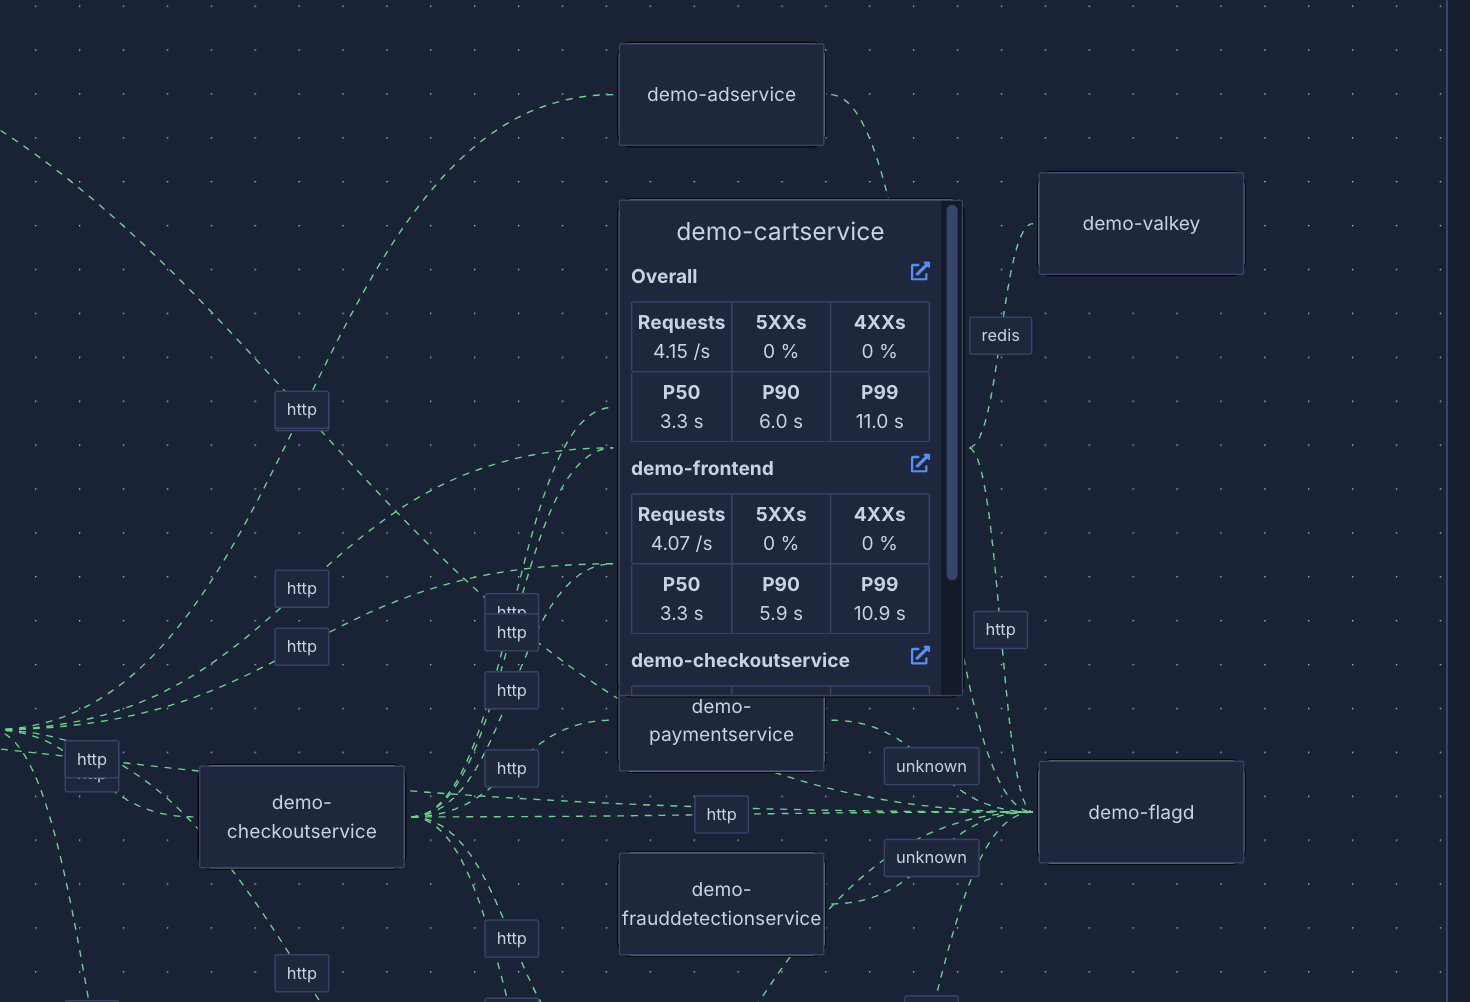 ## Filtering
### Namespace Filtering
Filter traffic by namespace:
```
# Show requests to services in a namespace
server.namespace = metoro
# Show requests from services in a namespace
client.namespace = metoro
```
### Service Filtering
Filter by service names:
```
# Show traffic to specific services
server.service.name = api.stripe.com
# Show traffic from specific services
client.service.name = metoro-apiserver
```
### Path Filtering
Use regex to filter by HTTP path:
```
# Find v1 trace endpoints
v1.traces
```
## Use Cases
1. **Dependency Monitoring**:
* Track external service dependencies
* Monitor third-party API usage
* Set up alerts for external service issues
2. **Traffic Analysis**:
* Identify communication patterns
* Debug service connectivity issues
* Monitor service health
3. **Error Detection**:
* Quickly spot failing connections
* Investigate error patterns
* Track error rates across services
# Uptime Monitor Metrics
Source: https://metoro.io/docs/uptime-monitoring/metrics
Understanding and using uptime monitoring metrics
# Uptime Monitor Metrics
Each uptime monitor generates two metrics that you can use to track your endpoints' health and performance.
## Available Metrics
### Response Time Metric
The response time metric (`uptime_monitor_[name]_response_time`) tracks how long each request takes to complete.
* **Type**: Gauge
* **Unit**: Milliseconds
* **Name Format**: `uptime_monitor_[name]_response_time`
* **Description**: Measures the total time taken for the request to complete, including network latency
Example uses:
* Track response time trends
* Set alerts for slow responses
* Create dashboards showing endpoint performance
### Status Metric
The status metric (`uptime_monitor_[name]_status`) indicates whether the endpoint check was successful.
* **Type**: Gauge
* **Unit**: Boolean (0 or 1)
* **Name Format**: `uptime_monitor_[name]_status`
* **Description**: Indicates whether the endpoint check passed all validation criteria
* **Labels**:
* `status="success"`: 1 if successful, 0 if failed
* `status="failure"`: 1 if failed, 0 if successful
A check is considered successful when:
* The response status code matches the expected pattern
* The response body matches the regex pattern (if specified)
* No connection errors occurred
You can use these metrics in dashboards and alerts to monitor your endpoints' health.
# Uptime Monitoring
Source: https://metoro.io/docs/uptime-monitoring/overview
Monitor the health and availability of your endpoints
# Uptime Monitoring
Metoro's Uptime Monitoring feature allows you to monitor the health and availability of your HTTP endpoints. You can configure monitors to regularly check your endpoints and track their response times and status.
## Features
* **Flexible Status Code Matching**: Support for exact matches (e.g., `200`), wildcards (e.g., `2XX`), and multiple patterns (e.g., `200,201,X04`)
* **Response Body Validation**: Validate response bodies against regular expressions
* **Custom Headers**: Add custom headers to your requests
* **Multiple HTTP Methods**: Support for GET, POST, PUT, PATCH, and DELETE
* **Configurable Check Frequency**: Monitor endpoints from every minute to every hour
* **Metric Generation**: Automatic generation of response time and status metrics
## Getting Started
1. Navigate to the Settings page in your Metoro dashboard
2. Select the "Integrations" tab
3. Click "Add Monitor" in the Uptime Monitoring section
You must be an admin to create or see uptime monitors.
## Configuration Options
### Basic Settings
* **Name**: A descriptive name for your monitor
* **Endpoint URL**: The URL to monitor
* **HTTP Method**: The HTTP method to use (GET, POST, PUT, PATCH, DELETE)
* **Check Frequency**: How often to check the endpoint
### Status Code Validation
You can specify expected status codes using:
* Exact codes: `200`
* Wildcards: `2XX` (any 2XX status) You *must* use uppercase for wildcards.
* Multiple patterns: `200,201,X04`
Examples:
* `200`: Expect exactly 200 OK
* `2XX`: Accept any successful response
* `X00`: Accept any status code ending in 00
* `200,201,202`: Accept any of these specific codes
### Response Body Validation
You can optionally validate the response body using regular expressions. This is useful for:
* Ensuring specific content is present
* Validating response format
* Checking for error messages
Example patterns:
* `.*"status":"healthy".*`: Check for a healthy status in JSON
* `^OK$`: Expect exactly "OK"
* `version: [0-9]+\.[0-9]+\.[0-9]+`: Match a semantic version number
### Headers
Add custom headers to your requests. Some common use cases:
* Authentication tokens
* API keys
* Content type specifications
For POST/PUT requests, the `Content-Type` header is automatically set to `application/json`.
### Request Body
For POST, PUT, and PATCH requests, you can specify a request body to send with each check.
### Metrics
Each monitor automatically generates two metrics:
* Response time metric: `uptime_monitor_[metric_name_base]_response_time`
* Status metric: `uptime_monitor_[metric_name_base]_status`
These metrics can be used in dashboards and alerts to monitor your endpoints' health.
All uptime monitoring results are logged and can be viewed in the logs view. The logs are published with:
* Service name: `uptime-monitor`
* Environment: `metoro-internal`
For successful checks:
* Log line: `Uptime check succeeded`
* Attributes include: status code, response body, endpoint pinged, latency
For failed checks:
* Log line: `Uptime check failed`
* Attributes include:
* Error field explaining why the check failed
* Status code (if received)
* Expected vs actual response body
* Endpoint pinged
* Latency (if request completed)
## Status Pages
Status pages provide a way to communicate your service's health and incidents to your users. You can create multiple status pages for different audiences or services.
### Creating a Status Page
1. Navigate to the Settings page in your Metoro dashboard
2. Select the "Status Pages" tab
3. Click "Create Status Page"
### Configuration Options
* **Name**: A descriptive name for your status page
* **Slug**: The URL-friendly identifier for your page (e.g., `status.yourdomain.com`)
* **Access**: Choose between public or private access
* Public: Anyone with the URL can view the status page
* Private: Only authenticated users can view the page
* **Branding**:
* Logo: Upload your company logo
* Favicon: Custom favicon for the status page
* Theme colors: Customize the look to match your brand
### Components
Components represent different parts of your service that you want to monitor. For each component:
1. **Name**: Name of the service component
2. **Description**: Optional description of what the component does
3. **Group**: Optionally group related components together
4. **Monitors**: Associate uptime monitors with this component
* Status will automatically update based on monitor results
* Multiple monitors can be assigned to a single component
### Incidents
When issues occur, you can create and manage incidents:
1. **Create Incident**:
* Title: Clear description of the issue
* Status: Current state (Investigating, Identified, Monitoring, Resolved)
* Impact: None, Minor, Major, or Critical
* Components: Affected components
* Description: Detailed information about the incident
2. **Update Incident**:
* Add new updates as the situation evolves
* Change status and impact level
* Mark as resolved when fixed
### Historical Data
Status pages automatically display:
* Uptime percentage for each component
* Response time trends
* Incident history
* Maintenance windows
* Daily, weekly, and monthly availability reports
### Subscribing to Updates
Users can subscribe to status updates via:
* Email notifications
* RSS feed
* Webhook notifications (for integration with other systems)
Status page metrics and incident data are retained for 1 year by default.
# Status Pages
Source: https://metoro.io/docs/uptime-monitoring/status-pages
Create and manage status pages to communicate service health
# Status Pages
Status pages provide a way to communicate your service's health and incidents to your users. You can create multiple status pages for different audiences or services.
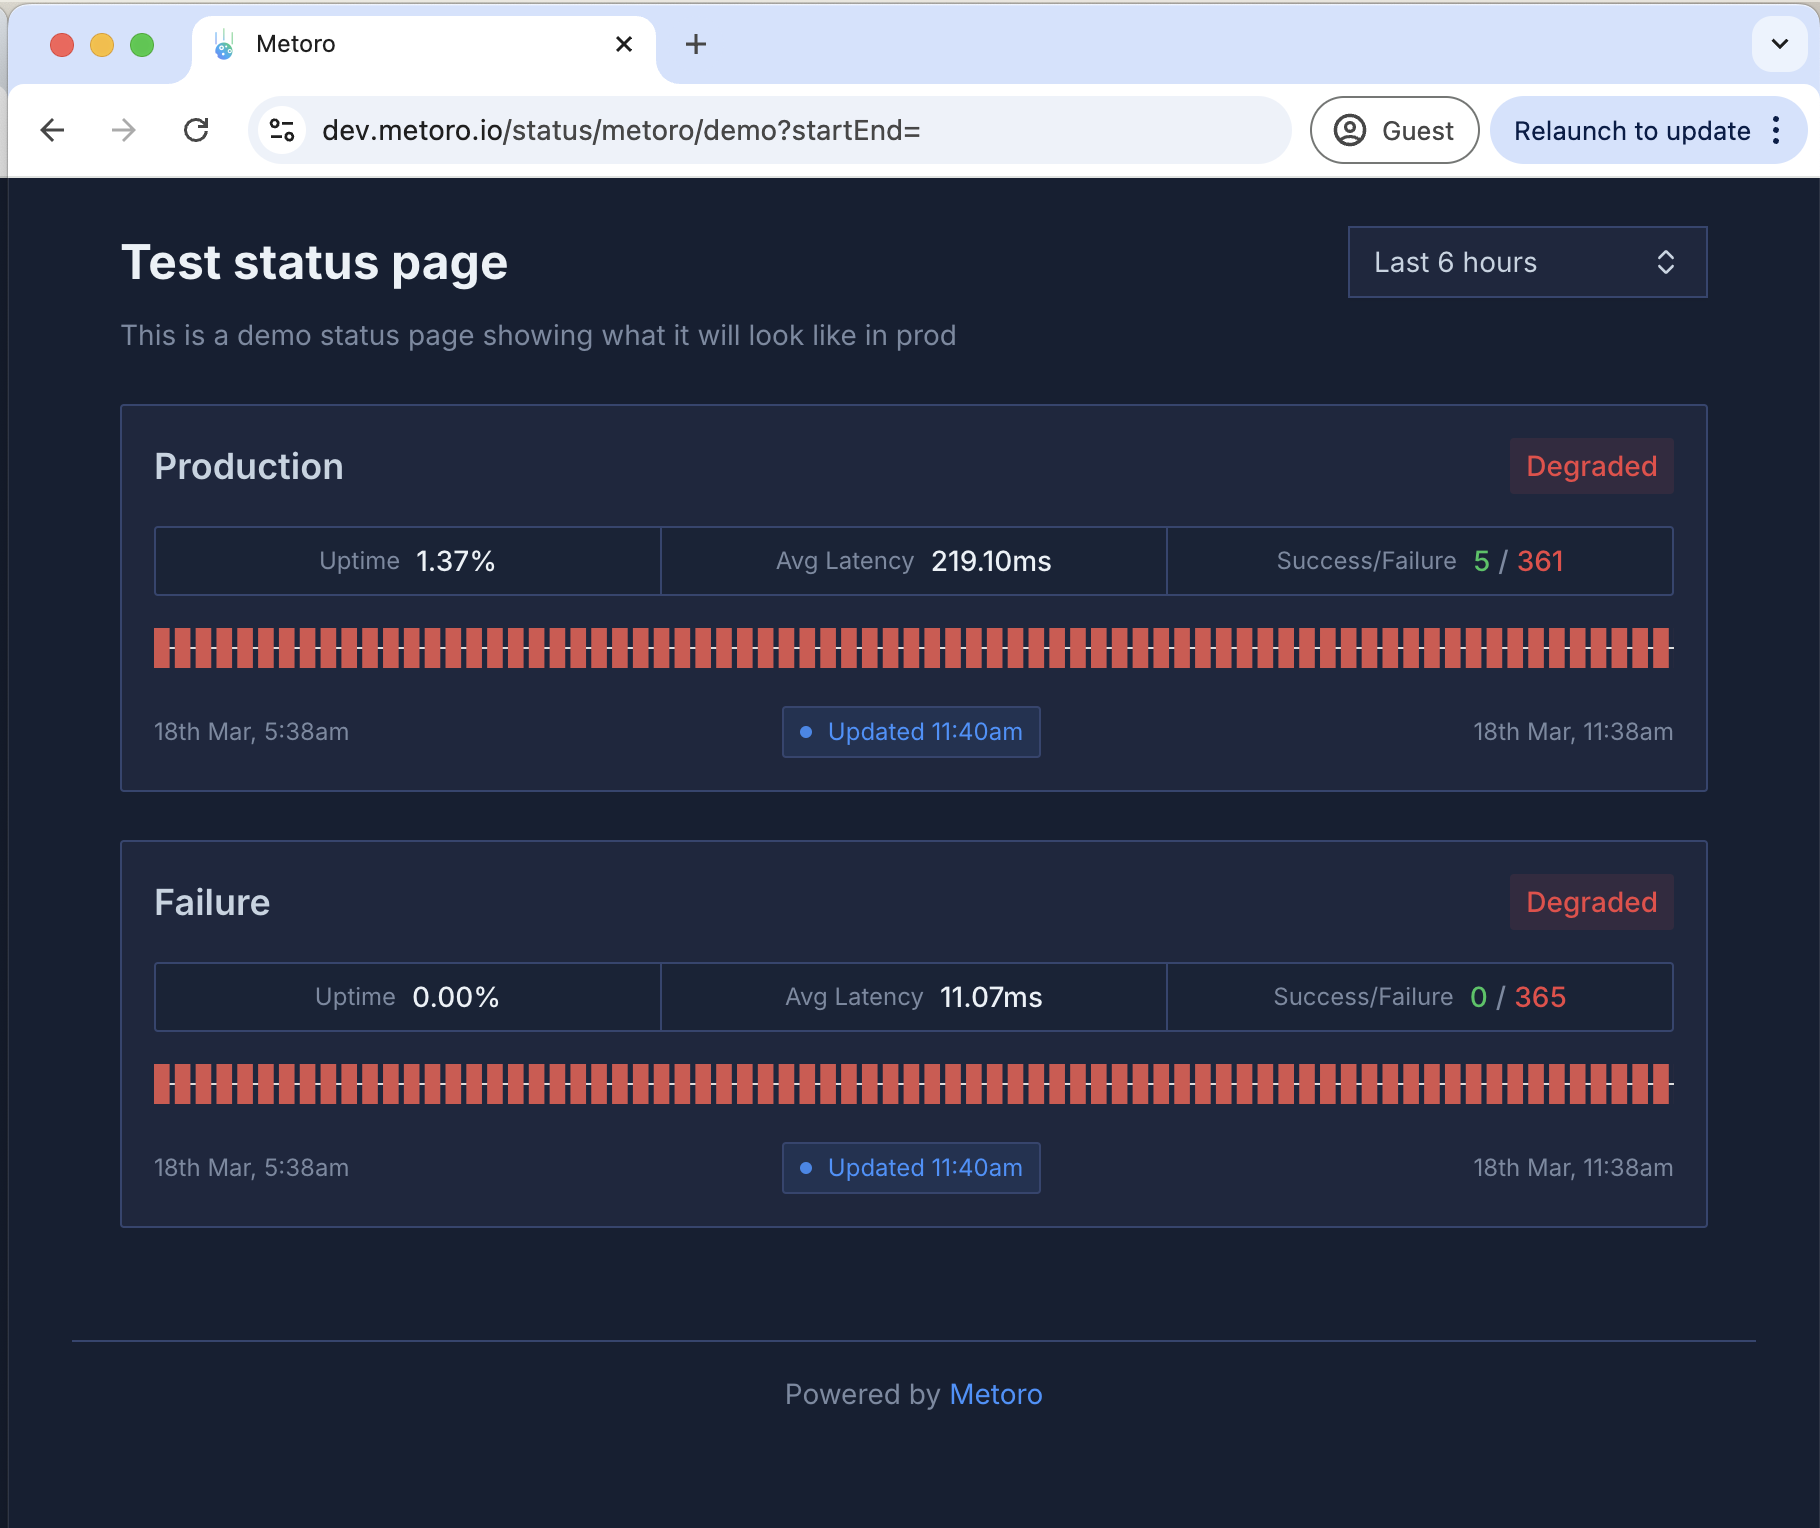
## Creating a Status Page

1. Navigate to the Settings page in your Metoro dashboard
2. Select the "Integrations" tab
3. Click "Create Status Page"
## Configuration Options
* **Name**: A descriptive name for your status page
* **Slug**: The URL-friendly identifier for your page (e.g., `serviceX-status`)
* **Access**: Choose between public or private access
* Public: Anyone with the URL can view the status page
* Private: Only authenticated users can view the page
* **Monitors**: Associate uptime monitors with this component
* Status will automatically update based on monitor results
* Multiple monitors can be assigned to a single component
# User Management Overview
Source: https://metoro.io/docs/user-management/overview
Learn how to manage users, roles, and permissions in Metoro
User management in Metoro allows you to control access to your organization's resources through a comprehensive role-based access control (RBAC) system. The system consists of three main components:
1. **Users** - Individual accounts that can access your organization's Metoro instance
2. **Roles** - Collections of permissions that can be assigned to users
3. **Resource Types** - Different types of resources that can be accessed and managed within Metoro
## Built-in Roles
Metoro comes with two built-in roles:
* `default-metoro-admin` - Full access to all features including user management, integrations, billing, and settings
* `default-metoro-user` - Access to view observability data but cannot modify integrations, cluster settings, or billing
You can also create custom roles with specific permissions to better control access to different resources in your organization.
## Access Management
All user management operations are performed through the [settings page](https://us-east.metoro.io/settings?tab=users). To manage users and roles, you need to have the appropriate `accessManagement` permissions.
For detailed information about specific aspects of user management, please refer to:
* [Users](/user-management/users) - Adding and managing users
* [Roles](/user-management/roles) - Creating and managing roles
* [Resource Types](/user-management/resource-types) - Understanding different resource types and their permissions
# Resource Types
Source: https://metoro.io/docs/user-management/resource-types
Understanding resource types and their permissions in Metoro
Resource types in Metoro represent different categories of features and data that can be accessed and managed. Each resource type has its own set of permissions that can be granted through roles.
## Available Resource Types

### Access Management
* **Resource Type:** `accessManagement`
* **Description:** Controls user and role management capabilities
* **Permissions:**
* `create` - Create new users and roles
* `read` - View users and roles
* `update` - Modify existing users and roles
* `delete` - Remove users and roles
### Alerts
* **Resource Type:** `alerts`
* **Description:** Controls access to alert configurations and management
* **Permissions:**
* `create` - Create new alerts
* `read` - View existing alerts
* `update` - Modify alert configurations
* `delete` - Remove alerts
### Billing
* **Resource Type:** `billing`
* **Description:** Controls access to billing and subscription management
* **Permissions:**
* `create` - Create new billing configurations
* `read` - View billing information and usage
* `update` - Modify billing settings
* `delete` - Remove billing configurations
### Dashboards
* **Resource Type:** `dashboards`
* **Description:** Controls access to dashboard creation and management
* **Permissions:**
* `create` - Create new dashboards
* `read` - View dashboards
* `update` - Modify dashboard configurations
* `delete` - Remove dashboards
### Environments
* **Resource Type:** `environments`
* **Description:** Controls access to adding a new environment/cluster to Metoro or deleting the existing ones
* **Permissions:**
* `create` - Create (ie. Add) new environments/clusters to Metoro
* `delete` - Remove environments
* Note: Read access is available to all users, and update operations are not applicable
### Integrations
* **Resource Type:** `integrations`
* **Description:** Controls access to integration settings and configurations
* **Permissions:**
* `create` - Add new integrations
* `read` - View integration settings
* `update` - Modify integration settings
* `delete` - Remove integrations
### Log Filters
* **Resource Type:** `logFilters`
* **Description:** Controls access to log filter configurations
* **Permissions:**
* `create` - Create new log filters
* `read` - View log filters
* `update` - Modify log filter settings
* `delete` - Remove log filters
### Trace Redaction Rules
* **Resource Type:** `traceRedacts`
* **Description:** Controls access to trace redaction rule configurations
* **Permissions:**
* `create` - Create new redaction rules
* `read` - View redaction rules
* `update` - Modify redaction rules
* `delete` - Remove redaction rules
### Workflows
* **Resource Type:** `workflows`
* **Description:** Controls access to issues and workflows
* **Permissions:**
* `create` - Create new workflows
* `read` - View workflows and issues created by the workflows
* `update` - Modify workflow and issues configurations
* `delete` - Remove workflows
## Permission Inheritance
When a role is granted a permission on a resource type, users with that role automatically receive that permission for all resources of that type. For example, if a role has the `read` permission for `dashboards`, users with that role can view all dashboards in the organization.
## Best Practices
1. **Principle of Least Privilege**
* Grant only the permissions necessary for users to perform their tasks
* Regularly review and audit role permissions
* Consider starting with read-only access and adding other permissions as needed
2. **Role Organization**
* Create roles based on job functions or responsibilities
* Use descriptive names for custom roles
* Document the purpose and scope of each custom role
3. **Permission Management**
* Regularly audit user roles and permissions
* Remove unnecessary permissions promptly
* Use custom roles for fine-grained access control
# Managing Roles
Source: https://metoro.io/docs/user-management/roles
Learn how to create and manage roles in Metoro
Roles in Metoro are collections of permissions that define what actions users can perform on different resources. Each role consists of a set of permissions that grant access to specific resource types.

## Built-in Roles
Metoro provides two built-in roles that cannot be modified:
1. **default-metoro-admin**
* Full access to all features and resources
* Can manage users, roles, and permissions
* Can configure integrations and settings
* Can view and manage billing information
2. **default-metoro-user**
* Can view all observability data
* Cannot modify integrations or settings
* Cannot manage users or roles
* Cannot access billing information
## Custom Roles
To create a new role, you must have `create`, `update`, `read` permissions for the `accessManagement` resource type.
You can create custom roles to provide more granular access control for your users. When creating a custom role:
1. Navigate to the [Roles tab](https://us-east.metoro.io/settings?tab=users) in Settings -> Users -> Roles
2. Click the "Create Role" button
3. Enter a name and description for the role
4. Select the permissions you want to grant for each resource type
5. Click "Create" to save the role
Custom roles can be edited or deleted at any time by users with `accessManagement` permissions.
## Role Permissions
Each role contains a set of permissions that determine what actions users with that role can perform. Permissions are grouped by resource type and can include:
* `view` - Ability to view or read the resource
* `create` - Ability to create new instances of the resource
* `update` - Ability to modify existing instances of the resource
* `delete` - Ability to remove instances of the resource
For a detailed list of available permissions and their effects, see the [Resource Types](/user-management/resource-types) documentation.
# Managing Users
Source: https://metoro.io/docs/user-management/users
Learn how to add, remove, and manage users in your Metoro organization
The [settings page](https://us-east.metoro.io/settings?tab=users) in Metoro shows all the users that have been created or invited in your organization. Only users with the `accessManagement` permissions can make changes to the users and roles in the organization.

## Adding Users
To add a new user, make sure you have `create` and `update` permissions on your role for `accessManagement` resource type.

To invite a new user to your organization:
1. Click on the `Invite` button on the top right corner of the users view
2. Enter the email address of the user you want to invite
3. Select the role you want to assign to the user
4. Click on the `Invite` button to send the invitation
The user will receive an email with a link to accept the invitation and create an account.
If the invited user already has an account and you want them to join your organization, please contact Metoro support. We will help you with this process.
## Managing User Roles
You can assign roles to users to control their access to different resources in your organization. To assign roles:
1. Click the menu icon (three dots) next to the user you want to manage
2. Select "Assign Roles" from the dropdown menu
3. In the dialog that appears, select the roles you want to assign to the user
4. Click "Save" to apply the changes
Users can have multiple roles assigned to them. The permissions from all assigned roles are combined to determine the user's access level.
The user's roles are displayed in the "Roles" column of the users table.
## Filtering
### Namespace Filtering
Filter traffic by namespace:
```
# Show requests to services in a namespace
server.namespace = metoro
# Show requests from services in a namespace
client.namespace = metoro
```
### Service Filtering
Filter by service names:
```
# Show traffic to specific services
server.service.name = api.stripe.com
# Show traffic from specific services
client.service.name = metoro-apiserver
```
### Path Filtering
Use regex to filter by HTTP path:
```
# Find v1 trace endpoints
v1.traces
```
## Use Cases
1. **Dependency Monitoring**:
* Track external service dependencies
* Monitor third-party API usage
* Set up alerts for external service issues
2. **Traffic Analysis**:
* Identify communication patterns
* Debug service connectivity issues
* Monitor service health
3. **Error Detection**:
* Quickly spot failing connections
* Investigate error patterns
* Track error rates across services
# Uptime Monitor Metrics
Source: https://metoro.io/docs/uptime-monitoring/metrics
Understanding and using uptime monitoring metrics
# Uptime Monitor Metrics
Each uptime monitor generates two metrics that you can use to track your endpoints' health and performance.
## Available Metrics
### Response Time Metric
The response time metric (`uptime_monitor_[name]_response_time`) tracks how long each request takes to complete.
* **Type**: Gauge
* **Unit**: Milliseconds
* **Name Format**: `uptime_monitor_[name]_response_time`
* **Description**: Measures the total time taken for the request to complete, including network latency
Example uses:
* Track response time trends
* Set alerts for slow responses
* Create dashboards showing endpoint performance
### Status Metric
The status metric (`uptime_monitor_[name]_status`) indicates whether the endpoint check was successful.
* **Type**: Gauge
* **Unit**: Boolean (0 or 1)
* **Name Format**: `uptime_monitor_[name]_status`
* **Description**: Indicates whether the endpoint check passed all validation criteria
* **Labels**:
* `status="success"`: 1 if successful, 0 if failed
* `status="failure"`: 1 if failed, 0 if successful
A check is considered successful when:
* The response status code matches the expected pattern
* The response body matches the regex pattern (if specified)
* No connection errors occurred
You can use these metrics in dashboards and alerts to monitor your endpoints' health.
# Uptime Monitoring
Source: https://metoro.io/docs/uptime-monitoring/overview
Monitor the health and availability of your endpoints
# Uptime Monitoring
Metoro's Uptime Monitoring feature allows you to monitor the health and availability of your HTTP endpoints. You can configure monitors to regularly check your endpoints and track their response times and status.
## Features
* **Flexible Status Code Matching**: Support for exact matches (e.g., `200`), wildcards (e.g., `2XX`), and multiple patterns (e.g., `200,201,X04`)
* **Response Body Validation**: Validate response bodies against regular expressions
* **Custom Headers**: Add custom headers to your requests
* **Multiple HTTP Methods**: Support for GET, POST, PUT, PATCH, and DELETE
* **Configurable Check Frequency**: Monitor endpoints from every minute to every hour
* **Metric Generation**: Automatic generation of response time and status metrics
## Getting Started
1. Navigate to the Settings page in your Metoro dashboard
2. Select the "Integrations" tab
3. Click "Add Monitor" in the Uptime Monitoring section
You must be an admin to create or see uptime monitors.
## Configuration Options
### Basic Settings
* **Name**: A descriptive name for your monitor
* **Endpoint URL**: The URL to monitor
* **HTTP Method**: The HTTP method to use (GET, POST, PUT, PATCH, DELETE)
* **Check Frequency**: How often to check the endpoint
### Status Code Validation
You can specify expected status codes using:
* Exact codes: `200`
* Wildcards: `2XX` (any 2XX status) You *must* use uppercase for wildcards.
* Multiple patterns: `200,201,X04`
Examples:
* `200`: Expect exactly 200 OK
* `2XX`: Accept any successful response
* `X00`: Accept any status code ending in 00
* `200,201,202`: Accept any of these specific codes
### Response Body Validation
You can optionally validate the response body using regular expressions. This is useful for:
* Ensuring specific content is present
* Validating response format
* Checking for error messages
Example patterns:
* `.*"status":"healthy".*`: Check for a healthy status in JSON
* `^OK$`: Expect exactly "OK"
* `version: [0-9]+\.[0-9]+\.[0-9]+`: Match a semantic version number
### Headers
Add custom headers to your requests. Some common use cases:
* Authentication tokens
* API keys
* Content type specifications
For POST/PUT requests, the `Content-Type` header is automatically set to `application/json`.
### Request Body
For POST, PUT, and PATCH requests, you can specify a request body to send with each check.
### Metrics
Each monitor automatically generates two metrics:
* Response time metric: `uptime_monitor_[metric_name_base]_response_time`
* Status metric: `uptime_monitor_[metric_name_base]_status`
These metrics can be used in dashboards and alerts to monitor your endpoints' health.
All uptime monitoring results are logged and can be viewed in the logs view. The logs are published with:
* Service name: `uptime-monitor`
* Environment: `metoro-internal`
For successful checks:
* Log line: `Uptime check succeeded`
* Attributes include: status code, response body, endpoint pinged, latency
For failed checks:
* Log line: `Uptime check failed`
* Attributes include:
* Error field explaining why the check failed
* Status code (if received)
* Expected vs actual response body
* Endpoint pinged
* Latency (if request completed)
## Status Pages
Status pages provide a way to communicate your service's health and incidents to your users. You can create multiple status pages for different audiences or services.
### Creating a Status Page
1. Navigate to the Settings page in your Metoro dashboard
2. Select the "Status Pages" tab
3. Click "Create Status Page"
### Configuration Options
* **Name**: A descriptive name for your status page
* **Slug**: The URL-friendly identifier for your page (e.g., `status.yourdomain.com`)
* **Access**: Choose between public or private access
* Public: Anyone with the URL can view the status page
* Private: Only authenticated users can view the page
* **Branding**:
* Logo: Upload your company logo
* Favicon: Custom favicon for the status page
* Theme colors: Customize the look to match your brand
### Components
Components represent different parts of your service that you want to monitor. For each component:
1. **Name**: Name of the service component
2. **Description**: Optional description of what the component does
3. **Group**: Optionally group related components together
4. **Monitors**: Associate uptime monitors with this component
* Status will automatically update based on monitor results
* Multiple monitors can be assigned to a single component
### Incidents
When issues occur, you can create and manage incidents:
1. **Create Incident**:
* Title: Clear description of the issue
* Status: Current state (Investigating, Identified, Monitoring, Resolved)
* Impact: None, Minor, Major, or Critical
* Components: Affected components
* Description: Detailed information about the incident
2. **Update Incident**:
* Add new updates as the situation evolves
* Change status and impact level
* Mark as resolved when fixed
### Historical Data
Status pages automatically display:
* Uptime percentage for each component
* Response time trends
* Incident history
* Maintenance windows
* Daily, weekly, and monthly availability reports
### Subscribing to Updates
Users can subscribe to status updates via:
* Email notifications
* RSS feed
* Webhook notifications (for integration with other systems)
Status page metrics and incident data are retained for 1 year by default.
# Status Pages
Source: https://metoro.io/docs/uptime-monitoring/status-pages
Create and manage status pages to communicate service health
# Status Pages
Status pages provide a way to communicate your service's health and incidents to your users. You can create multiple status pages for different audiences or services.

## Creating a Status Page

1. Navigate to the Settings page in your Metoro dashboard
2. Select the "Integrations" tab
3. Click "Create Status Page"
## Configuration Options
* **Name**: A descriptive name for your status page
* **Slug**: The URL-friendly identifier for your page (e.g., `serviceX-status`)
* **Access**: Choose between public or private access
* Public: Anyone with the URL can view the status page
* Private: Only authenticated users can view the page
* **Monitors**: Associate uptime monitors with this component
* Status will automatically update based on monitor results
* Multiple monitors can be assigned to a single component
# User Management Overview
Source: https://metoro.io/docs/user-management/overview
Learn how to manage users, roles, and permissions in Metoro
User management in Metoro allows you to control access to your organization's resources through a comprehensive role-based access control (RBAC) system. The system consists of three main components:
1. **Users** - Individual accounts that can access your organization's Metoro instance
2. **Roles** - Collections of permissions that can be assigned to users
3. **Resource Types** - Different types of resources that can be accessed and managed within Metoro
## Built-in Roles
Metoro comes with two built-in roles:
* `default-metoro-admin` - Full access to all features including user management, integrations, billing, and settings
* `default-metoro-user` - Access to view observability data but cannot modify integrations, cluster settings, or billing
You can also create custom roles with specific permissions to better control access to different resources in your organization.
## Access Management
All user management operations are performed through the [settings page](https://us-east.metoro.io/settings?tab=users). To manage users and roles, you need to have the appropriate `accessManagement` permissions.
For detailed information about specific aspects of user management, please refer to:
* [Users](/user-management/users) - Adding and managing users
* [Roles](/user-management/roles) - Creating and managing roles
* [Resource Types](/user-management/resource-types) - Understanding different resource types and their permissions
# Resource Types
Source: https://metoro.io/docs/user-management/resource-types
Understanding resource types and their permissions in Metoro
Resource types in Metoro represent different categories of features and data that can be accessed and managed. Each resource type has its own set of permissions that can be granted through roles.
## Available Resource Types

### Access Management
* **Resource Type:** `accessManagement`
* **Description:** Controls user and role management capabilities
* **Permissions:**
* `create` - Create new users and roles
* `read` - View users and roles
* `update` - Modify existing users and roles
* `delete` - Remove users and roles
### Alerts
* **Resource Type:** `alerts`
* **Description:** Controls access to alert configurations and management
* **Permissions:**
* `create` - Create new alerts
* `read` - View existing alerts
* `update` - Modify alert configurations
* `delete` - Remove alerts
### Billing
* **Resource Type:** `billing`
* **Description:** Controls access to billing and subscription management
* **Permissions:**
* `create` - Create new billing configurations
* `read` - View billing information and usage
* `update` - Modify billing settings
* `delete` - Remove billing configurations
### Dashboards
* **Resource Type:** `dashboards`
* **Description:** Controls access to dashboard creation and management
* **Permissions:**
* `create` - Create new dashboards
* `read` - View dashboards
* `update` - Modify dashboard configurations
* `delete` - Remove dashboards
### Environments
* **Resource Type:** `environments`
* **Description:** Controls access to adding a new environment/cluster to Metoro or deleting the existing ones
* **Permissions:**
* `create` - Create (ie. Add) new environments/clusters to Metoro
* `delete` - Remove environments
* Note: Read access is available to all users, and update operations are not applicable
### Integrations
* **Resource Type:** `integrations`
* **Description:** Controls access to integration settings and configurations
* **Permissions:**
* `create` - Add new integrations
* `read` - View integration settings
* `update` - Modify integration settings
* `delete` - Remove integrations
### Log Filters
* **Resource Type:** `logFilters`
* **Description:** Controls access to log filter configurations
* **Permissions:**
* `create` - Create new log filters
* `read` - View log filters
* `update` - Modify log filter settings
* `delete` - Remove log filters
### Trace Redaction Rules
* **Resource Type:** `traceRedacts`
* **Description:** Controls access to trace redaction rule configurations
* **Permissions:**
* `create` - Create new redaction rules
* `read` - View redaction rules
* `update` - Modify redaction rules
* `delete` - Remove redaction rules
### Workflows
* **Resource Type:** `workflows`
* **Description:** Controls access to issues and workflows
* **Permissions:**
* `create` - Create new workflows
* `read` - View workflows and issues created by the workflows
* `update` - Modify workflow and issues configurations
* `delete` - Remove workflows
## Permission Inheritance
When a role is granted a permission on a resource type, users with that role automatically receive that permission for all resources of that type. For example, if a role has the `read` permission for `dashboards`, users with that role can view all dashboards in the organization.
## Best Practices
1. **Principle of Least Privilege**
* Grant only the permissions necessary for users to perform their tasks
* Regularly review and audit role permissions
* Consider starting with read-only access and adding other permissions as needed
2. **Role Organization**
* Create roles based on job functions or responsibilities
* Use descriptive names for custom roles
* Document the purpose and scope of each custom role
3. **Permission Management**
* Regularly audit user roles and permissions
* Remove unnecessary permissions promptly
* Use custom roles for fine-grained access control
# Managing Roles
Source: https://metoro.io/docs/user-management/roles
Learn how to create and manage roles in Metoro
Roles in Metoro are collections of permissions that define what actions users can perform on different resources. Each role consists of a set of permissions that grant access to specific resource types.

## Built-in Roles
Metoro provides two built-in roles that cannot be modified:
1. **default-metoro-admin**
* Full access to all features and resources
* Can manage users, roles, and permissions
* Can configure integrations and settings
* Can view and manage billing information
2. **default-metoro-user**
* Can view all observability data
* Cannot modify integrations or settings
* Cannot manage users or roles
* Cannot access billing information
## Custom Roles
To create a new role, you must have `create`, `update`, `read` permissions for the `accessManagement` resource type.
You can create custom roles to provide more granular access control for your users. When creating a custom role:
1. Navigate to the [Roles tab](https://us-east.metoro.io/settings?tab=users) in Settings -> Users -> Roles
2. Click the "Create Role" button
3. Enter a name and description for the role
4. Select the permissions you want to grant for each resource type
5. Click "Create" to save the role
Custom roles can be edited or deleted at any time by users with `accessManagement` permissions.
## Role Permissions
Each role contains a set of permissions that determine what actions users with that role can perform. Permissions are grouped by resource type and can include:
* `view` - Ability to view or read the resource
* `create` - Ability to create new instances of the resource
* `update` - Ability to modify existing instances of the resource
* `delete` - Ability to remove instances of the resource
For a detailed list of available permissions and their effects, see the [Resource Types](/user-management/resource-types) documentation.
# Managing Users
Source: https://metoro.io/docs/user-management/users
Learn how to add, remove, and manage users in your Metoro organization
The [settings page](https://us-east.metoro.io/settings?tab=users) in Metoro shows all the users that have been created or invited in your organization. Only users with the `accessManagement` permissions can make changes to the users and roles in the organization.

## Adding Users
To add a new user, make sure you have `create` and `update` permissions on your role for `accessManagement` resource type.

To invite a new user to your organization:
1. Click on the `Invite` button on the top right corner of the users view
2. Enter the email address of the user you want to invite
3. Select the role you want to assign to the user
4. Click on the `Invite` button to send the invitation
The user will receive an email with a link to accept the invitation and create an account.
If the invited user already has an account and you want them to join your organization, please contact Metoro support. We will help you with this process.
## Managing User Roles
You can assign roles to users to control their access to different resources in your organization. To assign roles:
1. Click the menu icon (three dots) next to the user you want to manage
2. Select "Assign Roles" from the dropdown menu
3. In the dialog that appears, select the roles you want to assign to the user
4. Click "Save" to apply the changes
Users can have multiple roles assigned to them. The permissions from all assigned roles are combined to determine the user's access level.
The user's roles are displayed in the "Roles" column of the users table.