> ## Documentation Index
> Fetch the complete documentation index at: https://metoro.io/docs/llms.txt
> Use this file to discover all available pages before exploring further.
# Kubernetes Resources
> Track and analyze Kubernetes resource changes over time
## Overview
Metoro provides comprehensive tracking of Kubernetes resources, capturing every update to give you a complete history of your cluster's state. This "time-travel" capability allows you to view your cluster's state at any point in time, not just its current state.
## Resource Tracking
The cluster agent watches and exports the following Kubernetes resources:
* Pods
* Deployments
* StatefulSets
* ReplicaSets
* DaemonSets
* Nodes
* Namespaces
* ConfigMaps
* Services
* ServiceAccounts
* Jobs
* CronJobs
* Endpoints
* Events
* Horizontal Pod Autoscalers
* Ingresses
* NetworkPolicies
* PersistentVolumeClaims
* PersistentVolumes
* MetoroNamespaceTelemetryRules
* MetoroClusterTelemetryRules
* MetoroNamespaceResourceRules
* MetoroClusterResourceRules
* MetoroAlerts
* MetoroDashboards
* MetoroWebhooks
Metoro explicitly does not export secrets. If you have resources you want to
exclude from exporting, you can remove them from the service account
permissions given to the cluster agent. See the permissions
[here](https://github.com/Chrisbattarbee/metoro-helm-charts/blob/62b809debce64758c2995b9feb988f37aca87bff/charts/metoro-exporter/templates/exporter_service_account.yaml#L10).
## Metoro RBAC Resources
Metoro groups and access rules can be declared as Kubernetes custom resources: `MetoroGroup`, `MetoroNamespaceTelemetryRule`, `MetoroClusterTelemetryRule`, `MetoroNamespaceResourceRule`, and `MetoroClusterResourceRule`. On on-prem installs, `MetoroGroup` exists only in the Metoro Hub cluster so group creation stays centralized. The rule resources live in monitored clusters; the exporter watches them and exports their YAML through the Kubernetes resource history pipeline like any other resource, and Metoro syncs them into roles and permissions.
See [Kubernetes RBAC Resources](/docs/user-management/kubernetes-crds) for the full reference and worked examples.
## Metoro Alert Resources
Metoro alerts can be declared with the namespaced `MetoroAlert` custom resource. The exporter watches these resources and exports their YAML through the Kubernetes resource history pipeline. The apiserver syncs active `MetoroAlert` resources into Metoro alerts under `/alerts/kubernetes-managed///`.
Kubernetes-managed alerts are visible in Metoro, but cannot be edited or deleted from the UI or API because the Kubernetes resource is the source of truth. To change one of these alerts, update or delete the `MetoroAlert` resource in Kubernetes, then use the Kubernetes alert sync if you need an immediate refresh.
### Exporting existing alerts
You can export an existing alert as a ready-to-apply `MetoroAlert` manifest from the alert page: open the alert, choose **Export**, then **Metoro CRD Format**. Alerts using deprecated alert types or aggregate conditions cannot be exported; convert them to the current timeseries format first.
The exported manifest omits `metadata.namespace`, so apply it to the namespace of your choice:
```bash theme={null}
kubectl apply -n -f my-alert-metoroalert.yaml
```
Exporting does not change the original alert. Once the applied `MetoroAlert` resource has synced, delete the original alert in the UI to avoid firing duplicate alerts.
## Metoro Dashboard Resources
Metoro dashboards can be declared with the namespaced `MetoroDashboard` custom resource. The exporter watches these resources and exports their YAML through the Kubernetes resource history pipeline. The apiserver syncs active `MetoroDashboard` resources into Metoro dashboards under `/dashboards/kubernetes-managed///`.
Each `MetoroDashboard` resource manages one Metoro dashboard. Kubernetes-managed dashboards are visible in Metoro, but cannot be edited or deleted from the UI or API because the Kubernetes resource is the source of truth. To change one of these dashboards, update or delete the `MetoroDashboard` resource in Kubernetes, then use the dashboard sync if you need an immediate refresh.
## Metoro Webhook Resources
Metoro webhook integrations can be declared with the namespaced `MetoroWebhook` custom resource. The exporter watches these resources and exports their YAML through the Kubernetes resource history pipeline. The apiserver syncs active `MetoroWebhook` resources into Metoro webhook integrations under `/webhooks/kubernetes-managed///` with deterministic IDs like `kubernetes-managed...`.
Kubernetes-managed webhooks are visible in Metoro, but cannot be edited or deleted from the UI or API because the Kubernetes resource is the source of truth. To change one of these webhooks, update or delete the `MetoroWebhook` resource in Kubernetes.
## Resource Metrics
Kubernetes resources can be analyzed using the `kubernetes_resource` metric type. This allows you to:
### Count Resources
Track the number of resources by various attributes:
```sql theme={null}
# Count pods by service
kubernetes_resource{kind="Pod"}
| group_by(service_name)
# Count resources by namespace
kubernetes_resource{kind="Deployment"}
| group_by(namespace)
```
### Resource Attributes
Common attributes available for filtering and grouping:
* Environment
* Namespace
* Kind
* Resource name
* Service name
* Additional attributes specific to resource types
### Track Resource State
Monitor specific resource attributes over time:
```sql theme={null}
# Track HPA expected replicas
kubernetes_resource{kind="HorizontalPodAutoscaler"}
| select(max(status.expectedReplicas))
# Compare current vs desired replicas
kubernetes_resource{kind="HorizontalPodAutoscaler"}
| select(
max(status.currentReplicas),
max(status.desiredReplicas)
)
```
## JSON Path Queries
When querying Kubernetes resources metrics, you can use JSON Path expressions to extract specific values from the resource manifests. This is particularly useful when you want to aggregate or analyze specific fields within your Kubernetes resources.
### Using JSON Path in Metrics
The JSON Path functionality allows you to:
* Extract specific fields from Kubernetes resource manifests
* Aggregate values from nested structures
* Query array elements and complex objects
For example, you can:
* Get the number of replicas from a Deployment: `spec.replicas`
* Extract resource limits: `spec.template.spec.containers[*].resources.limits.cpu`
* Count available ports: `spec.ports[*].port`
### Syntax
The JSON Path syntax follows the standard format:
* `.` is used for child operator
* `[*]` is used for array iteration
* `[?()]` supports filters
### Examples
Here are some common use cases:
1. **Deployment Resource Requests and Limits**
```jsonpath theme={null}
spec.template.spec.containers[*].resources.requests.memory
spec.template.spec.containers[*].resources.limits.cpu
```
2. **Pod Image**
```jsonpath theme={null}
spec.template.spec.containers[*].image
```
3. **Deployment Configuration**
```jsonpath theme={null}
spec.replicas
spec.strategy.type
```
3. **Service Configuration**
```jsonpath theme={null}
$.spec.ports[*].port
$.spec.type
```
4. **Deployment Pod Template**
```jsonpath theme={null}
$.spec.template.spec.containers[*].image
$.spec.template.spec.containers[*].name
```
### Usage in Metoro
An example of a JSON Path query in Metoro:
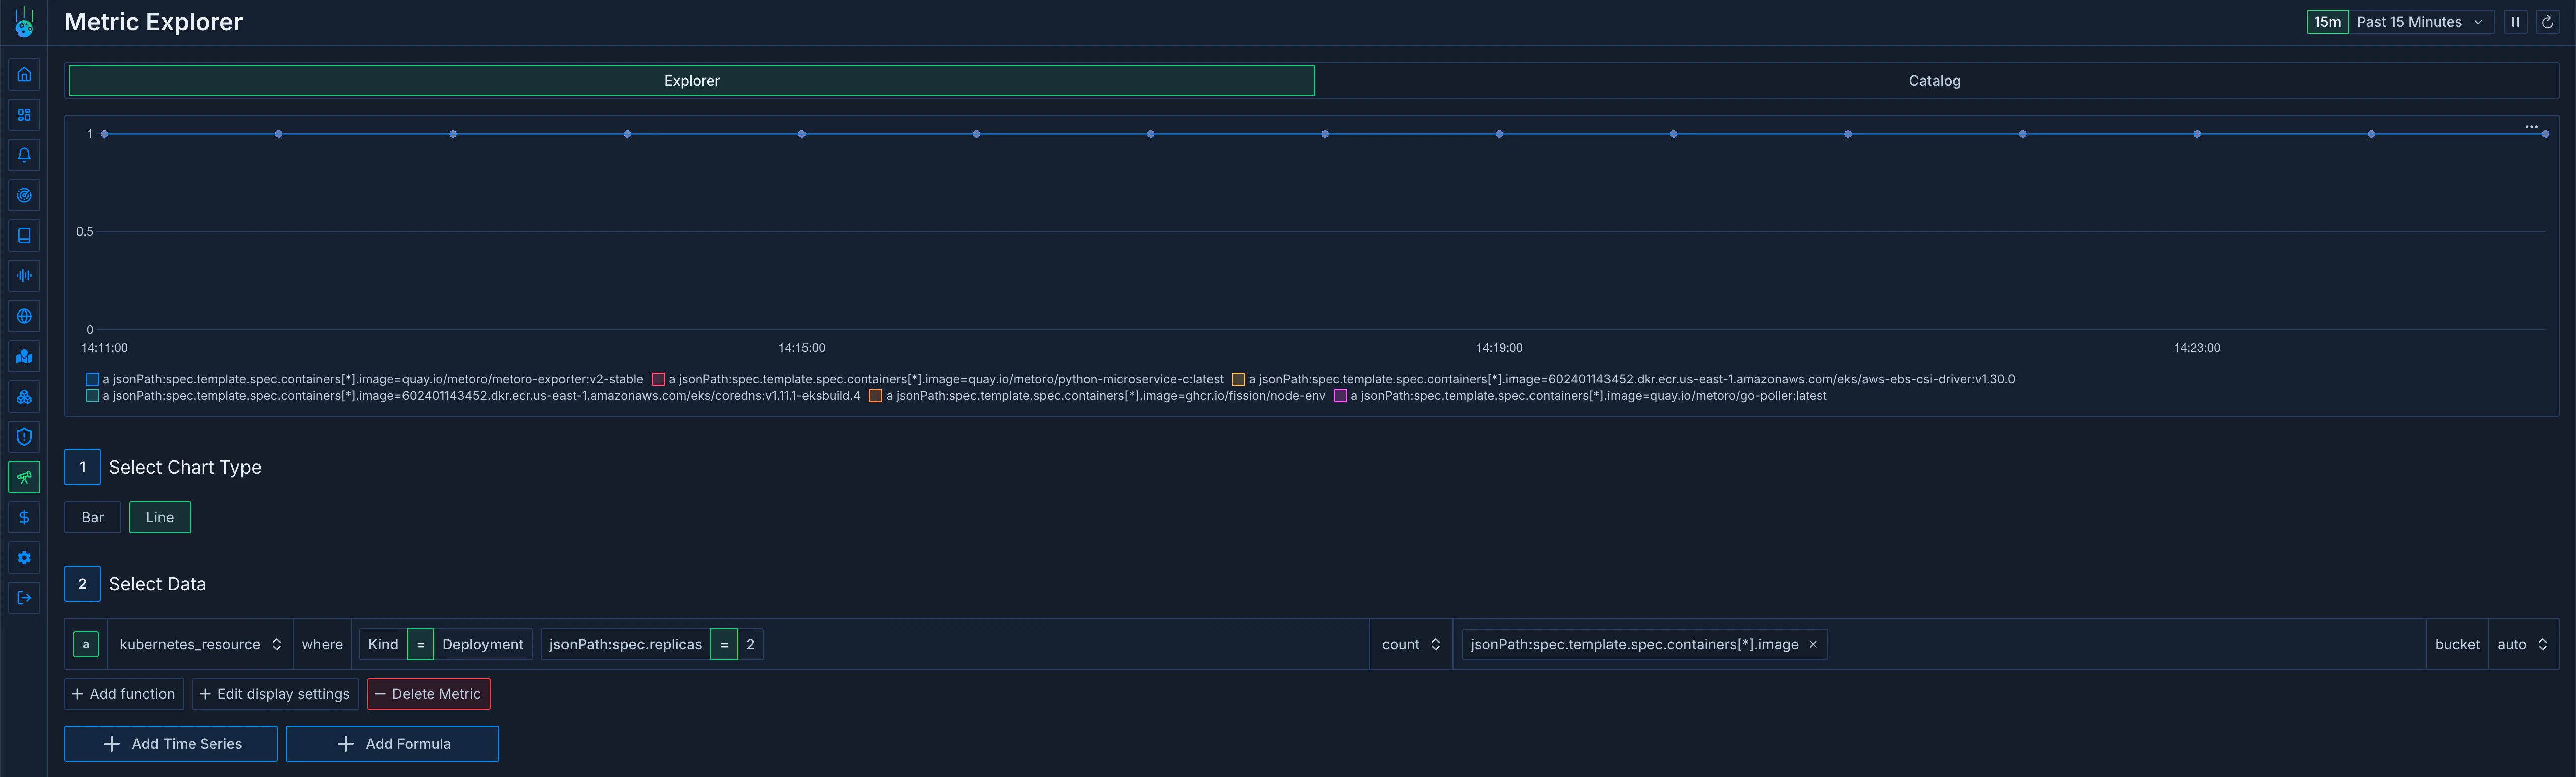 Note: If no JSON Path is specified or the path doesn't match any values, the metric will return null values.
## Viewing Resources
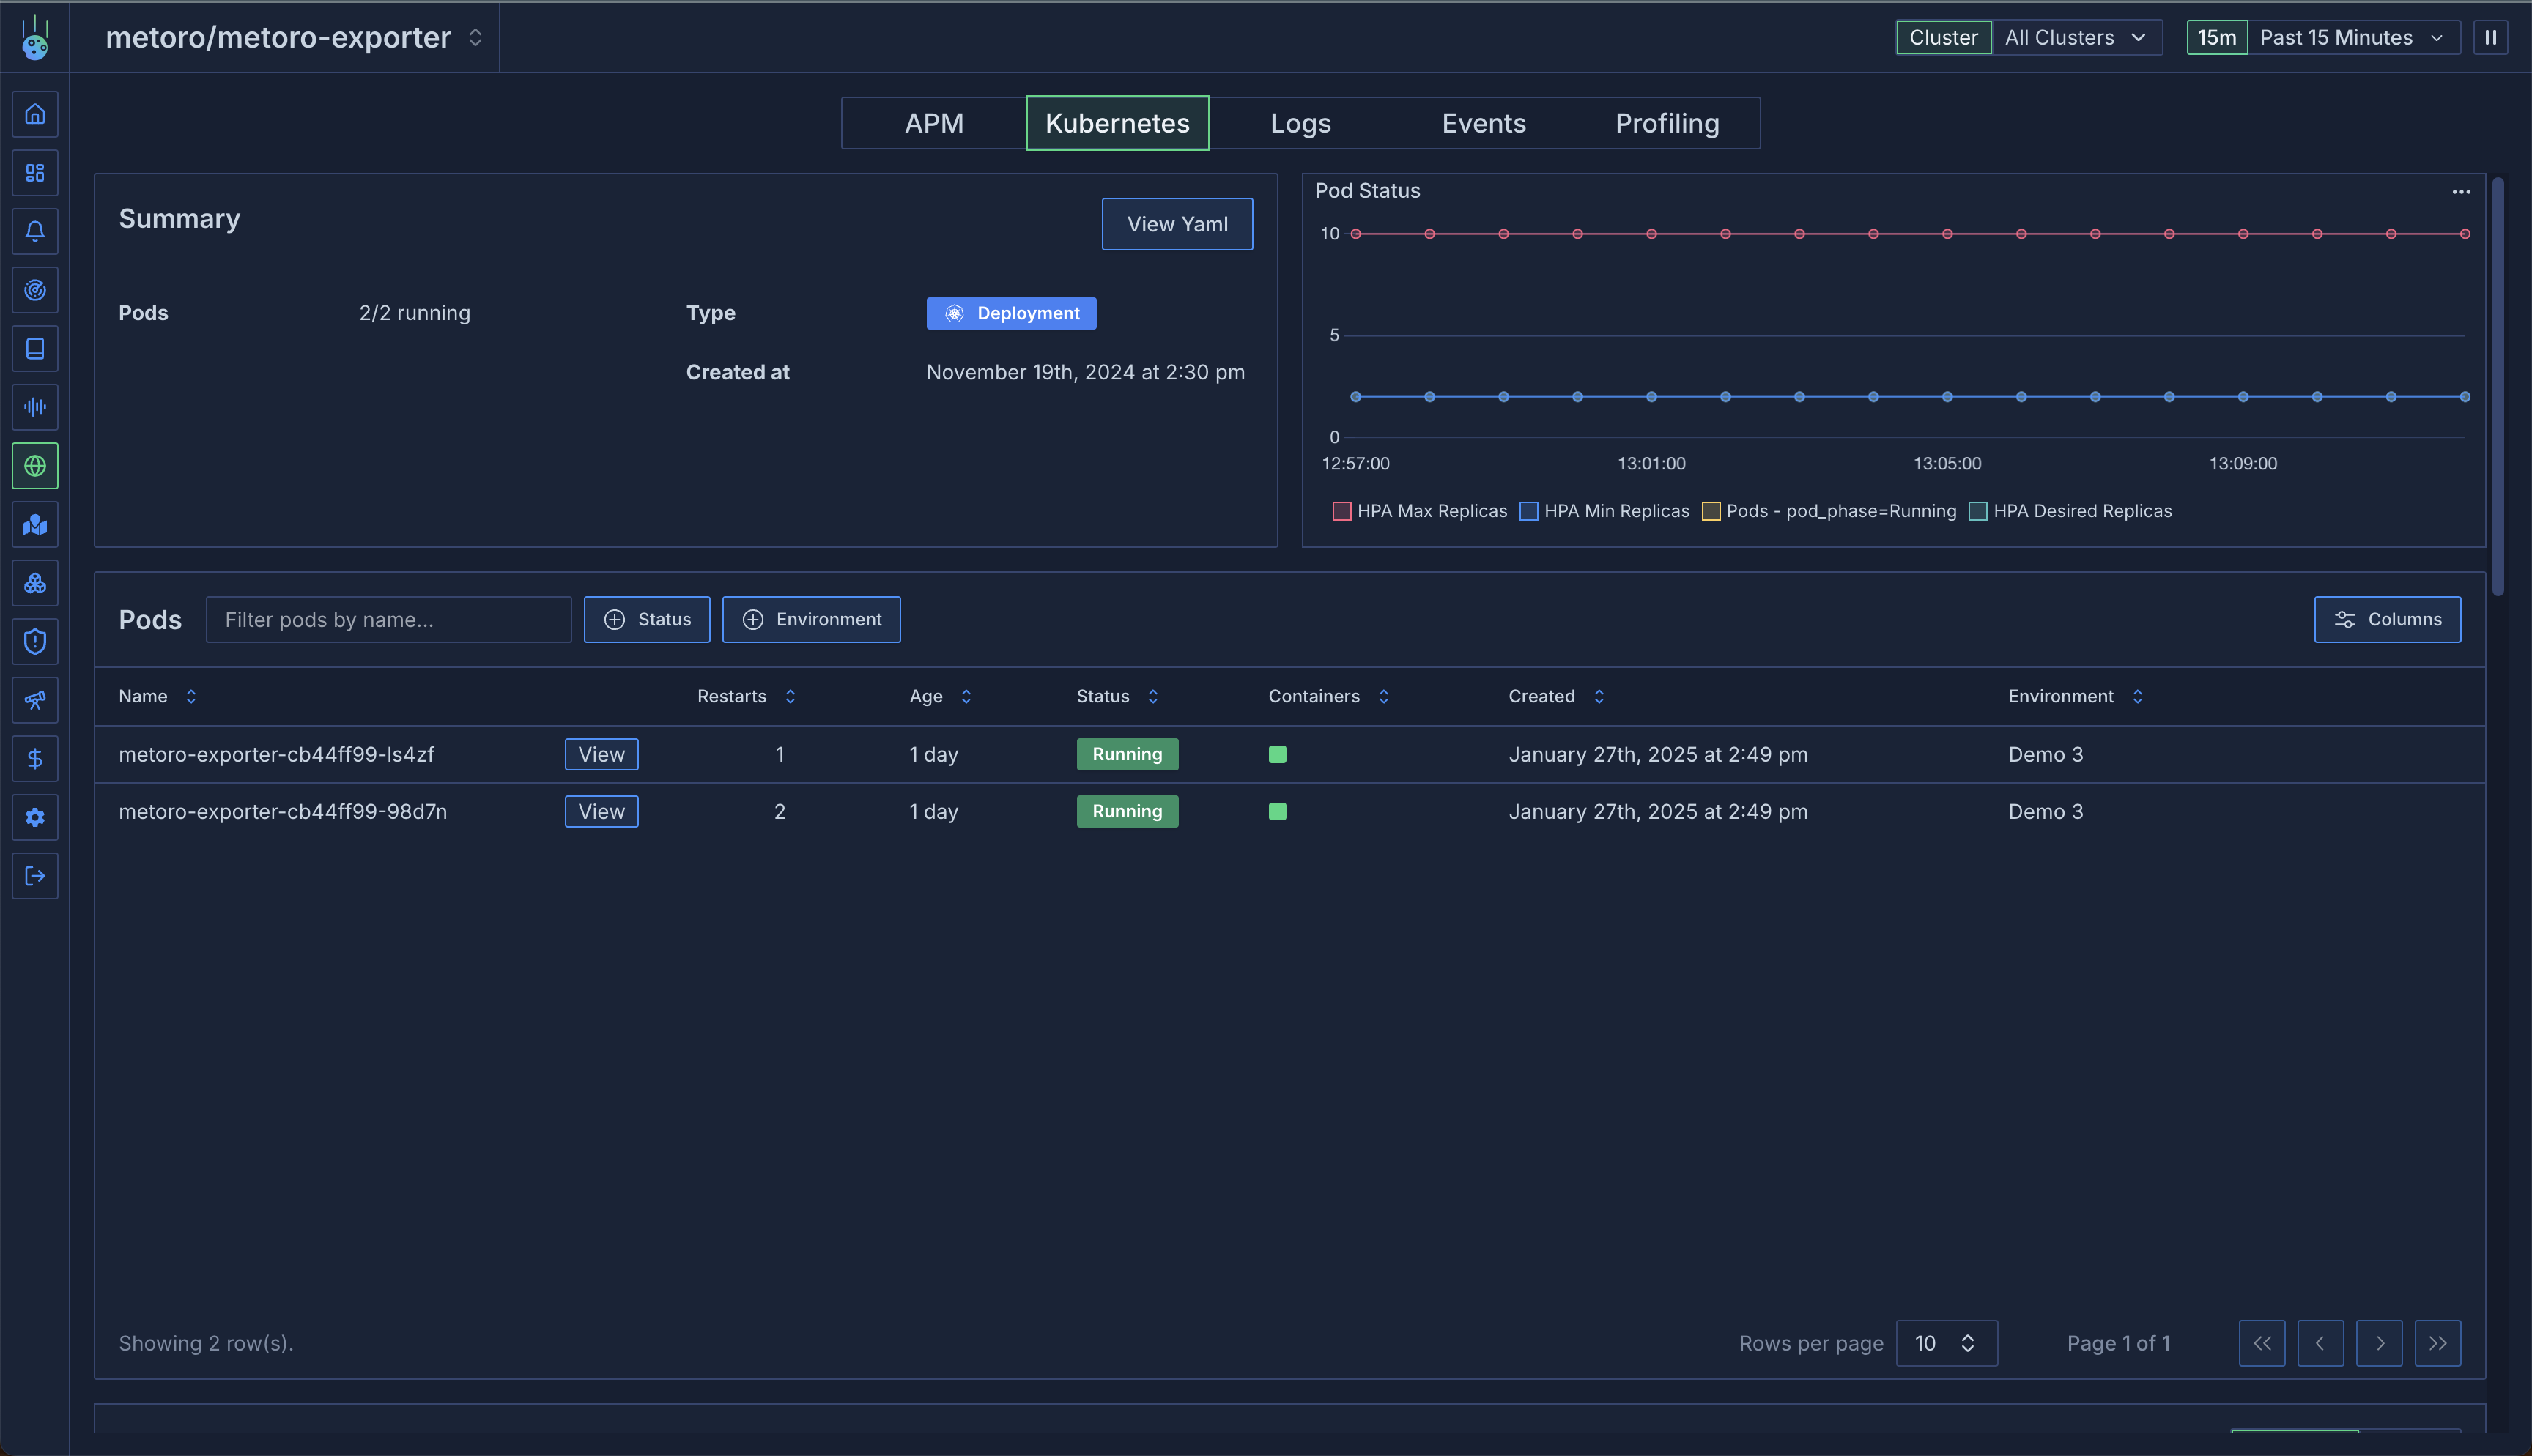
The primary way to explore Kubernetes resources in Metoro is [Resource Viewer](/docs/kubernetes-resources/resource-viewer), a K9s-style interface for navigating resource state across time.
You can use it to:
1. Browse resources across the cluster by kind
2. Filter by namespace and search text
3. Inspect point-in-time resource state, manifests, and events
You can also access a scoped, embedded Resource Viewer from service and infrastructure pages when you want to stay focused on a single service or node context.
Note: If no JSON Path is specified or the path doesn't match any values, the metric will return null values.
## Viewing Resources
The primary way to explore Kubernetes resources in Metoro is [Resource Viewer](/docs/kubernetes-resources/resource-viewer), a K9s-style interface for navigating resource state across time.
You can use it to:
1. Browse resources across the cluster by kind
2. Filter by namespace and search text
3. Inspect point-in-time resource state, manifests, and events
You can also access a scoped, embedded Resource Viewer from service and infrastructure pages when you want to stay focused on a single service or node context.
 ## Use Cases
1. **Change Tracking**:
* Track configuration changes
* Monitor scaling events
* Debug resource modifications
2. **Resource Analysis**:
* Count resources by type
* Monitor replica counts
* Track resource distribution
3. **Historical Debugging**:
* View past cluster states
* Analyze resource evolution
* Investigate incidents
## Best Practices
1. **Resource Monitoring**:
* Track critical resource counts
* Monitor scaling patterns
* Set up alerts for unexpected changes
2. **Historical Analysis**:
* Use time-travel for debugging
* Compare states across time periods
* Track configuration evolution
3. **Metric Usage**:
* Group resources meaningfully
* Track relevant attributes
* Combine with other metric types
## Use Cases
1. **Change Tracking**:
* Track configuration changes
* Monitor scaling events
* Debug resource modifications
2. **Resource Analysis**:
* Count resources by type
* Monitor replica counts
* Track resource distribution
3. **Historical Debugging**:
* View past cluster states
* Analyze resource evolution
* Investigate incidents
## Best Practices
1. **Resource Monitoring**:
* Track critical resource counts
* Monitor scaling patterns
* Set up alerts for unexpected changes
2. **Historical Analysis**:
* Use time-travel for debugging
* Compare states across time periods
* Track configuration evolution
3. **Metric Usage**:
* Group resources meaningfully
* Track relevant attributes
* Combine with other metric types