> ## Documentation Index
> Fetch the complete documentation index at: https://metoro.io/docs/llms.txt
> Use this file to discover all available pages before exploring further.
# Infrastructure View
> Monitor and analyze your Kubernetes cluster nodes and their resources
## Overview
The Infrastructure view provides comprehensive monitoring and analysis of nodes across your Kubernetes clusters. It combines node-focused metrics with an embedded Resource Viewer experience for fast drill-down.
## Node Overview
### Node Resource Explorer
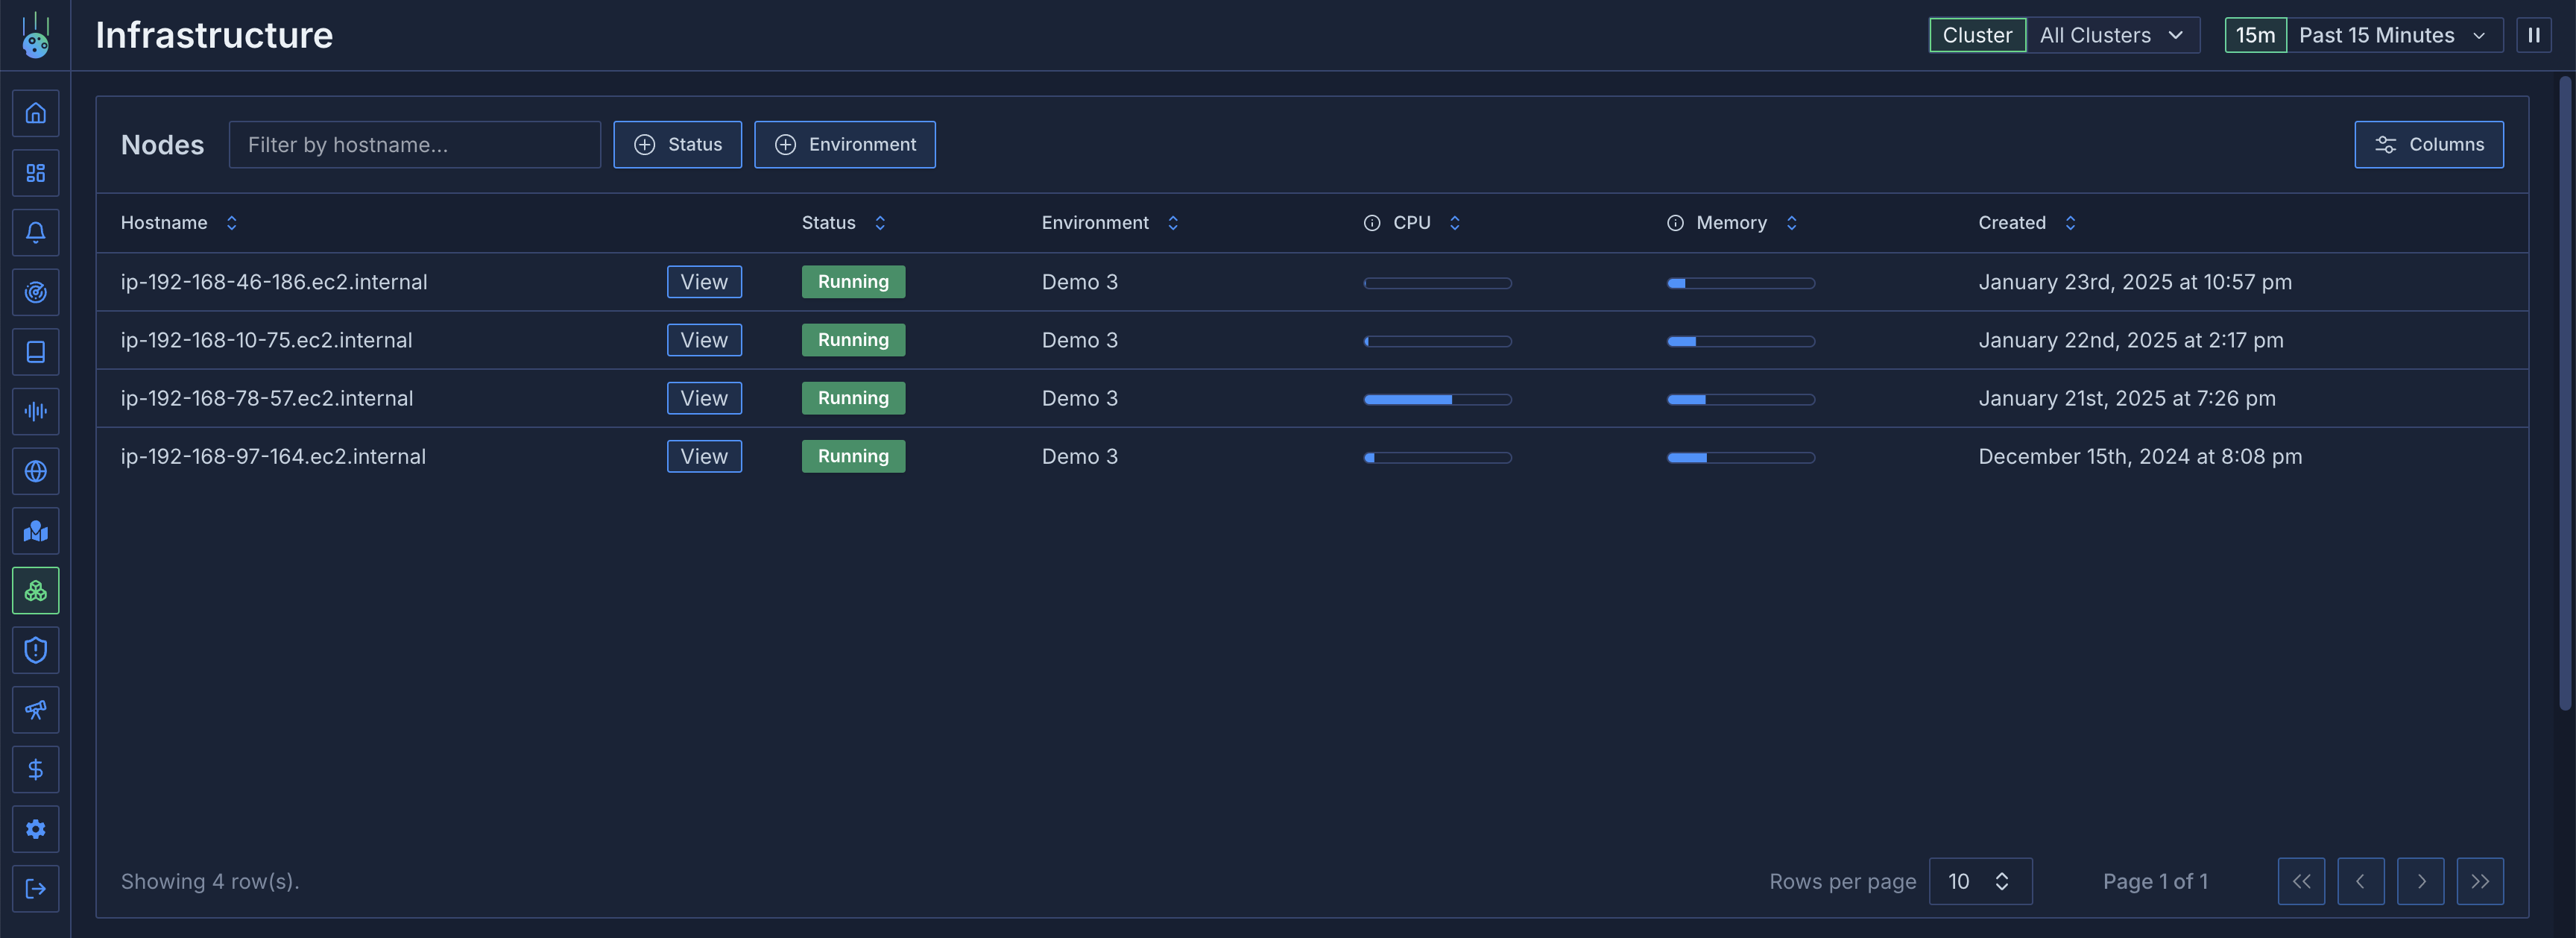
The top section uses Resource Viewer in a node-focused mode, where you can:
* Node names (searchable)
* Inspect node status and age
* Review CPU and memory usage context
* Filter and drill into node details over the selected time range
 ## Node Details
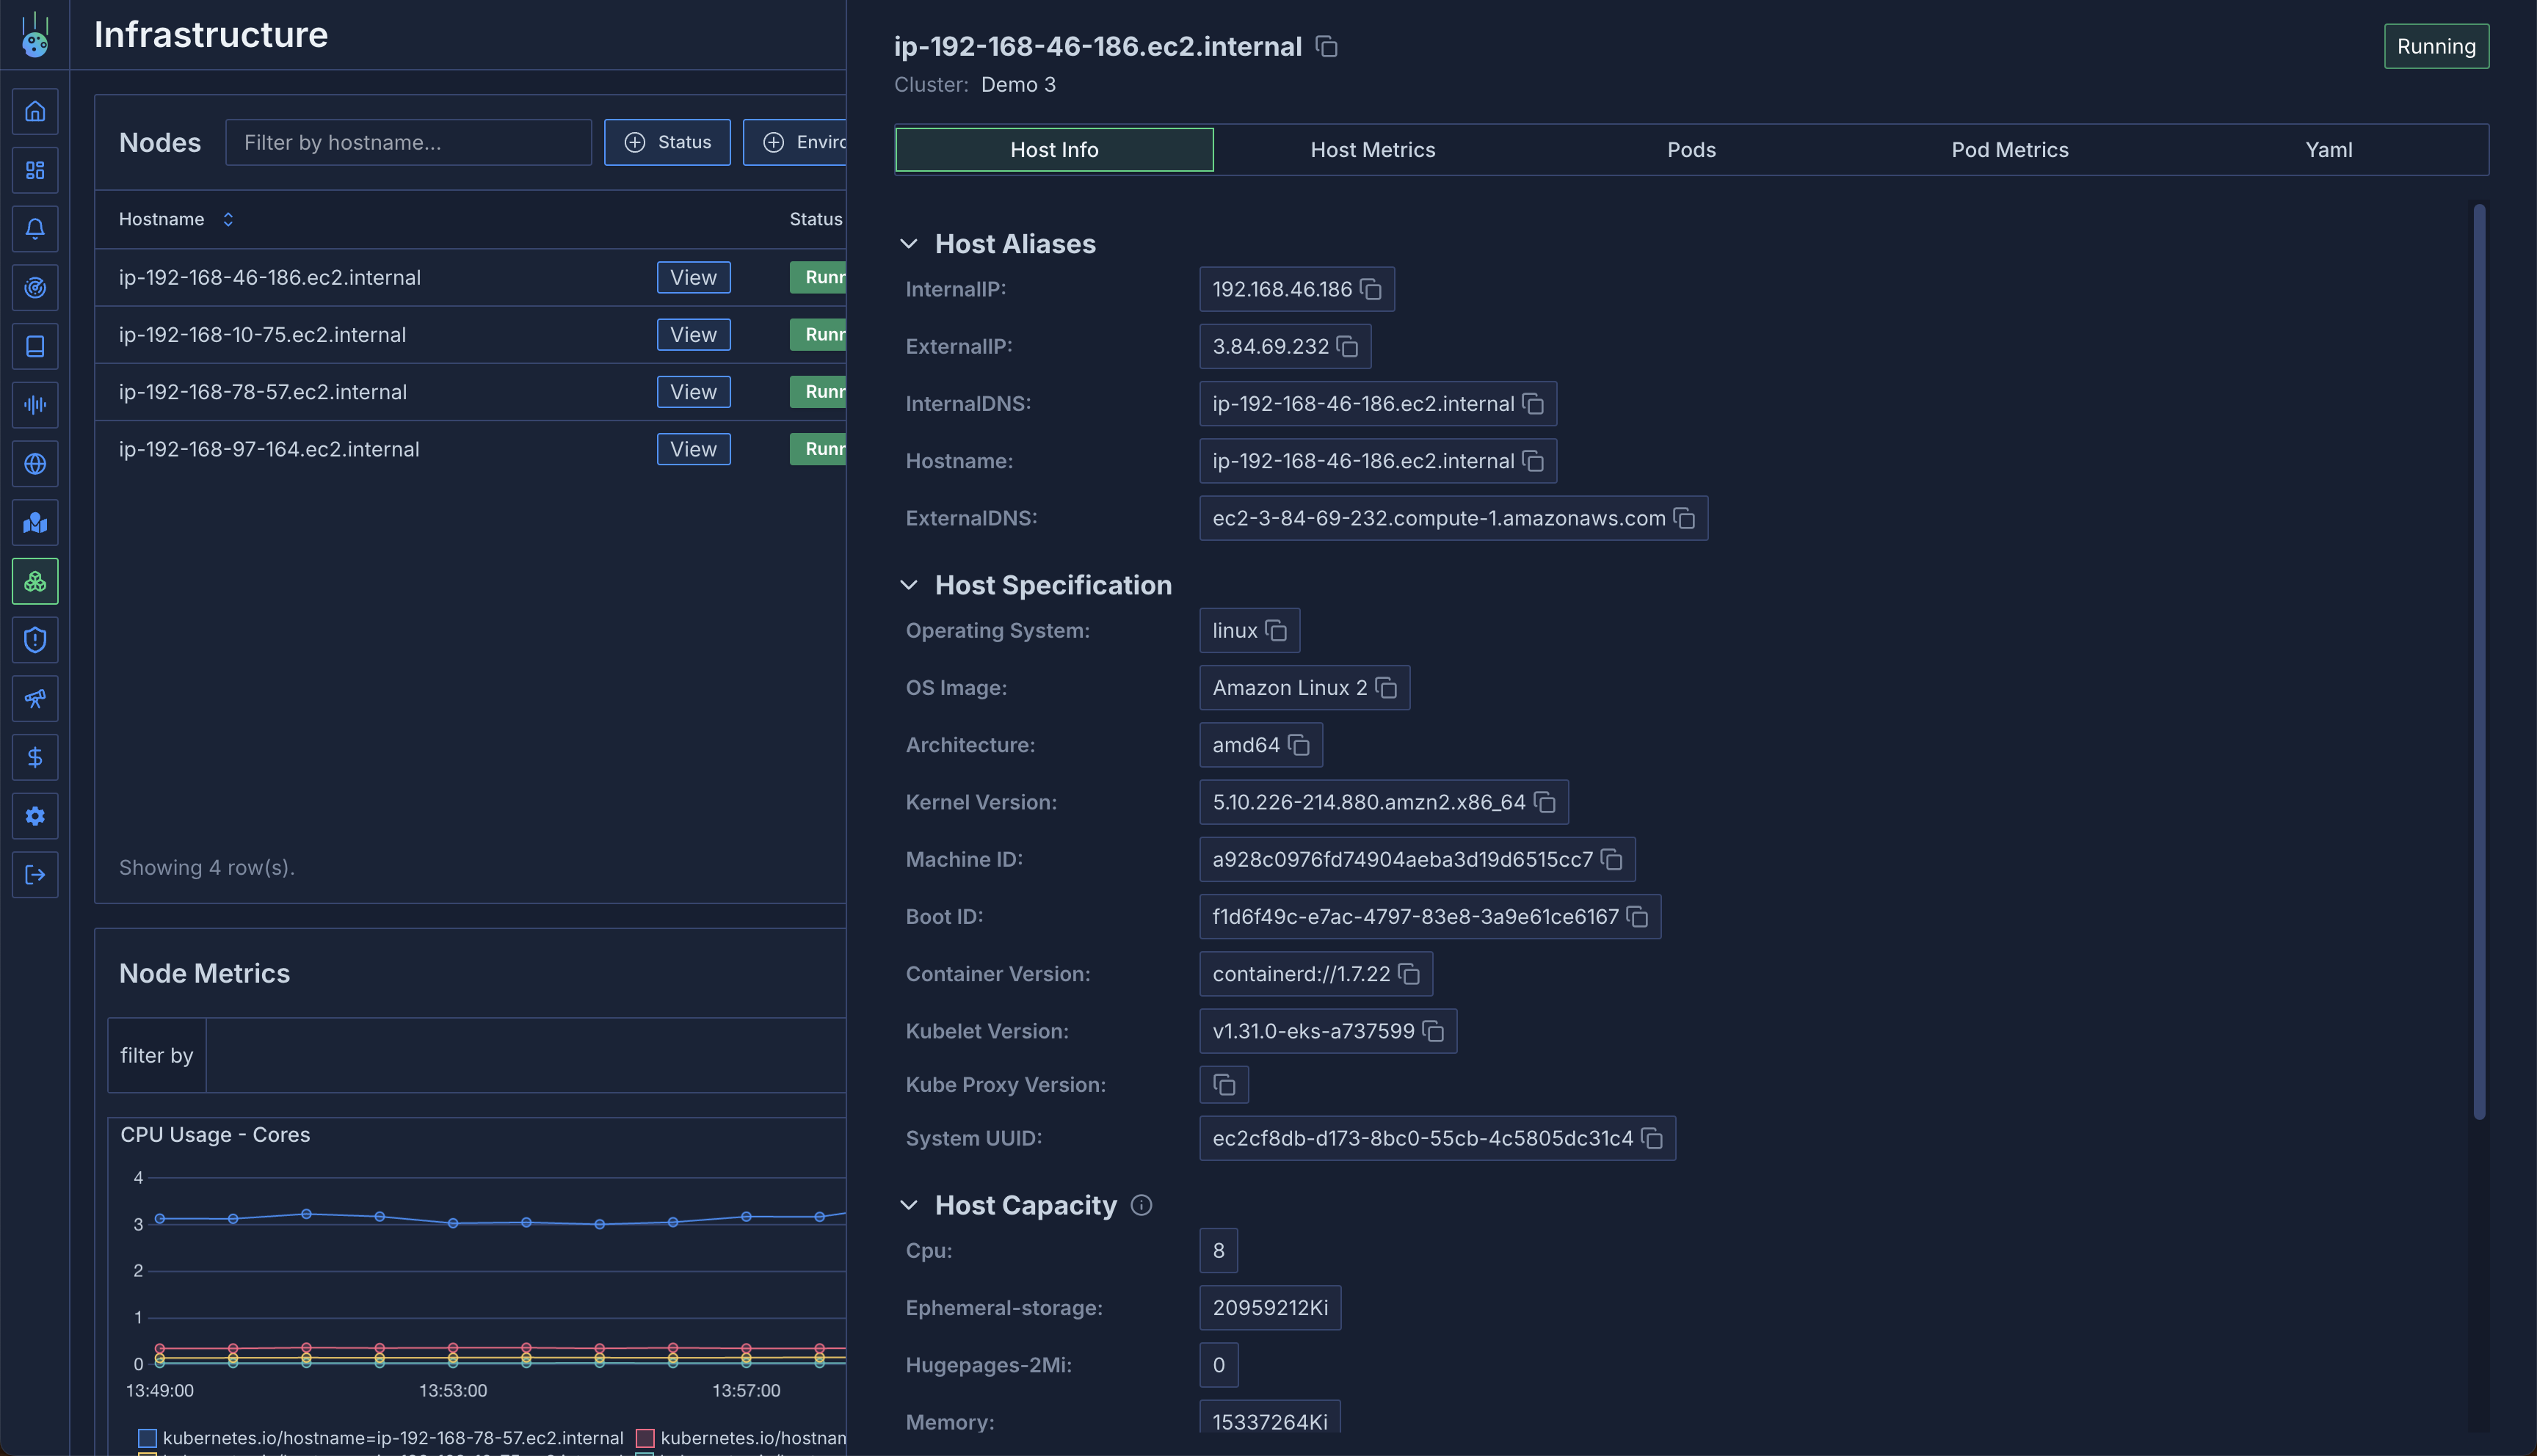
Click on any node to access detailed information across several tabs.
## Node Details
Click on any node to access detailed information across several tabs.
 ### General Information
* Node capacity
* Available resources
* Kubernetes node metadata
* System information
### Host Metrics
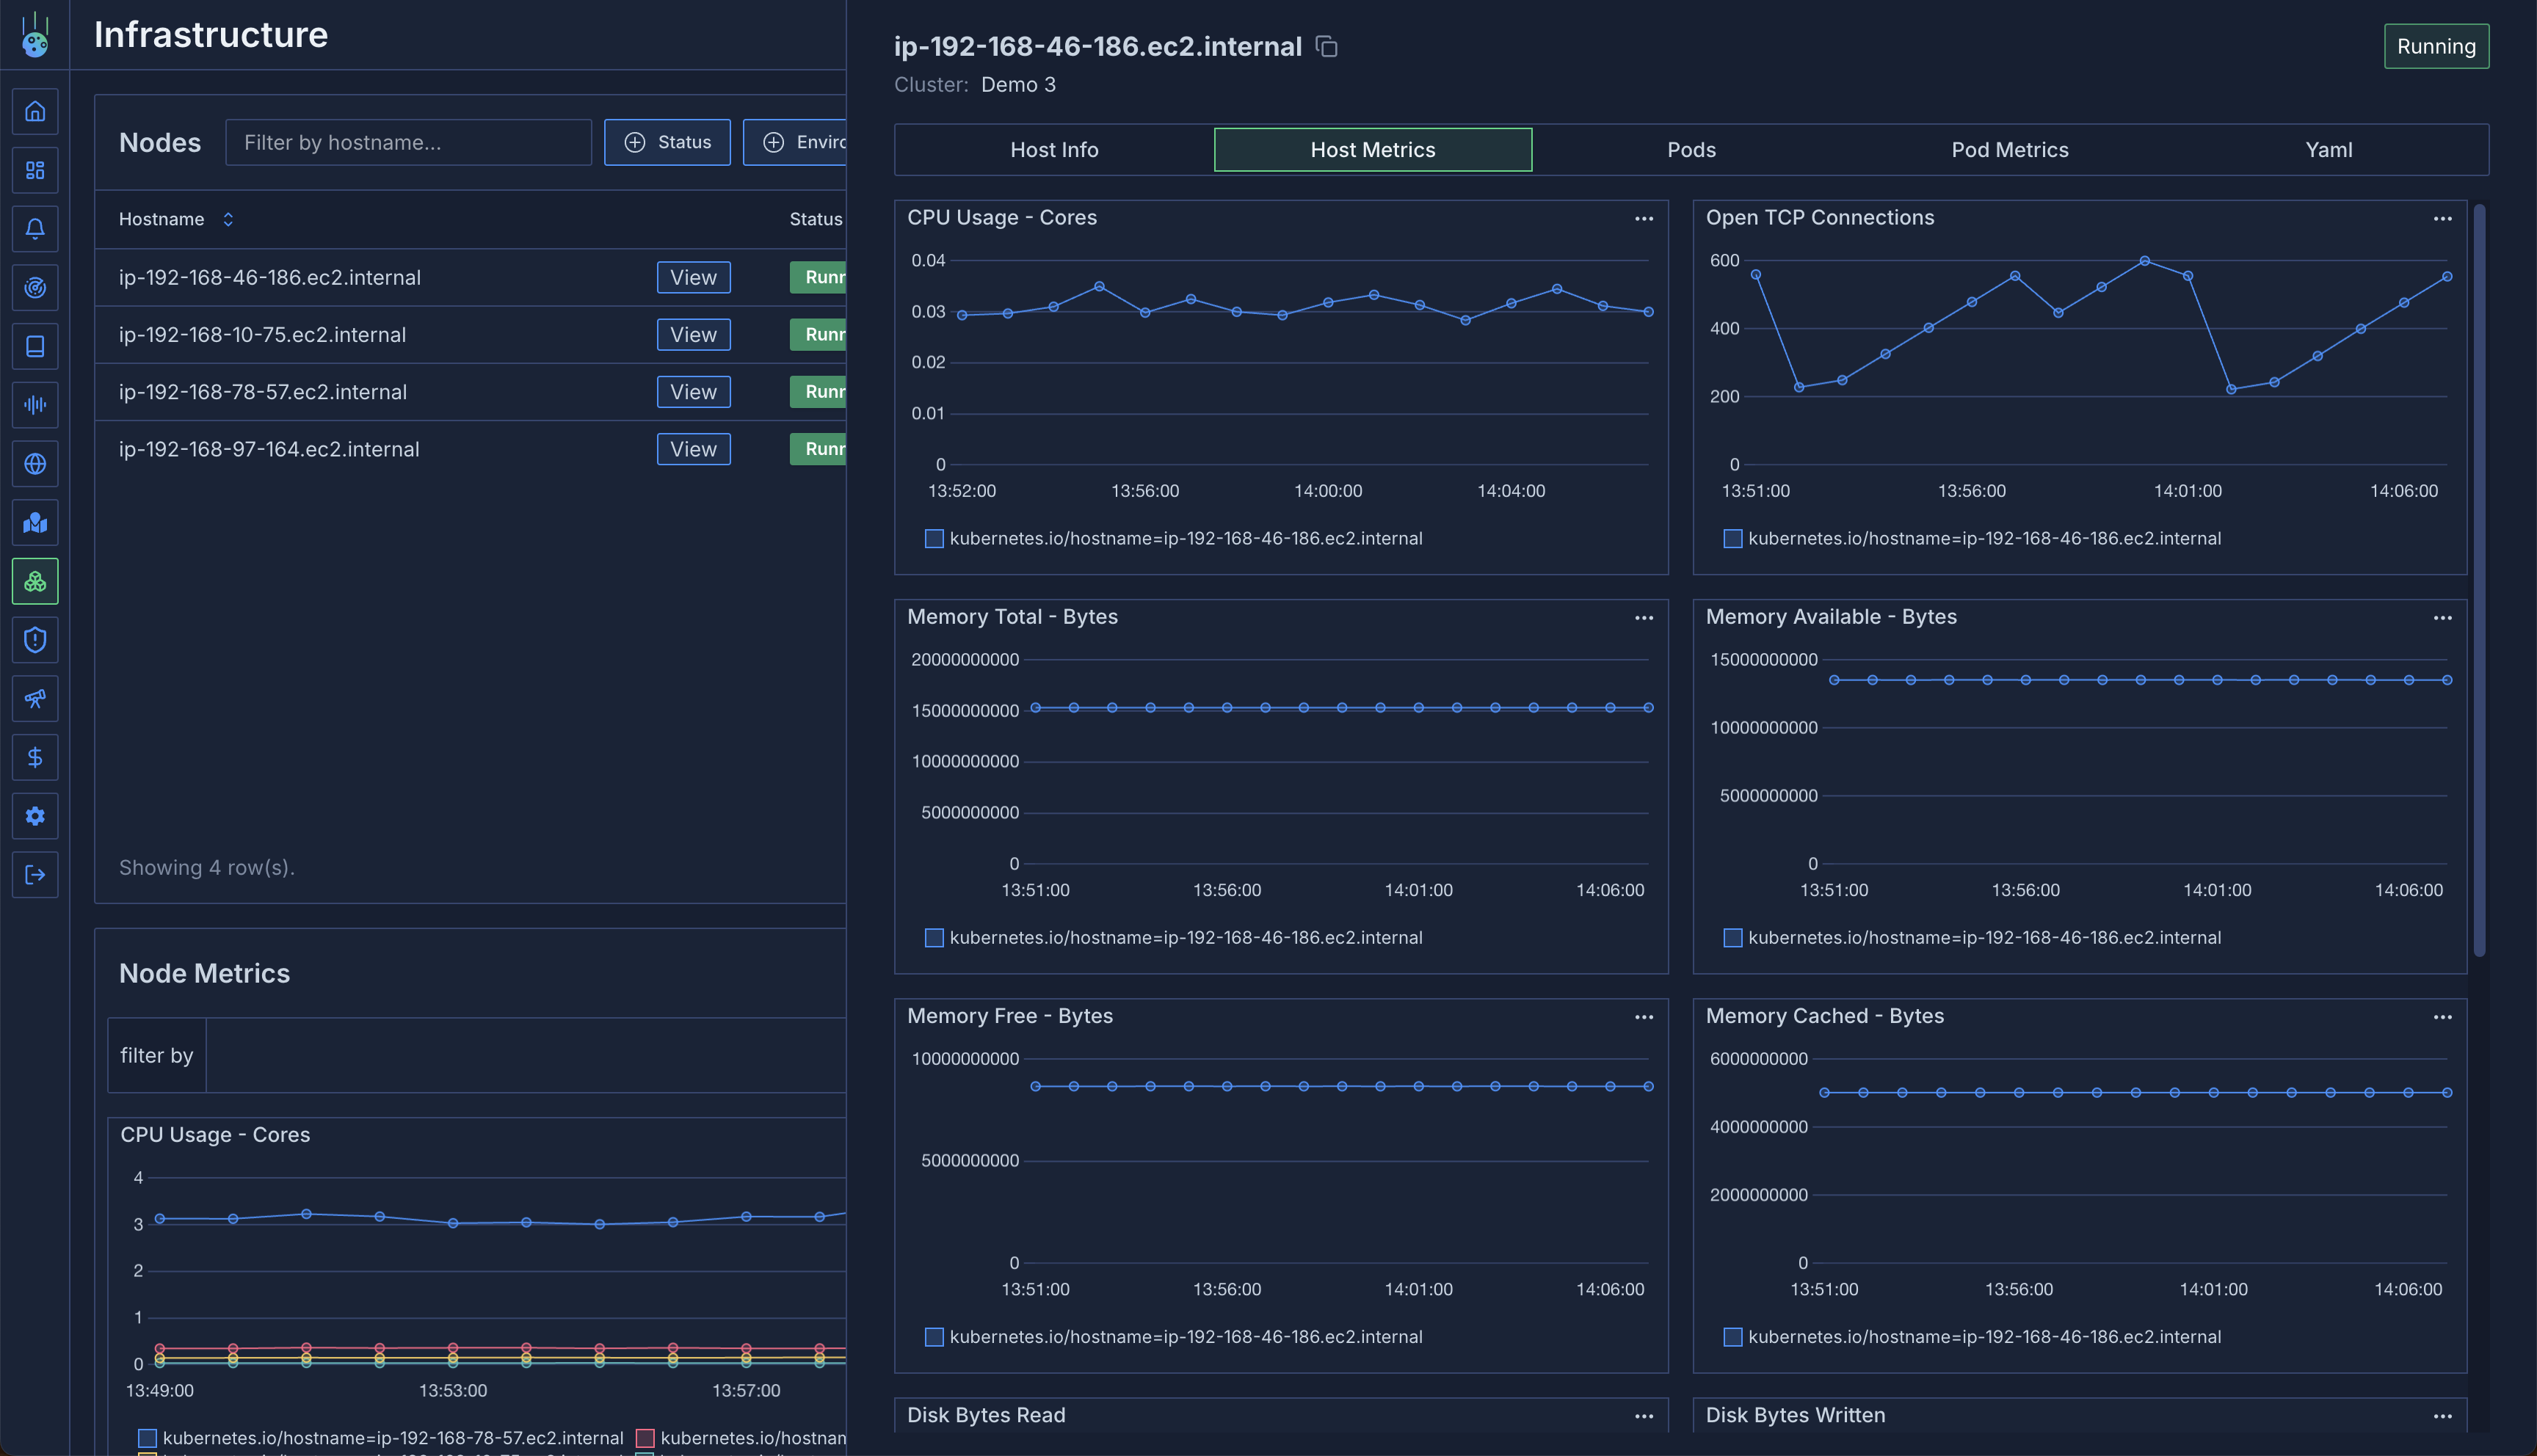
Monitor system-level metrics:
* CPU utilization
* Memory usage
* Disk usage
* Network throughput (transmitted/received bytes)
* Additional system metrics
### General Information
* Node capacity
* Available resources
* Kubernetes node metadata
* System information
### Host Metrics
Monitor system-level metrics:
* CPU utilization
* Memory usage
* Disk usage
* Network throughput (transmitted/received bytes)
* Additional system metrics
 ### Pods View
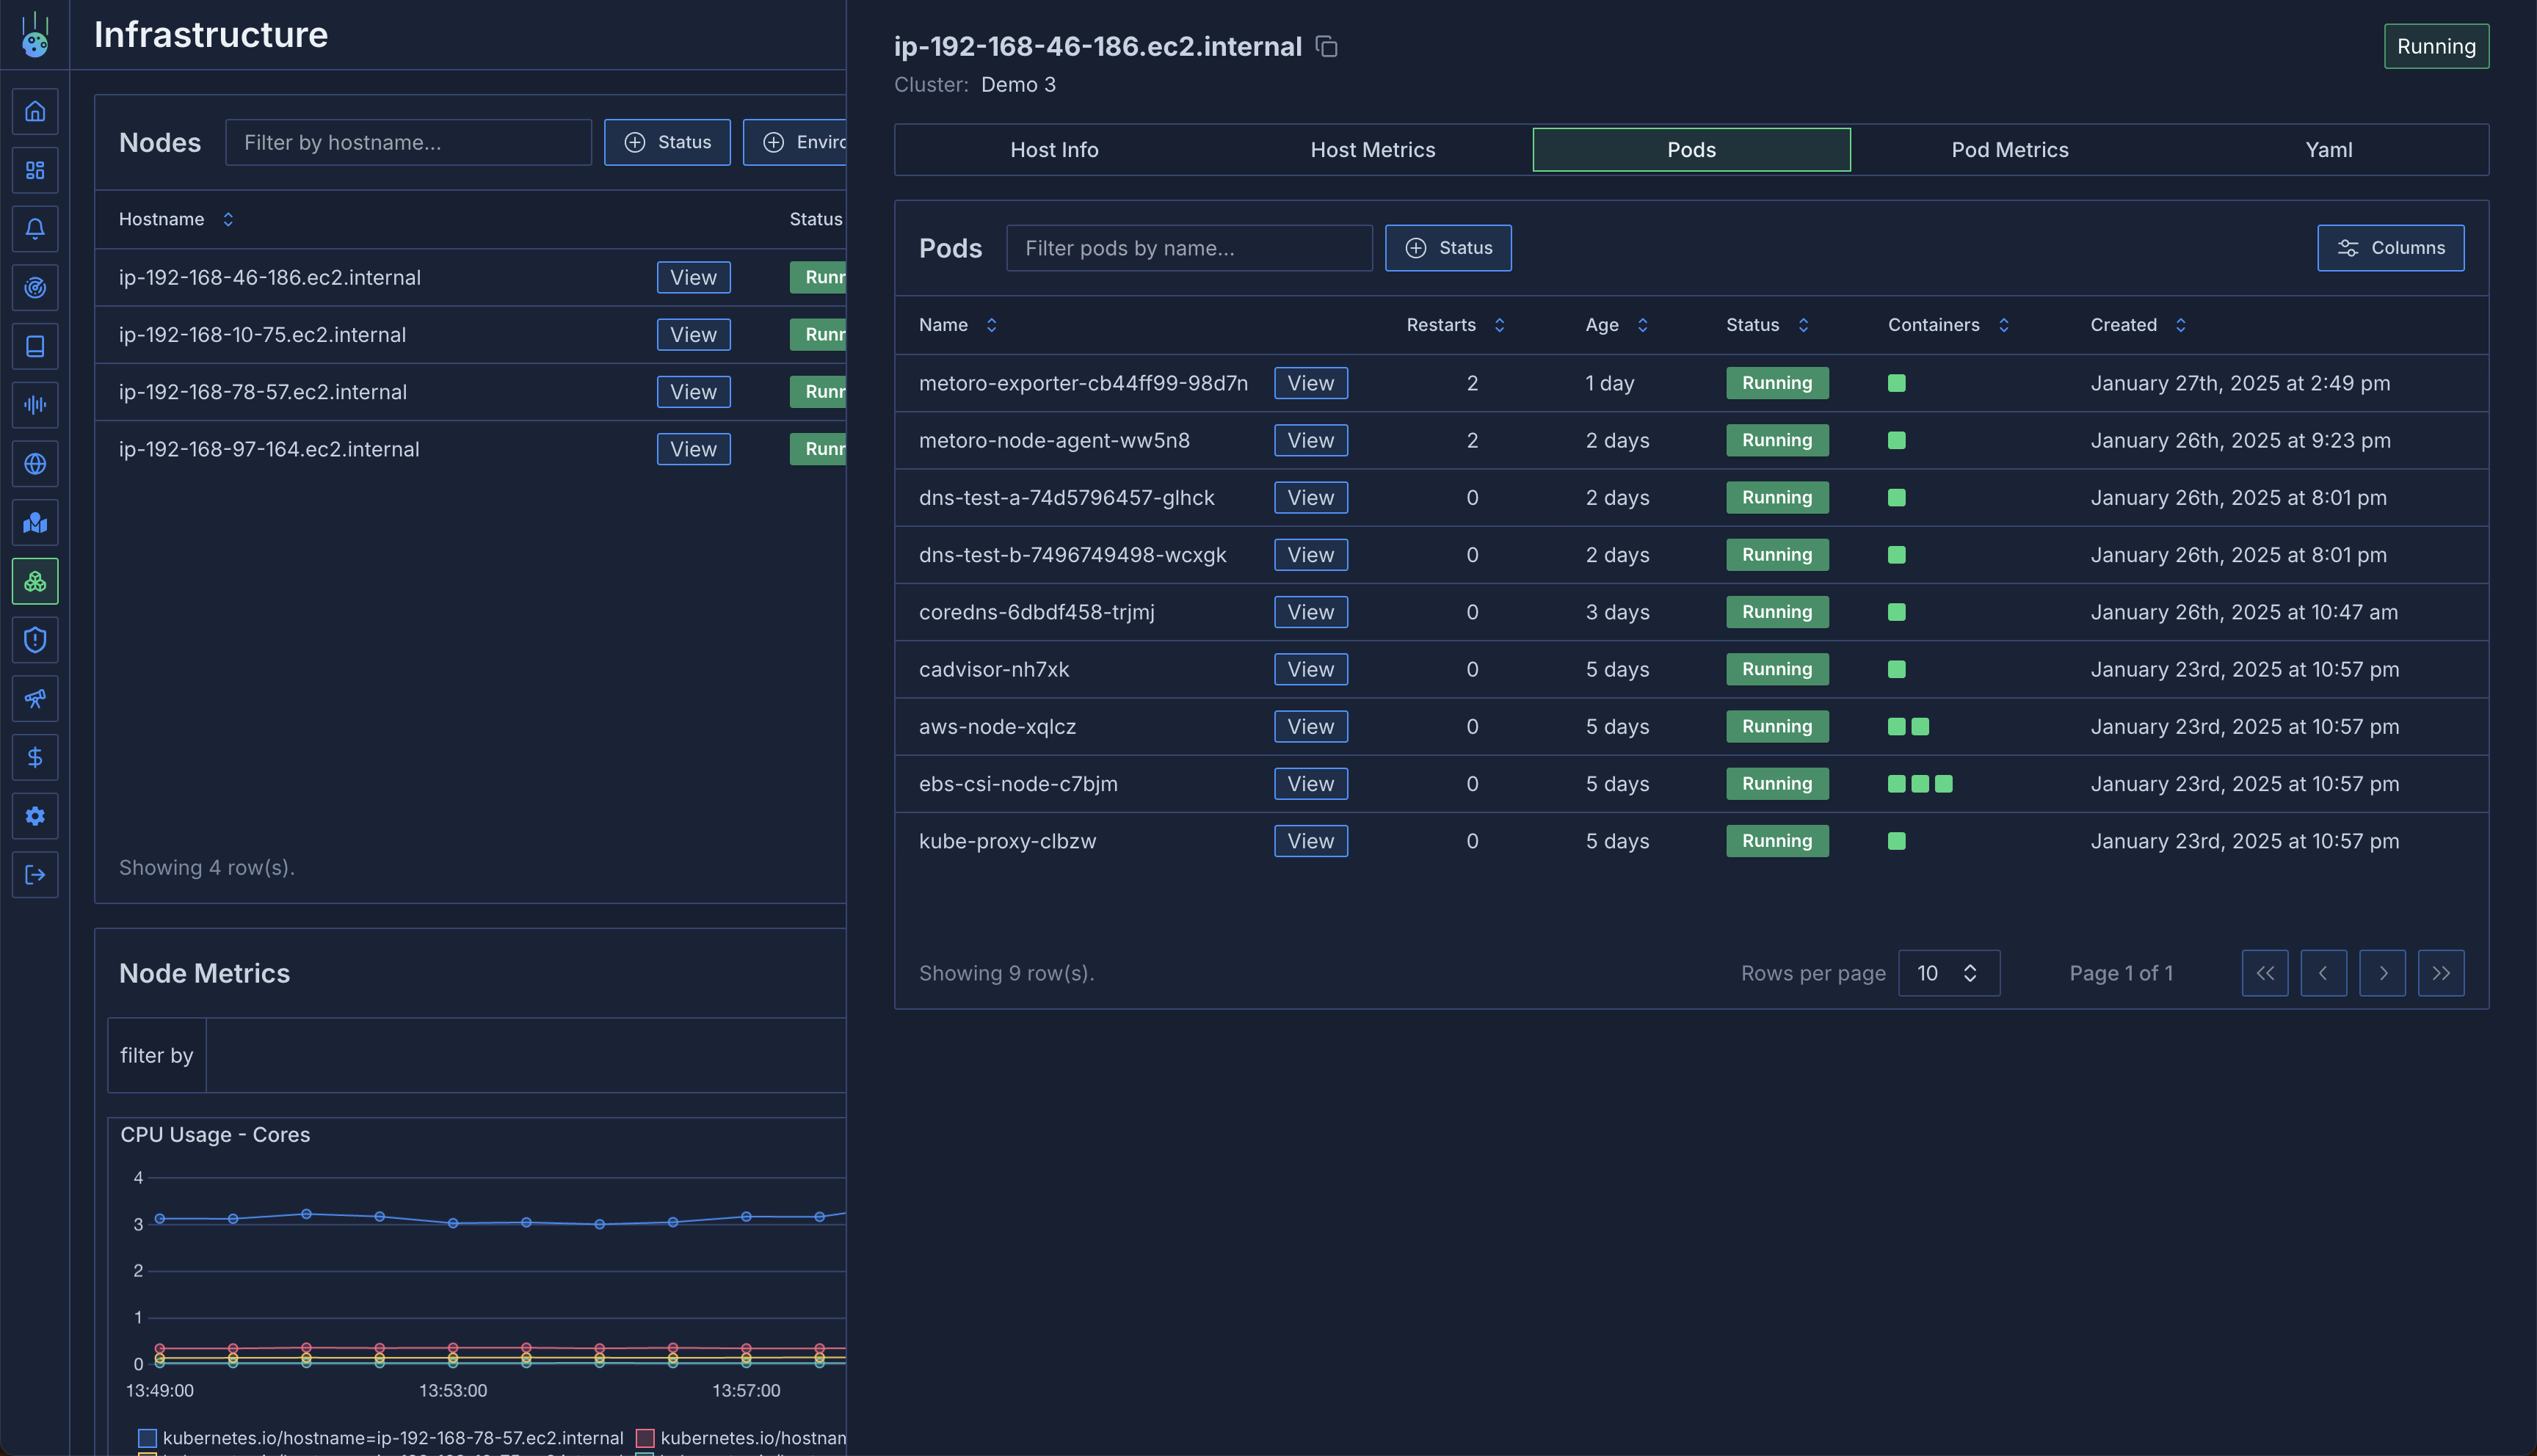
A detailed table of all pods running on the node:
* Restart frequency
* Uptime
* Pod status and conditions
* Resource usage
### Pods View
A detailed table of all pods running on the node:
* Restart frequency
* Uptime
* Pod status and conditions
* Resource usage
 ### Pod Metrics
Aggregate metrics for pods on the node:
* CPU usage per pod
* Memory consumption
* Resource distribution
* Performance analysis
This view is particularly useful for:
* Identifying resource-heavy pods
* Debugging CPU/memory issues
* Analyzing noisy neighbor situations
* Resource optimization
### Node YAML
Access the raw Kubernetes node resource YAML:
* Current node configuration
* Resource definitions
* Node labels and annotations
## Aggregated Metrics
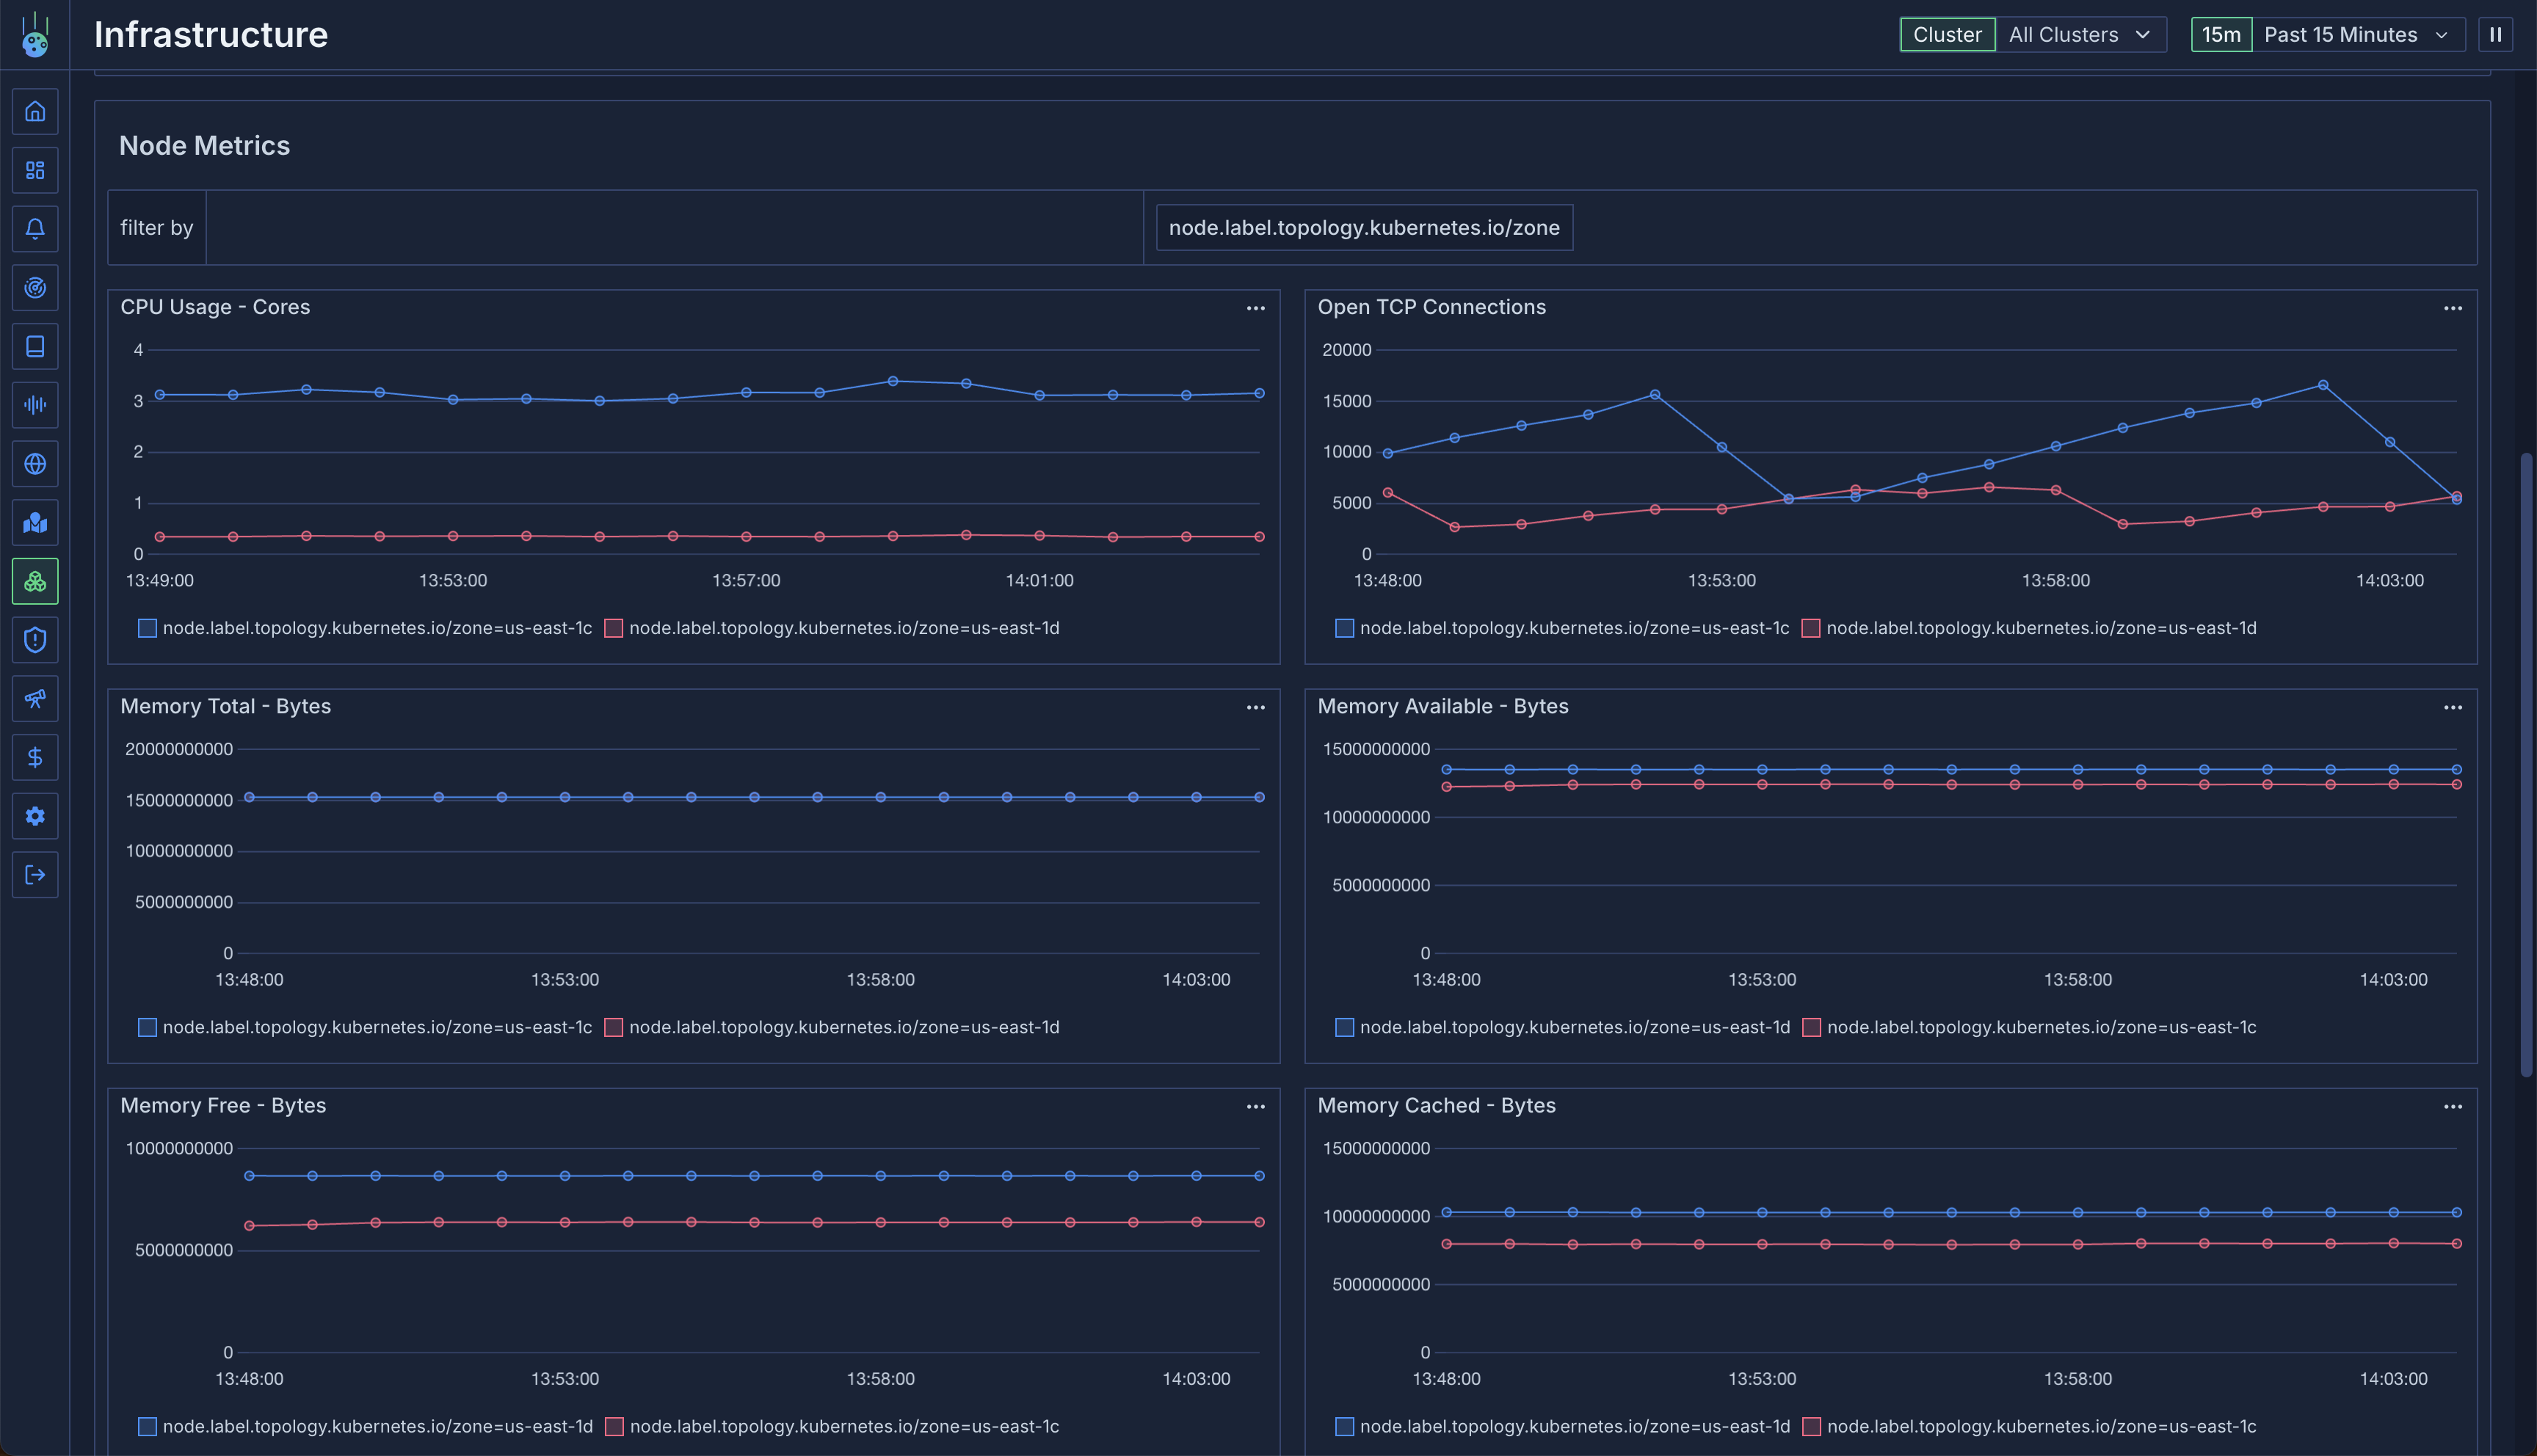
The infrastructure view provides aggregated metrics across all nodes:
### Metric Grouping
* Group by any Kubernetes label
* Filter nodes based on labels
* Analyze patterns across node groups
For example, analyze:
* CPU usage by availability zone
* Memory patterns by instance type
* Resource distribution by region
### Pod Metrics
Aggregate metrics for pods on the node:
* CPU usage per pod
* Memory consumption
* Resource distribution
* Performance analysis
This view is particularly useful for:
* Identifying resource-heavy pods
* Debugging CPU/memory issues
* Analyzing noisy neighbor situations
* Resource optimization
### Node YAML
Access the raw Kubernetes node resource YAML:
* Current node configuration
* Resource definitions
* Node labels and annotations
## Aggregated Metrics
The infrastructure view provides aggregated metrics across all nodes:
### Metric Grouping
* Group by any Kubernetes label
* Filter nodes based on labels
* Analyze patterns across node groups
For example, analyze:
* CPU usage by availability zone
* Memory patterns by instance type
* Resource distribution by region
 All node metrics are tagged with various attributes. See the [Metrics Overview](/docs/metrics/overview) for detailed
information about available tags and filtering options.
All node metrics are tagged with various attributes. See the [Metrics Overview](/docs/metrics/overview) for detailed
information about available tags and filtering options.