> ## Documentation Index
> Fetch the complete documentation index at: https://metoro.io/docs/llms.txt
> Use this file to discover all available pages before exploring further.
# Dashboard Variables
Variables allow you to dynamically apply filters to charts. The values of variables can be constant or can be edited by users when they are looking at a dashboard.
When a user edits the value of a variable in the dashboard, it will not be saved. It will only be applied to the current session.
This allows you to build generic dashboards, for example: a postgres dashboard showing performance metrics for different a particular database. Then users can select the database they're interested in.
## Variable Components
A variable is made up of these components:
* Name - The name of the variable which will be referenced when applying the filter.
* Possible Values - Suggested values for the variable. This is all the values of a particular tag for traces or metrics.
* Default Value - The default value of the variable. This is the value that will be applied when the variable is not edited by the user.
If the value is `*` then it is for all values of the key.
* Overridable - Whether a user can edit the value of the variable inside the dashboard for their session.
An example variable definition is below:
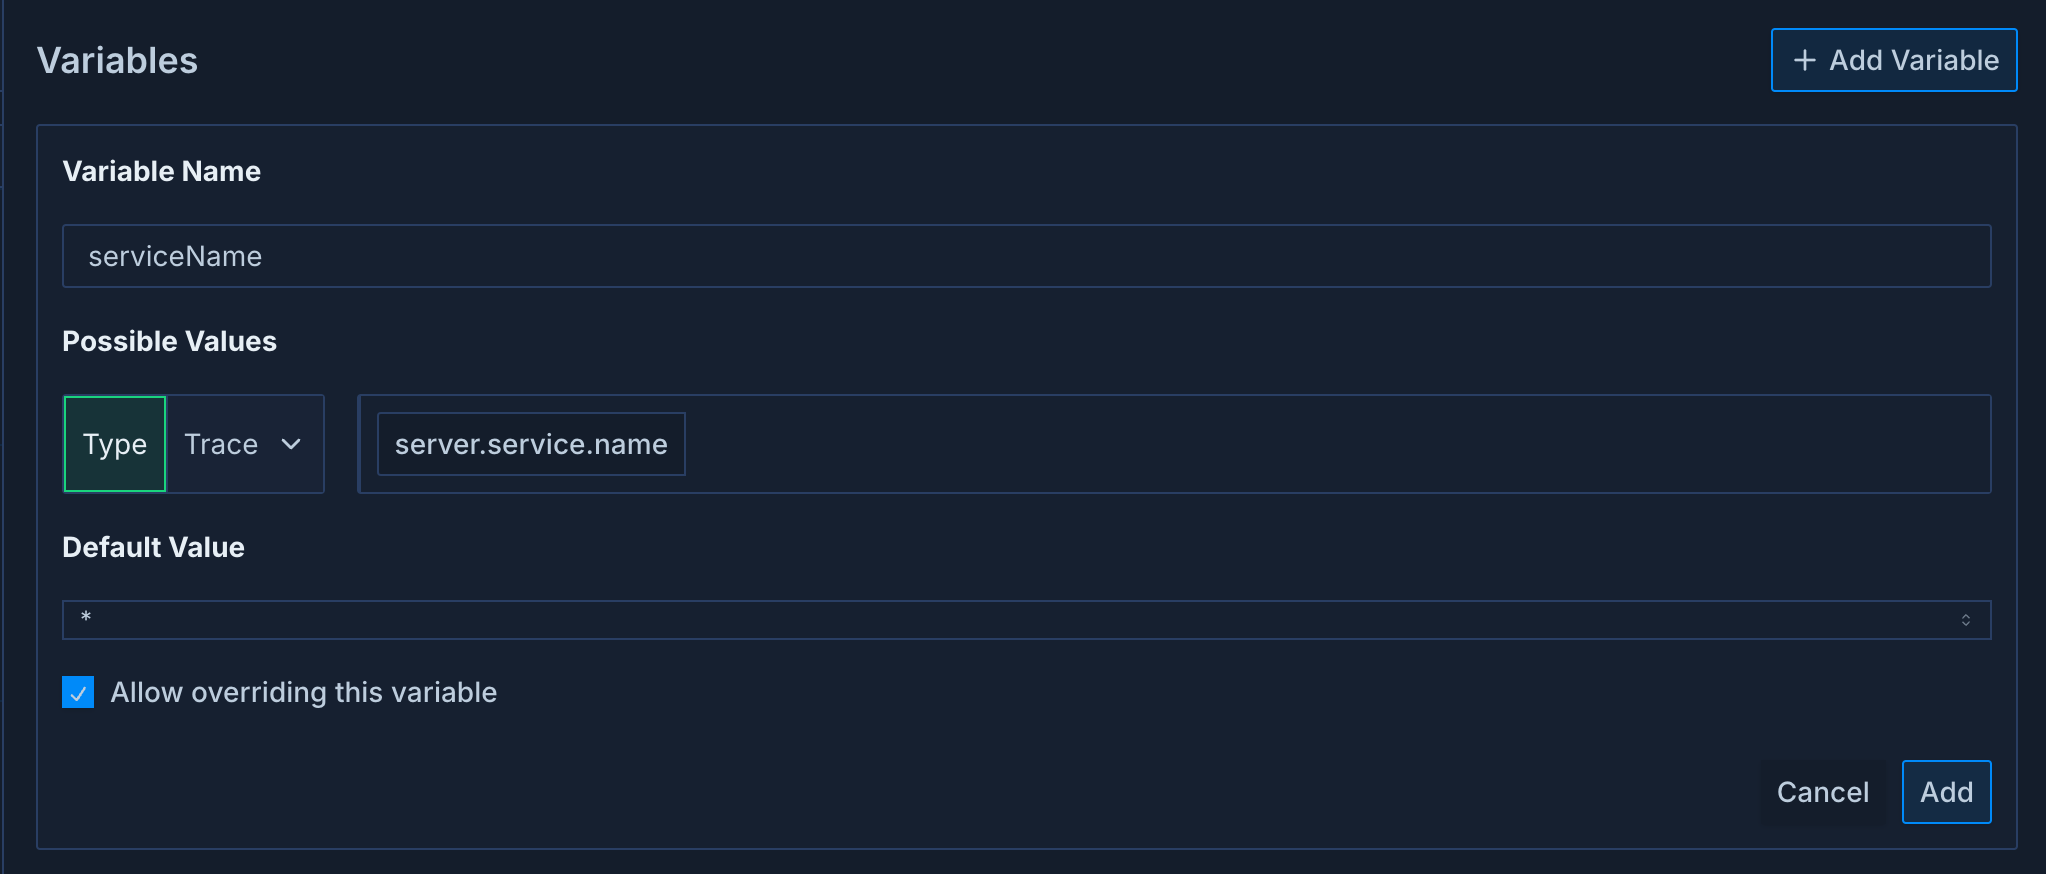 This variable has a name of `serviceName` and a default value of `*` which means all service names. The possible values are the unique values of the serviceName tag for traces.
## Creating Variables
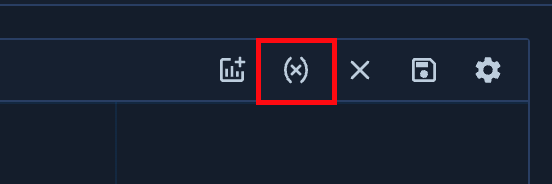
You can create a variable by clicking the variable icon on any group widget in edit mode.
This variable has a name of `serviceName` and a default value of `*` which means all service names. The possible values are the unique values of the serviceName tag for traces.
## Creating Variables
You can create a variable by clicking the variable icon on any group widget in edit mode.
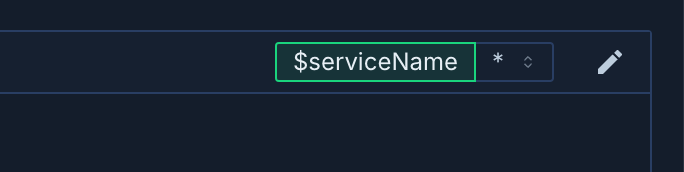
 After a variable is created, you will see it in the header of the group widget.
 ## Using Variables
After you have created a variable you can use it in the filters of any chart that is nested below that group.
In the chart editor you can set any filter equal to the variable value.
## Using Variables
After you have created a variable you can use it in the filters of any chart that is nested below that group.
In the chart editor you can set any filter equal to the variable value.
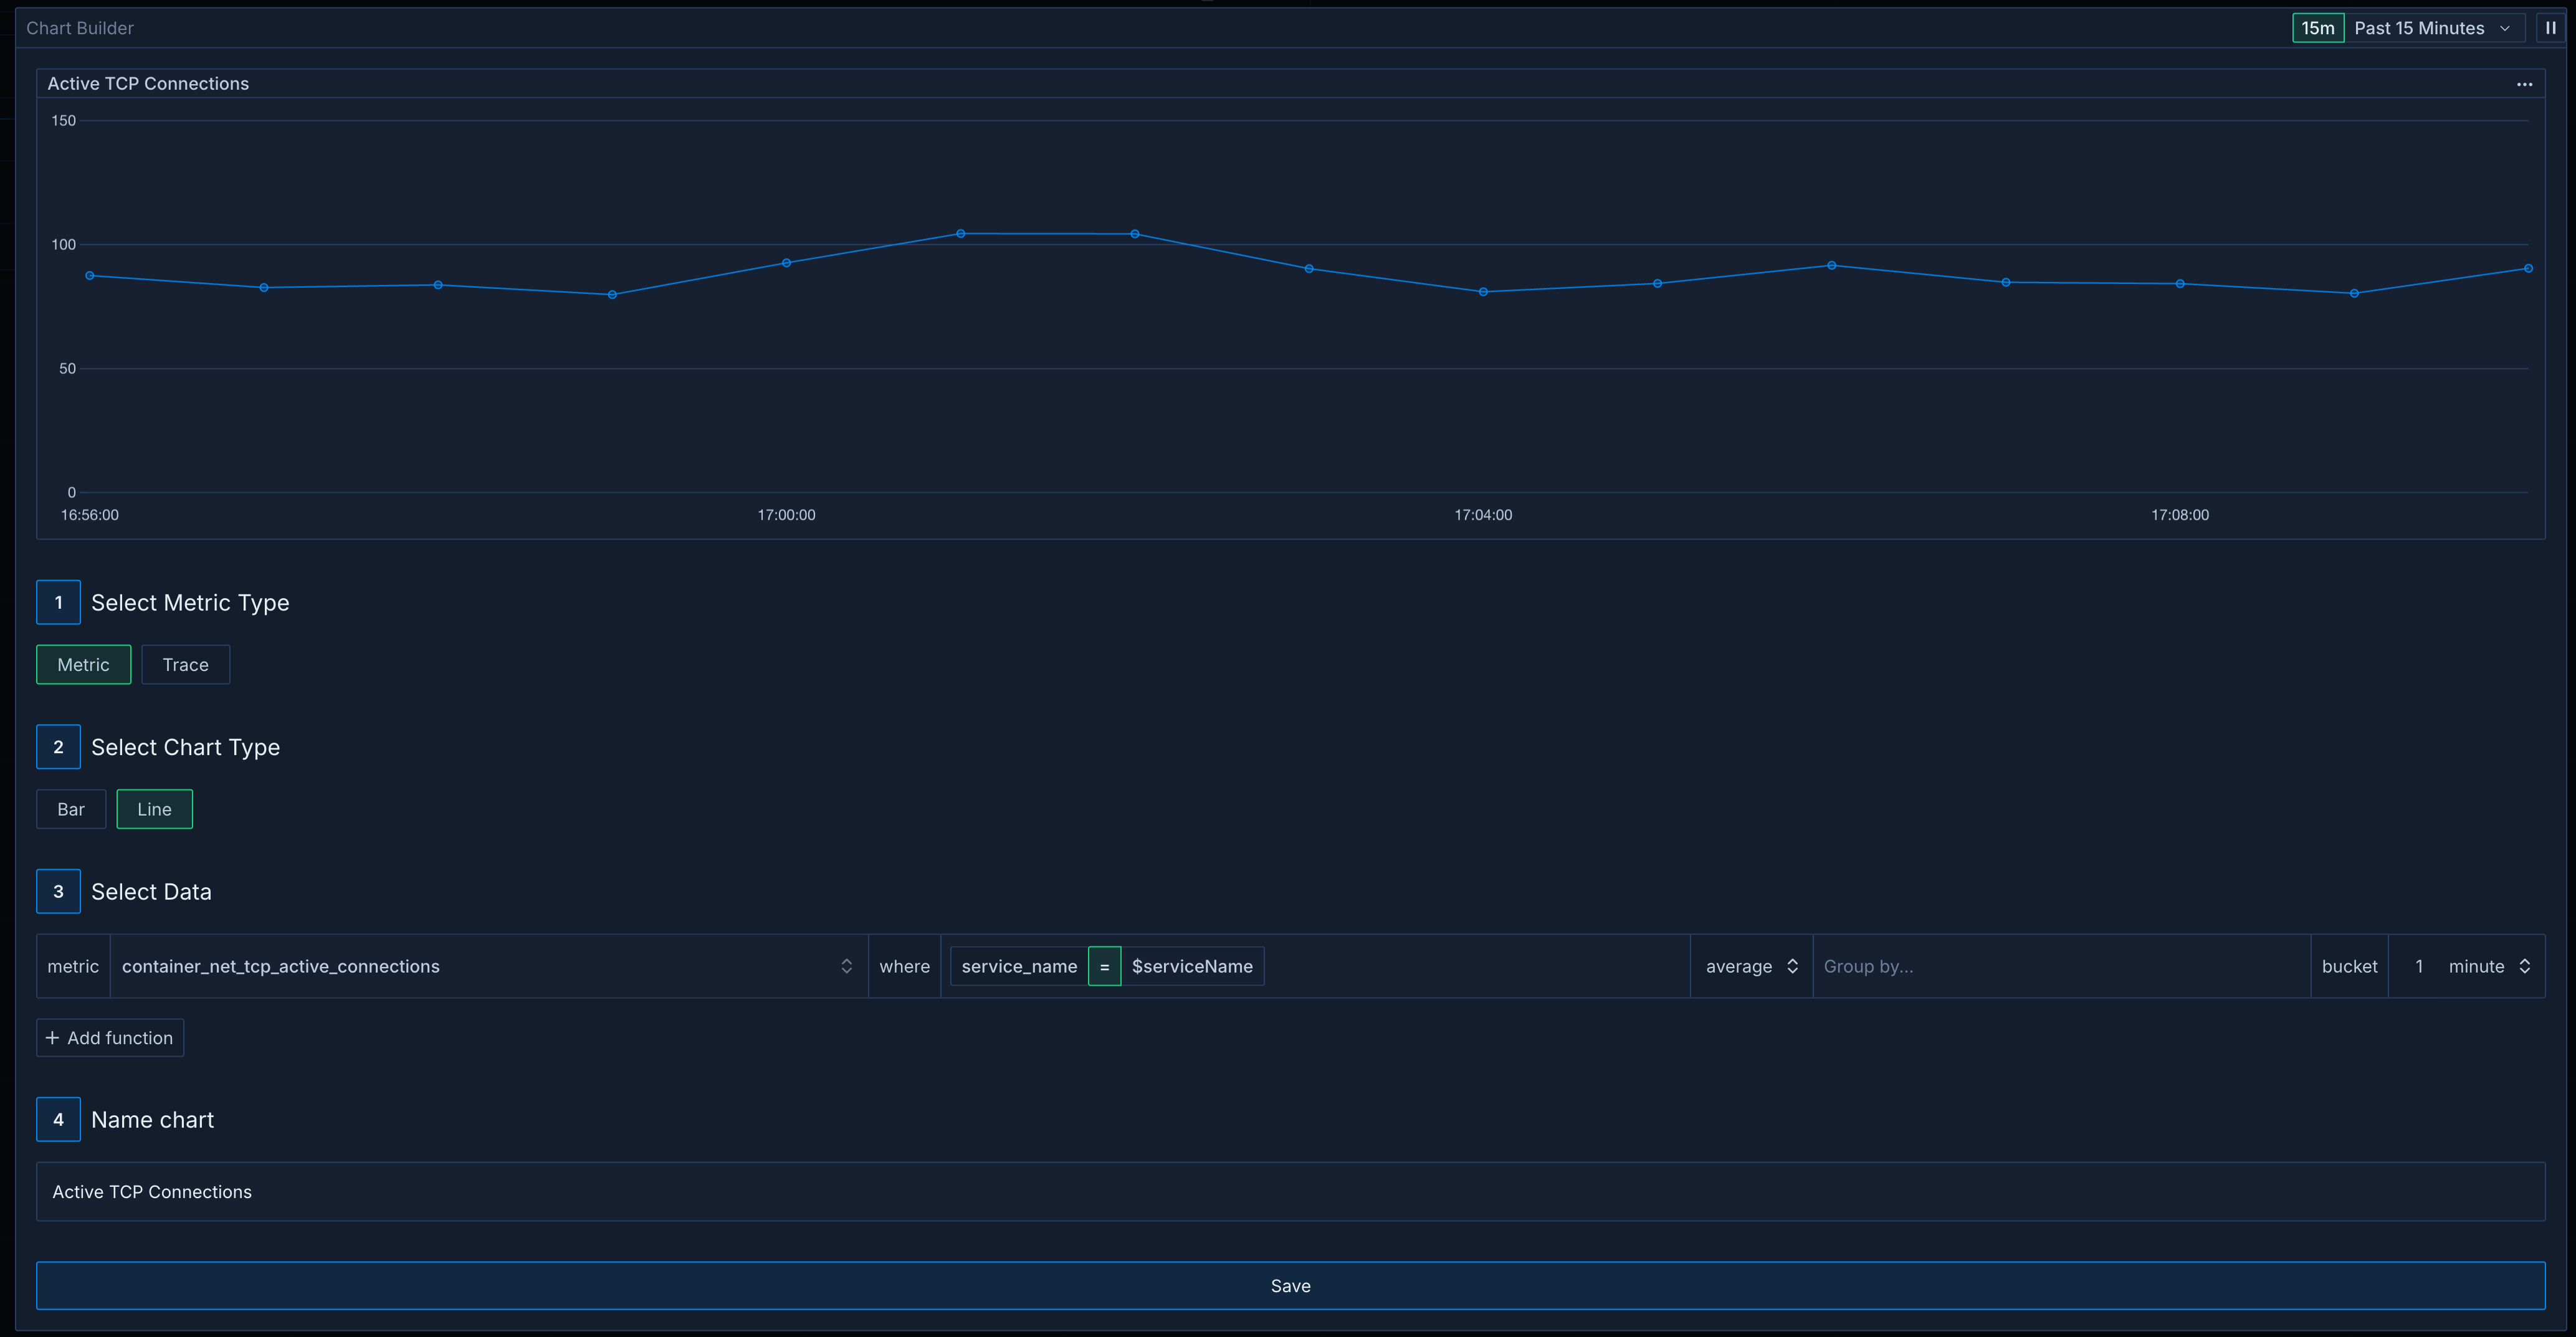 After using a variable in the chart. Change the value of the variable by clicking the variable in the widget and selecting (or typing) the new value.