> ## Documentation Index
> Fetch the complete documentation index at: https://metoro.io/docs/llms.txt
> Use this file to discover all available pages before exploring further.
# Manage Dashboards with Kubernetes
> Define Metoro dashboards as code and sync them from Kubernetes ConfigMaps or MetoroDashboard CRDs.
Metoro can continuously synchronize dashboard definitions from Kubernetes ConfigMaps or `MetoroDashboard` custom resources. This approach lets you treat dashboards as code while still allowing teams to create and manage additional dashboards in the Metoro UI.
Kubernetes-managed dashboards are read-only in the UI. Changes must be applied through Kubernetes manifests.
## How synchronization works
* Metoro checks for ConfigMaps with the `metoro.io/dashboard: "true"` label and `MetoroDashboard` resources on all environments and namespaces once an hour and updates the dashboards with any changes it finds.
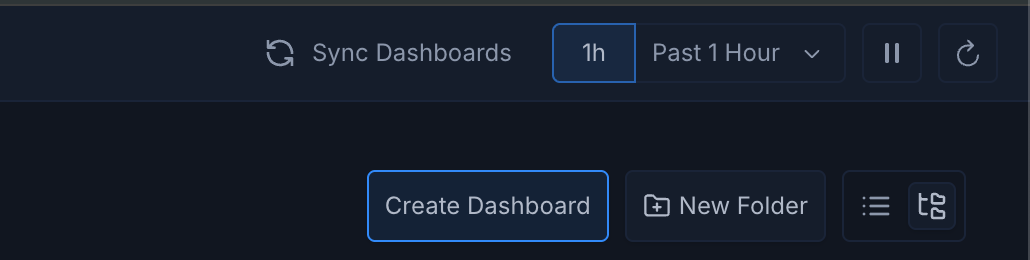
* You can trigger an on-demand refresh by clicking **Sync Dashboards** in the UI whenever you do not want to wait for the automatic run.
* Kubernetes-managed dashboards display their source resource and the time of the last sync so you can confirm that changes were applied.
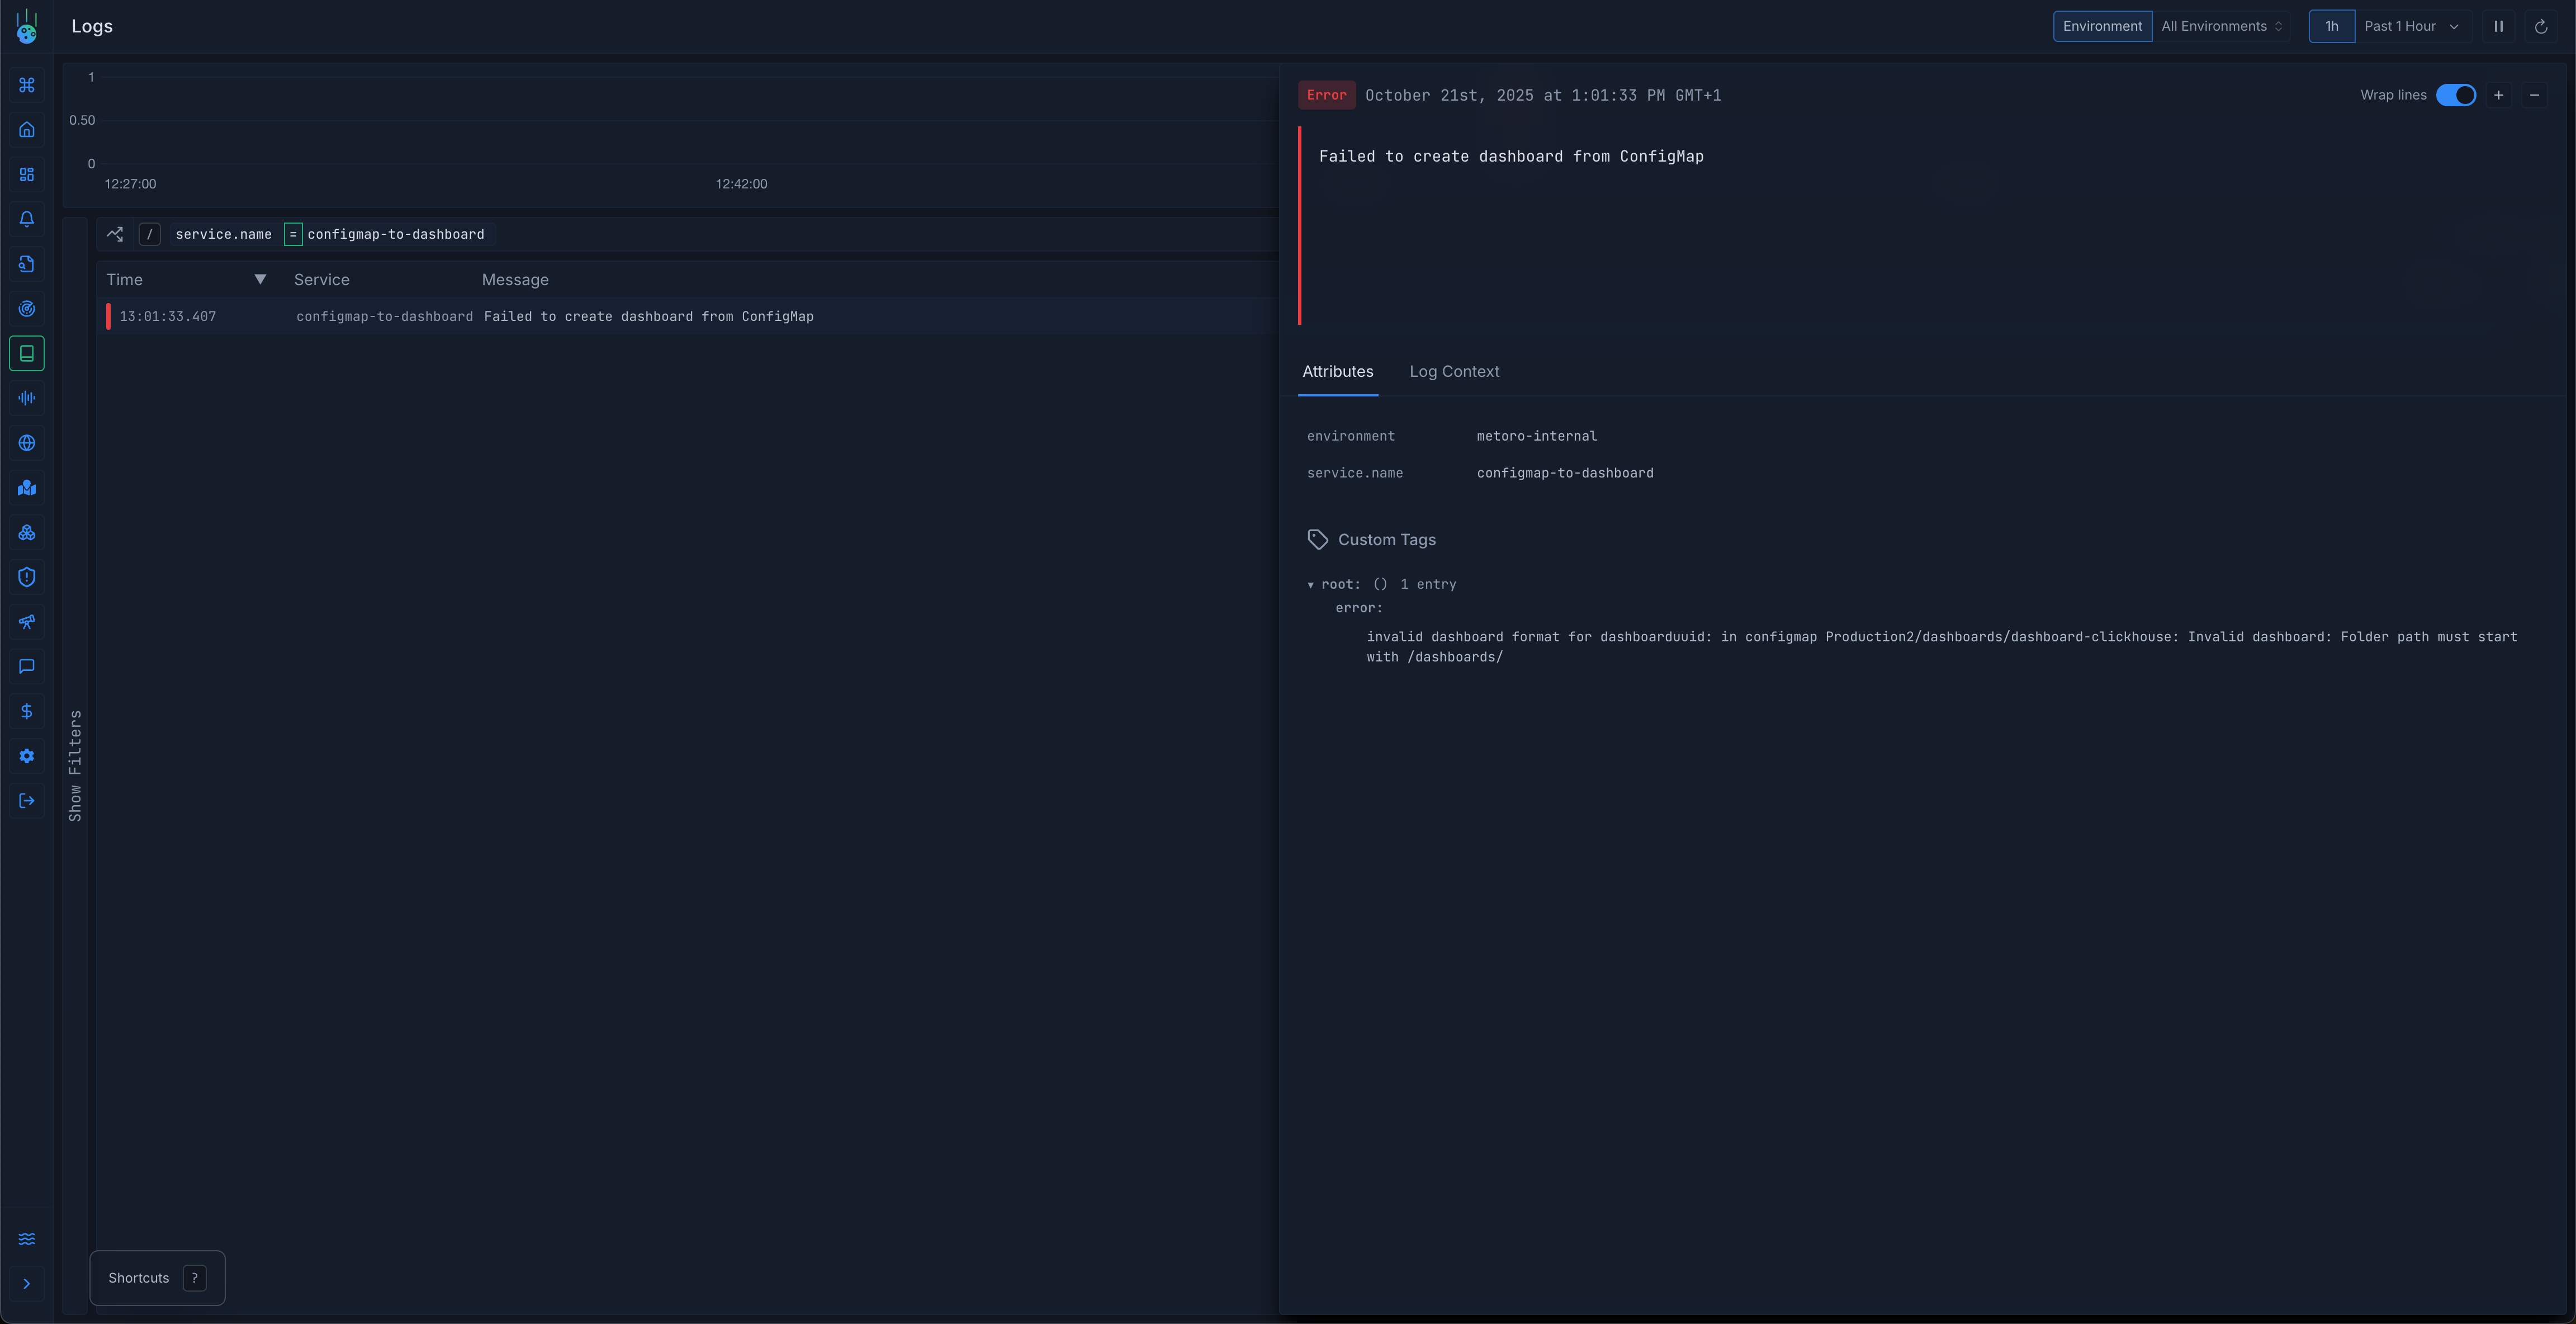
* If a sync cannot read a Kubernetes source or the dashboard definition is invalid, Metoro writes an error to your cluster logs.
Allow at least one minute after applying or updating a ConfigMap before triggering a manual sync so that Metoro can discover the new resource.
`id`'s provided in the dashboard definition will be prefixed with your organization UUID. For example, if you define a dashboard with `id: my-dashboard` in a ConfigMap, and your organization UUID is `org-1234`, the resulting dashboard ID in Metoro will be `org-1234-my-dashboard`.
## ConfigMap requirements
Metoro looks for specific labels and data keys to determine whether a ConfigMap should be treated as a dashboard source. Make sure each ConfigMap satisfies the following:
1. Include the label `metoro.io/dashboard: "true"`. ConfigMaps without this label are ignored.
2. Provide the dashboard definition inside `data.dashboard.yaml`. Each ConfigMap can contain one or more dashboards under this key.
3. Conform to the public dashboard schema (metadata, content tree, and optional settings) described in the OpenAPI specification: [Dashboard schema](https://metoro.io/docs/api-reference/dashboards/createupdate-dashboard#body-dashboard)
4. Use valid resource identifiers and folder paths. IDs must be filesystem-safe, and folder paths have to live under `/dashboards/`.
5. `id` values must be unique across all ConfigMap-managed and UI-managed dashboards. Conflicts cause sync errors.
## MetoroDashboard CRD requirements
Use a `MetoroDashboard` custom resource when you want Kubernetes API validation and one Kubernetes object per dashboard:
1. Use `apiVersion: observability.metoro.io/v1alpha1` and `kind: MetoroDashboard`.
2. Provide a `spec.content` root group. `spec.title` is optional and defaults to `metadata.name`.
3. Do not set a dashboard ID or folder path. Metoro derives the ID as `kubernetes-managed...` and places the dashboard under `/dashboards/kubernetes-managed///`.
4. The root group can contain group widgets, but group widgets cannot contain other group widgets.
You don't have to write these manifests by hand: any existing dashboard can be exported as a ready-to-apply manifest from the dashboard's settings via Export → "YAML (MetoroDashboard CRD)". Exported manifests omit `metadata.namespace`, so the resource lands in whichever namespace you apply it to, and the dashboard ID and folder are derived when Metoro syncs the resource.
### Example MetoroDashboard
```yaml theme={null}
apiVersion: observability.metoro.io/v1alpha1
kind: MetoroDashboard
metadata:
name: payments-overview
namespace: payments
spec:
title: Payments Overview
settings:
defaultTimeRange: "1h"
hideGlobalEnvironmentSelector: false
layoutVersion: 2
content:
title: Payments Overview
widgets:
- type: markdown
position:
type: absolute
absolute:
x: 0
y: 0
w: 8
h: 2
markdown:
content: |
### Payments dashboard
This dashboard is managed from a MetoroDashboard custom resource.
```
### Example ConfigMap with a single dashboard
This example ConfigMap defines a simple stat table dashboard showing CPU usage per environment. More example dashboards can be found in the [metoro-examples GitHub repository](https://github.com/metoro-io/metoro_examples/tree/main/dashboards/configmaps).
```yaml theme={null}
apiVersion: v1
kind: ConfigMap
metadata:
name: dashboard-stat
labels:
metoro.io/dashboard: "true"
data:
dashboard.yaml: |
content:
title: Stat Table
widgets:
- position:
absolute:
h: 2
w: 7
x: 0
y: 0
type: absolute
stat:
displaySettings:
columnSettings:
- column: attributes.environment
hiddenByDefault: false
regexExtractor: '(.*) '
title: Environment
- column: attributes.job
hiddenByDefault: true
- column: value
title: value
globalSettings:
filterableColumn: attributes.environment
fontSize: auto
valuePrecision: 2
valueSettings:
- colorSettings:
color: '#d92e48'
type: text
formatSpecifier: $value cores used
matchingOperators:
- operator: greaterThan
threshold: 5
- colorSettings:
color: '#2DD881'
type: text
formatSpecifier: $value cores used
matchingOperators:
- operator: lessThan
threshold: 5
expression:
metoroQLQuery:
bucketSize: 60
query: sum(rate(node_resources_cpu_usage_seconds_total)) by (environment,job)
reduceAggregation: max
title: Cores per environment
type: stat
metadata:
id: configmap-dashboards-stat-test1
title: Stat Table
folderPath: /dashboards/configmap-examples/
```
You can define multiple dashboards in a single ConfigMap by listing them under `dashboards:`. Each entry is validated on its own, so one invalid dashboard does not prevent the others from syncing.
However, as the dashboard definitions grow larger, consider splitting them into separate ConfigMaps for easier management.
## Deploying Kubernetes dashboards
1. Apply the ConfigMap or `MetoroDashboard` resource to any namespace within the Kubernetes cluster where Metoro runs.
2. Wait at least a minute for the resource inventory to ingest the new data (or the ingestion window described above to elapse).
3. Either wait for the next scheduled hourly sync or click **Sync Dashboards** in the Metoro UI to trigger reconciliation immediately.
4. After the workflow completes, reload the Dashboards page to see the imported definitions. Kubernetes-managed dashboards display a badge with the managing resource and show a toast explaining that edits must happen in Kubernetes.
 ## Converting existing dashboards
You can convert any UI-managed dashboard into a Kubernetes-managed one by exporting it as YAML and applying the file as a ConfigMap:
1. Open the dashboard in Metoro and choose **Edit**.
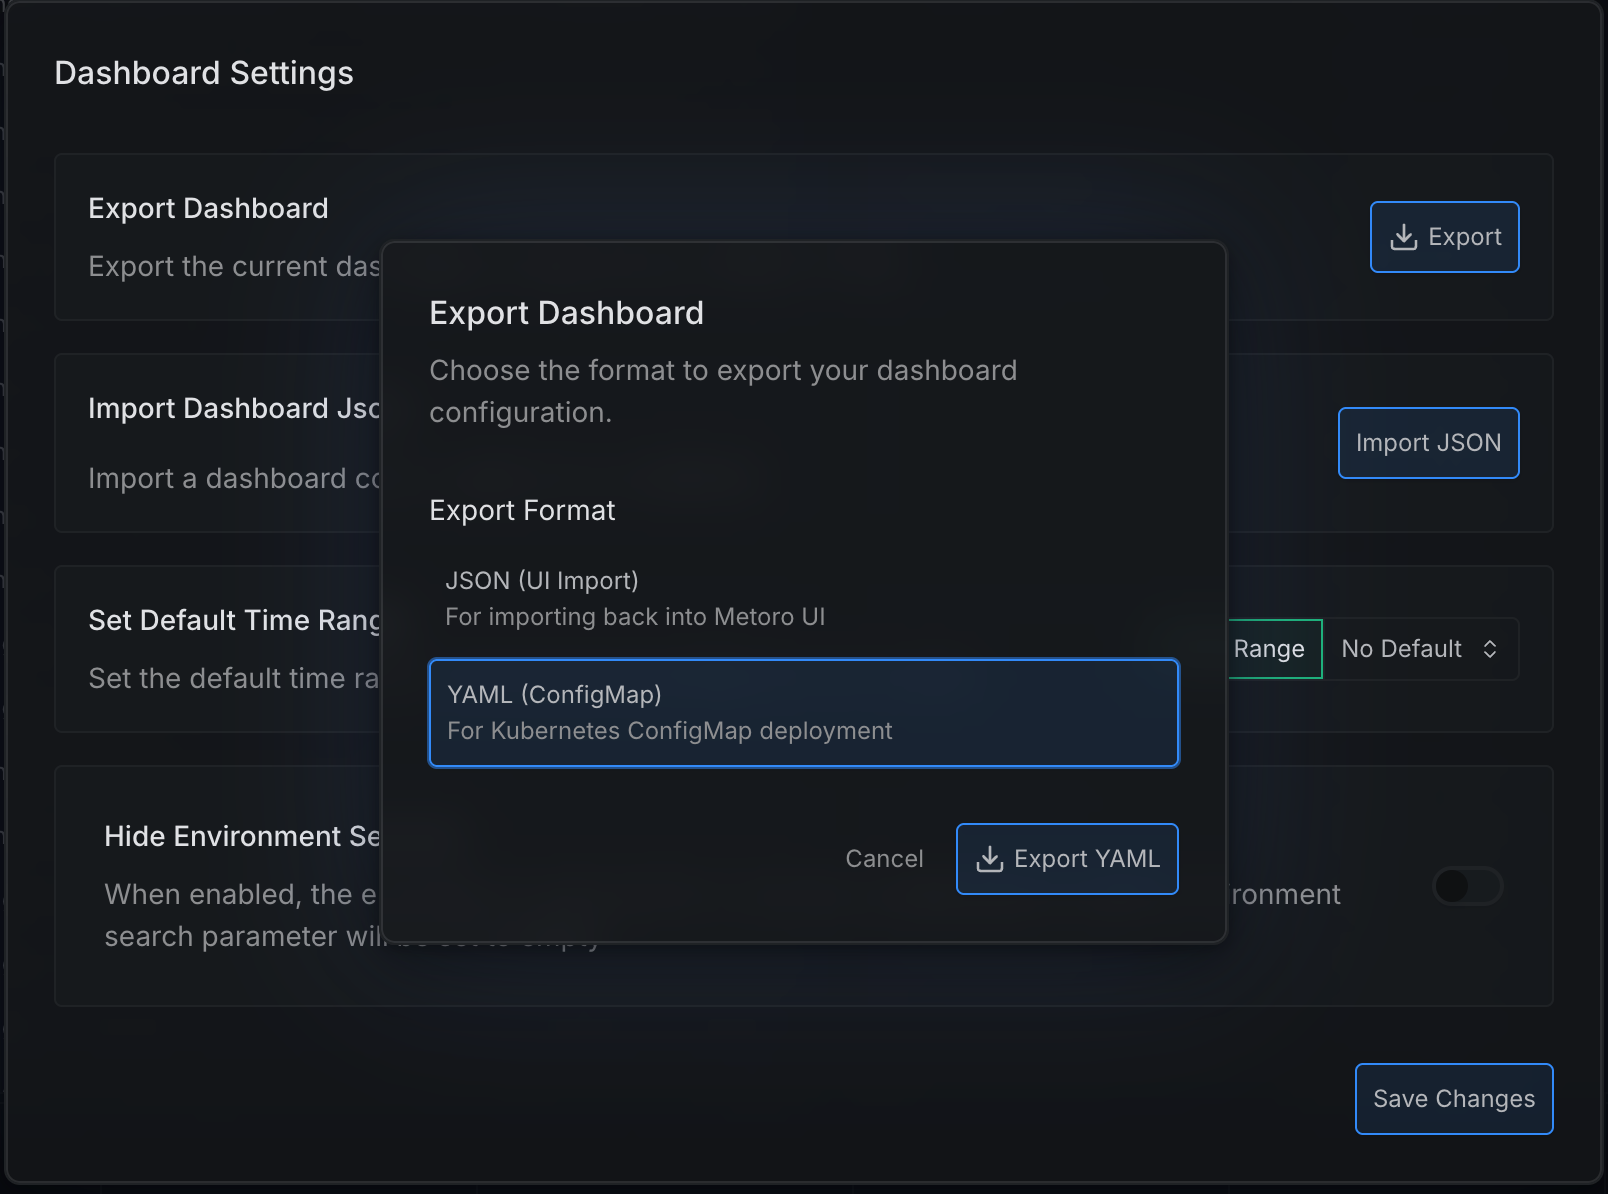
2. Click the **Settings** (gear) icon and select **Export**.
3. Choose **YAML (ConfigMap)**, which downloads a YAML file containing the dashboard definition that matches the ConfigMap schema.
4. Wrap the exported YAML in a Kubernetes ConfigMap (adding the label and folder path adjustments you need) and deploy it to your cluster.
5. Trigger a sync or wait for the hourly workflow. The resulting dashboard becomes read-only in the UI, and future edits should flow through the ConfigMap.
Currently, `folderPath` is not exported. You must manually add it to the ConfigMap under `metadata` to place the dashboard in a specific folder. If omitted, the dashboard will be placed in the default folder.
## Converting existing dashboards
You can convert any UI-managed dashboard into a Kubernetes-managed one by exporting it as YAML and applying the file as a ConfigMap:
1. Open the dashboard in Metoro and choose **Edit**.
2. Click the **Settings** (gear) icon and select **Export**.
3. Choose **YAML (ConfigMap)**, which downloads a YAML file containing the dashboard definition that matches the ConfigMap schema.
4. Wrap the exported YAML in a Kubernetes ConfigMap (adding the label and folder path adjustments you need) and deploy it to your cluster.
5. Trigger a sync or wait for the hourly workflow. The resulting dashboard becomes read-only in the UI, and future edits should flow through the ConfigMap.
Currently, `folderPath` is not exported. You must manually add it to the ConfigMap under `metadata` to place the dashboard in a specific folder. If omitted, the dashboard will be placed in the default folder.

 ## Deleting Kubernetes-managed dashboards
To delete a ConfigMap-managed dashboard, delete the corresponding ConfigMap from your Kubernetes cluster and then delete the dashboard from the Metoro UI.
To delete a `MetoroDashboard`-managed dashboard, delete the `MetoroDashboard` resource. The dashboard will be removed during the next sync when Metoro sees the Kubernetes delete event.
If you delete only the dashboard from the Metoro UI without deleting the Kubernetes source, the dashboard will be recreated during the next sync.
## Troubleshooting
If your Kubernetes-managed dashboards do not appear or behave as expected, you can check from your [cluster logs for sync errors](https://us-east.metoro.io/logs?last=1h\&environment=\&startEnd=\&service=\&excludeFilter=%7B%7D\&filter=%7B%22service.name%22%3A%5B%22configmap-to-dashboard%22%5D%7D)
Make sure to filter the logs by `service.name: configmap-to-dashboard` to see only relevant entries.
## Deleting Kubernetes-managed dashboards
To delete a ConfigMap-managed dashboard, delete the corresponding ConfigMap from your Kubernetes cluster and then delete the dashboard from the Metoro UI.
To delete a `MetoroDashboard`-managed dashboard, delete the `MetoroDashboard` resource. The dashboard will be removed during the next sync when Metoro sees the Kubernetes delete event.
If you delete only the dashboard from the Metoro UI without deleting the Kubernetes source, the dashboard will be recreated during the next sync.
## Troubleshooting
If your Kubernetes-managed dashboards do not appear or behave as expected, you can check from your [cluster logs for sync errors](https://us-east.metoro.io/logs?last=1h\&environment=\&startEnd=\&service=\&excludeFilter=%7B%7D\&filter=%7B%22service.name%22%3A%5B%22configmap-to-dashboard%22%5D%7D)
Make sure to filter the logs by `service.name: configmap-to-dashboard` to see only relevant entries.
 Some common issues include:
* **Dashboard does not appear**: For ConfigMaps, confirm the label and the `dashboard.yaml` key. For CRDs, confirm the `MetoroDashboard` resource exists in the cluster. Invalid or missing values are skipped during the next sync.
* **Validation errors**: Review the sync error in your cluster logs, fix the YAML, and run a new sync. ConfigMap dashboard IDs and folder paths must match the OpenAPI schema. `MetoroDashboard` resources derive the ID and folder path from the Kubernetes object.
* **UI edits rejected**: Kubernetes-managed dashboards intentionally disable the **Save** action. Update the Kubernetes resource instead, then sync again to propagate the change.
**We are here to help!**
Some common issues include:
* **Dashboard does not appear**: For ConfigMaps, confirm the label and the `dashboard.yaml` key. For CRDs, confirm the `MetoroDashboard` resource exists in the cluster. Invalid or missing values are skipped during the next sync.
* **Validation errors**: Review the sync error in your cluster logs, fix the YAML, and run a new sync. ConfigMap dashboard IDs and folder paths must match the OpenAPI schema. `MetoroDashboard` resources derive the ID and folder path from the Kubernetes object.
* **UI edits rejected**: Kubernetes-managed dashboards intentionally disable the **Save** action. Update the Kubernetes resource instead, then sync again to propagate the change.
**We are here to help!**
If you continue to experience issues, please reach out to Metoro support for assistance.
## Related Links
1. [Create/Update Dashboard OpenAPI schema](https://metoro.io/docs/api-reference/dashboards/createupdate-dashboard)
2. [Dashboard OpenAPI schema](https://metoro.io/docs/api-reference/dashboards/createupdate-dashboard#body-dashboard)
3. [metoro-examples GitHub repository](https://github.com/metoro-io/metoro_examples/tree/main/dashboards/configmaps).