> ## Documentation Index
> Fetch the complete documentation index at: https://metoro.io/docs/llms.txt
> Use this file to discover all available pages before exploring further.
# Autonomous Issue Detection & RCA
> Automatically detect abnormal behavior and investigate the root cause with AI to find if it's a real issue or noise
## Overview
Metoro's autonomous issue detection workflow automatically identifies unusual patterns in your systems without requiring you to configure explicit alert thresholds first. When an anomaly is detected, Metoro investigates whether the behavior is expected noise or a real production issue and, if it is real, continues to the likely root cause.
You can see all Anomaly Detection investigation from **Guardian** -> **Agents** -> **Anomalies** in Metoro.
[Take me there](https://us-east.metoro.io/guardian/output/anomaly-investigation)
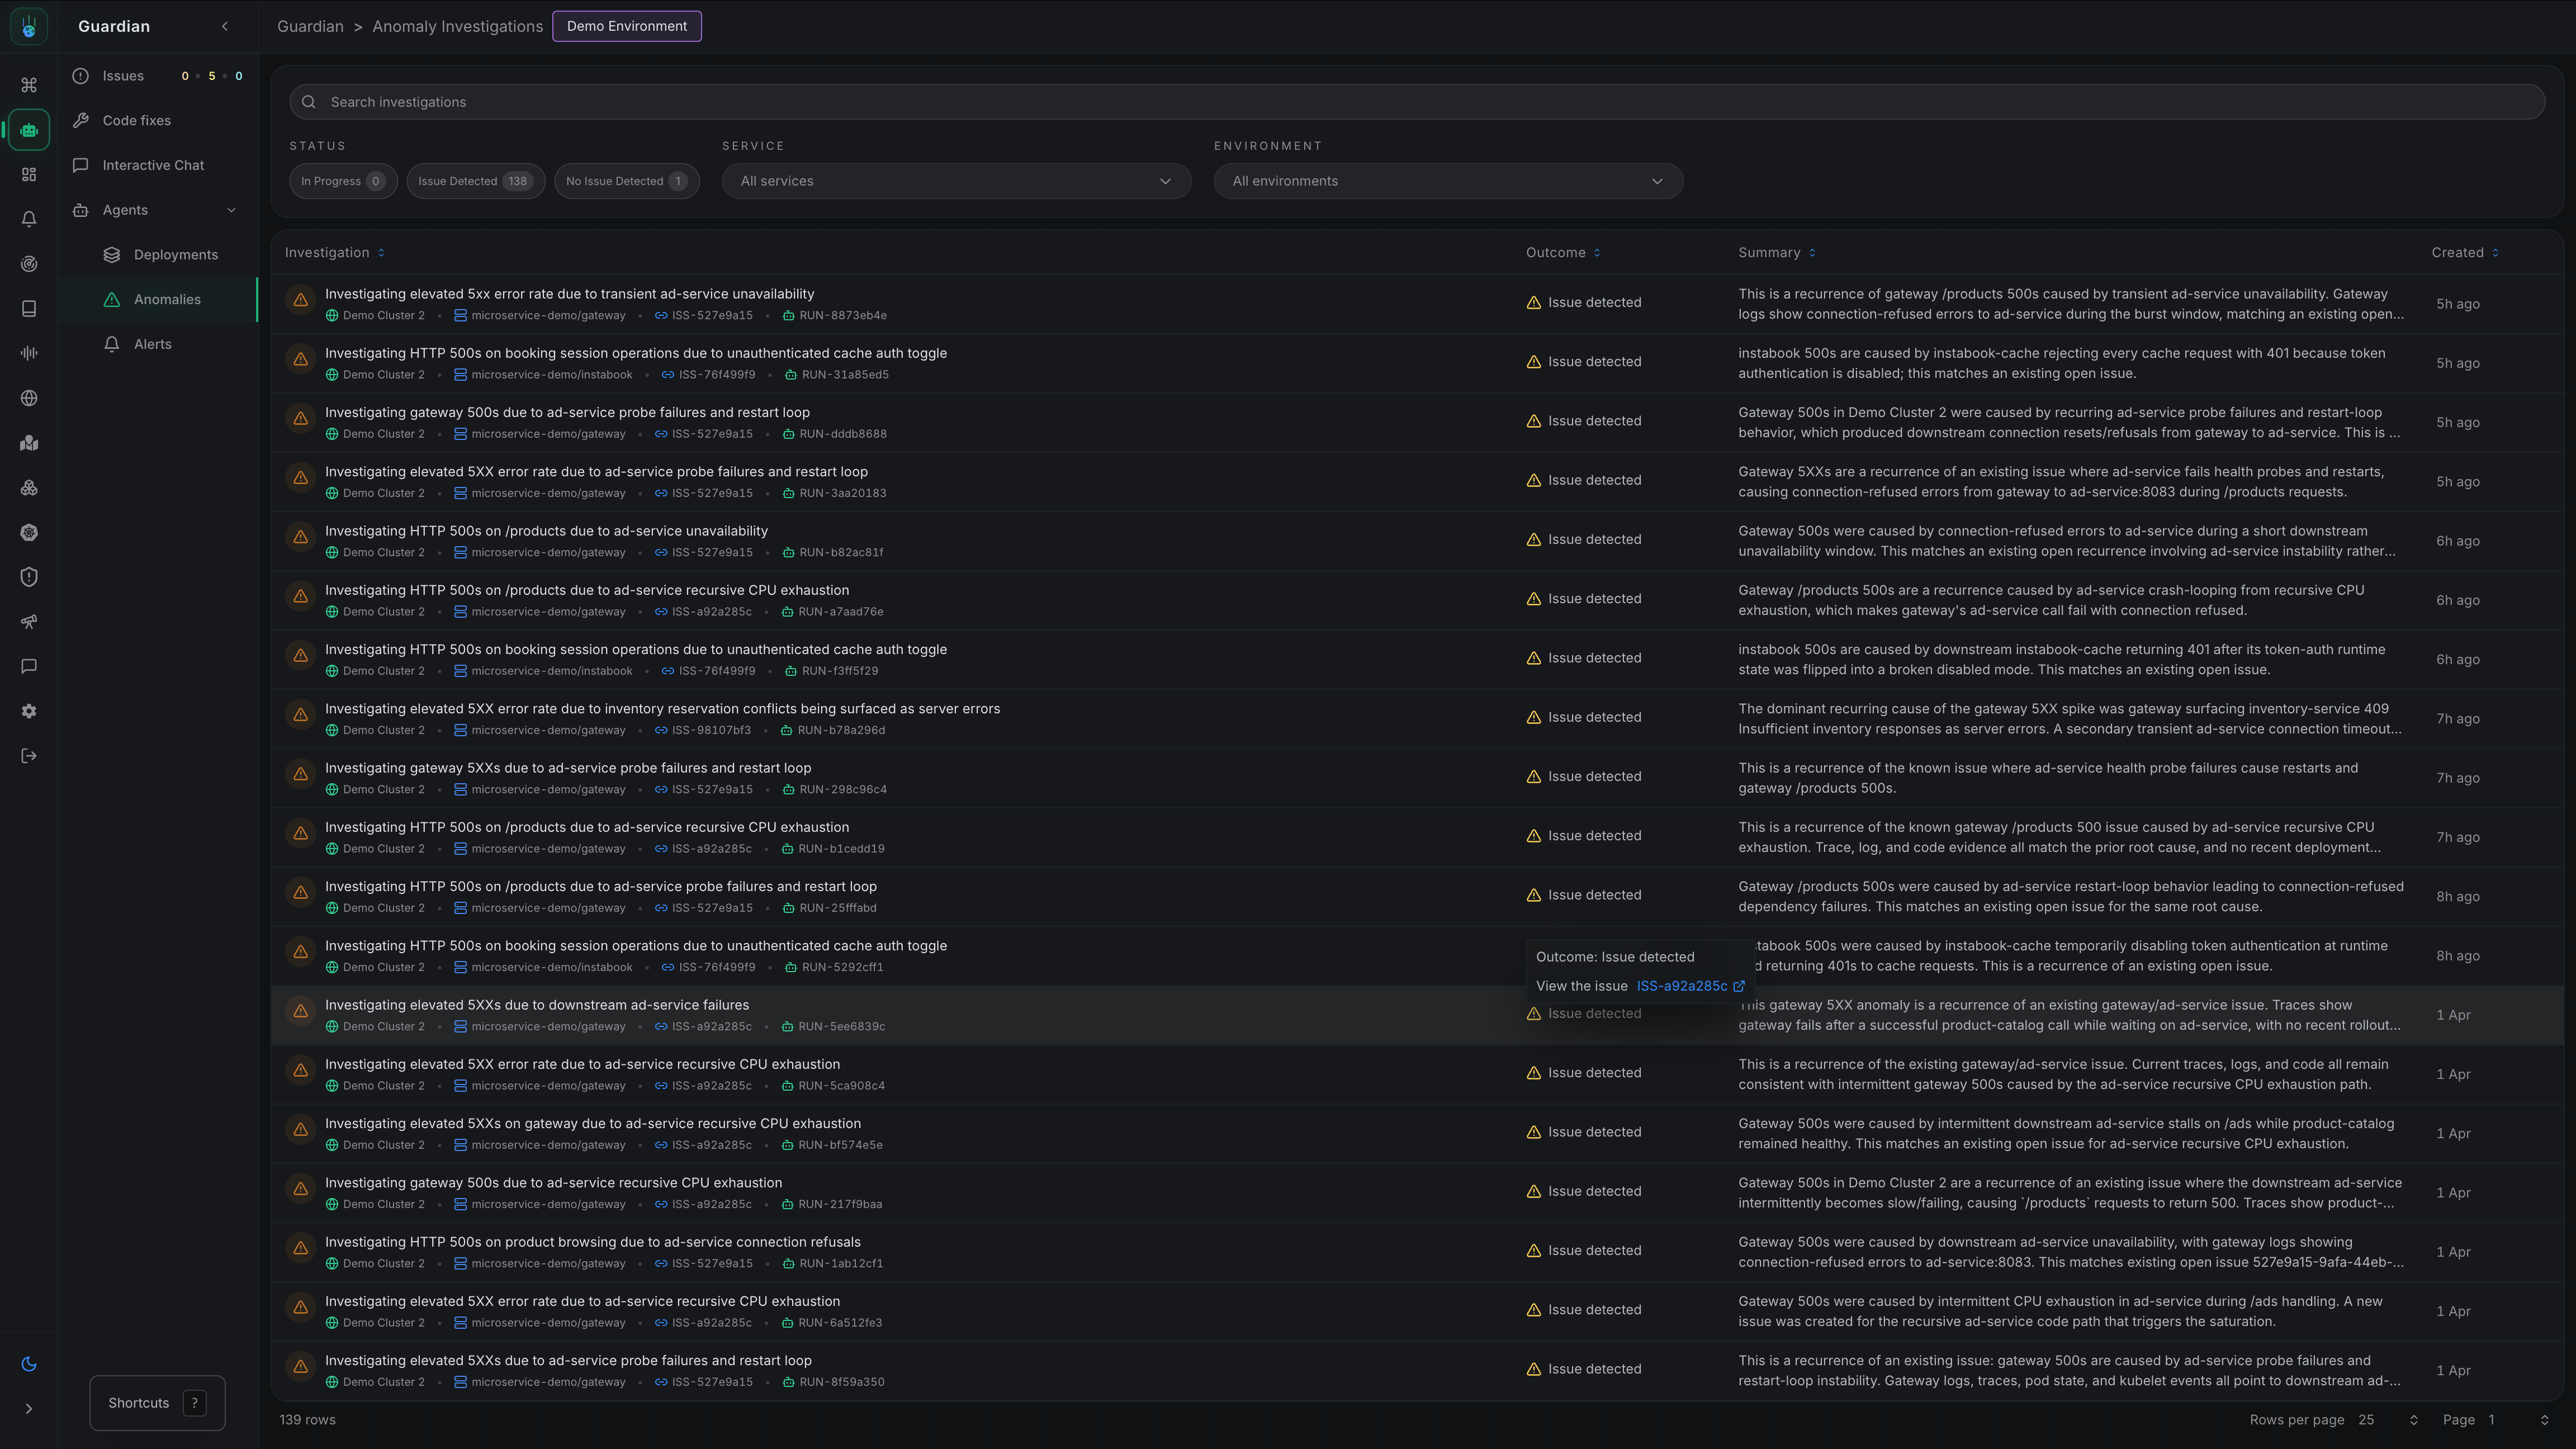 Click on an Anomaly Investigation to view its details and evidence.
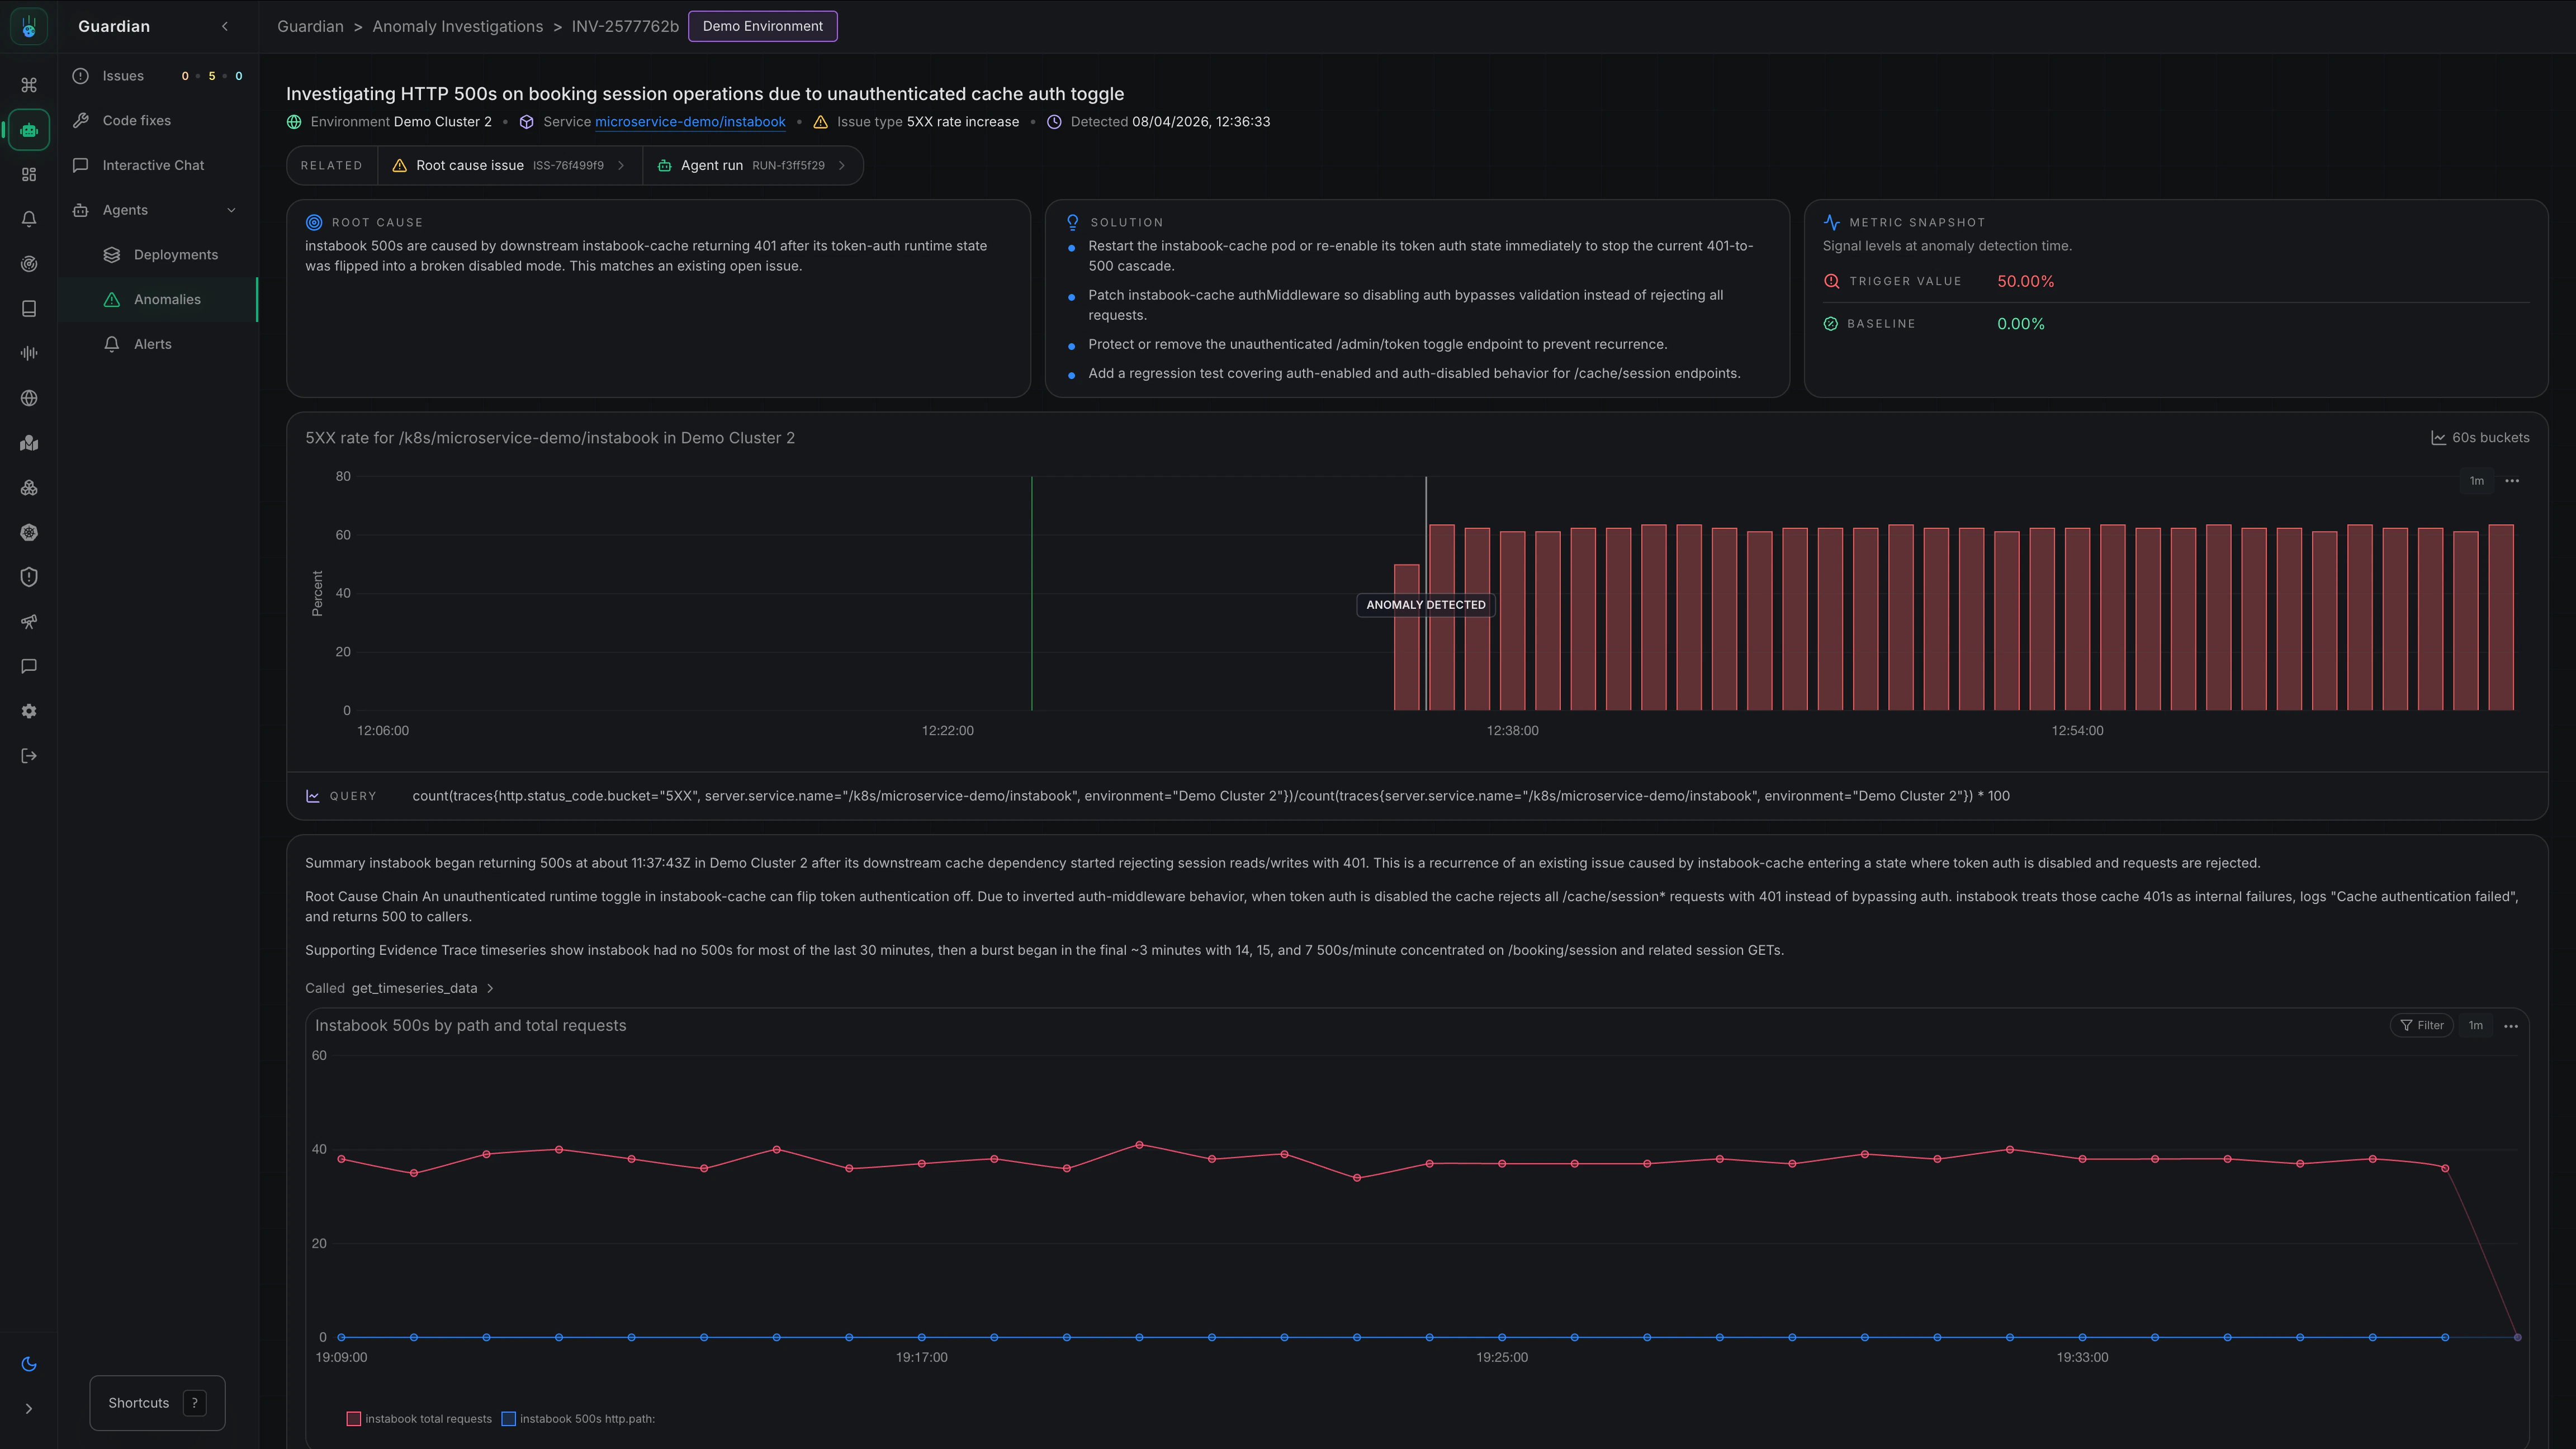 ## How It Works
1. **Detection** - Metoro continuously monitors your systems for anomalous behavior
2. **Investigation** - When an anomaly is detected, Metoro automatically runs an investigation
3. **Analysis** - Metoro determines whether the anomaly represents a real issue
4. **Notification** - If an issue is confirmed, Metoro posts to Slack with its findings
## Types of anomalies detected
Metoro anomaly detection currently covers:
* **5XX error rate spikes**
* **Pod failure spikes** for:
* `CrashLoopBackOff`
* `ImagePullBackOff`
* `ErrImagePull`
* `OOMKilled`
* `Init:Error`
## Enabling anomaly detection
### Step 1: Navigate to Settings
Go to **Settings** → **Features** → **Anomaly Detection**
[Take me there](https://us-east.metoro.io/settings?tab=features\&subtab=autonomous-investigation)
### Step 2: Enable Anomaly Detection
Toggle **Enable Anomaly Detection** to activate the feature.
### Step 3: Configure Detection Scope
Select which services and environments should have anomaly detection enabled:
* **Services** - Choose specific services or select all
* **Environments** - Choose specific environments (e.g., `prod`, `staging`)
We recommend starting with production environments to focus on the most impactful issues.
## Configuring notifications
Autonomous issue detection uses the same flexible notification configuration as other AI SRE workflows.
### Setting Up Notification Rules
1. Navigate to **Settings** → **Features** → **Autonomous Investigation**
2. Click **Add Notification Configuration**
3. Configure:
* **Services** - Which services should trigger notifications
* **Environments** - Which environments should trigger notifications
* **Destination** - Where to send notifications (Slack channel, webhook, etc.)
### Example Configurations
Route anomalies for critical services to an incidents channel:
* **Services**: `payment-service`, `auth-service`, `checkout-service`
* **Environments**: `prod`
* **Destination**: `#incidents`
Route all production anomalies to a monitoring channel:
* **Services**: All
* **Environments**: `prod`
* **Destination**: `#production-alerts`
Route anomalies to the owning team's channel:
**Config 1:**
* Services: `api-gateway`, `api-service`
* Environments: `prod`
* Destination: `#backend-team`
**Config 2:**
* Services: `web-frontend`, `mobile-bff`
* Environments: `prod`
* Destination: `#frontend-team`
## How this differs from alerts
| Feature | Alerts | Anomaly Detection |
| ----------------- | --------------------- | --------------------------- |
| **Configuration** | You define thresholds | Automatic baseline learning |
| **Trigger** | Fixed thresholds | Statistical anomalies |
| **Investigation** | Manual or runbook | Automatic |
| **Best for** | Known failure modes | Unknown unknowns |
Anomaly Detection and Alerts are complementary. Use alerts for known failure modes with specific thresholds, and anomaly detection to catch unexpected issues.
## Per-workload configuration
You can customize anomaly detection behavior for individual workloads using Kubernetes annotations. This allows you to fine-tune detection windows or disable detection entirely for specific services.
### Available Annotations
| Annotation | Type | Default | Range | Description |
| ------------------------------------------------ | ------ | --------- | ------------------ | ----------------------------------------------- |
| `metoro.io/anomaly-detection-disabled` | string | `"false"` | `"true"`/`"false"` | Disable anomaly detection for this workload |
| `metoro.io/anomaly-detection-baseline-minutes` | int | `30` | `5-30` | Baseline window for calculating normal behavior |
| `metoro.io/anomaly-detection-evaluation-minutes` | int | `5` | `1-10` | Evaluation window compared against baseline |
The evaluation window must be at most half the baseline window (e.g., if baseline is 10 minutes, evaluation can be at most 5 minutes). This ensures statistical validity of anomaly detection.
### Example: Disable Detection for a Service
For services with expected high error rates or batch jobs:
```yaml theme={null}
apiVersion: apps/v1
kind: Deployment
metadata:
name: batch-processor
annotations:
metoro.io/anomaly-detection-disabled: "true"
spec:
# ...
```
### Example: Shorter Detection Window
For services where you want faster detection at the cost of potentially more false positives:
```yaml theme={null}
apiVersion: apps/v1
kind: Deployment
metadata:
name: api-gateway
annotations:
metoro.io/anomaly-detection-baseline-minutes: "10"
metoro.io/anomaly-detection-evaluation-minutes: "2"
spec:
# ...
```
### Example: Longer Baseline for Stable Services
For stable services where you want to reduce noise:
```yaml theme={null}
apiVersion: apps/v1
kind: Deployment
metadata:
name: core-service
annotations:
metoro.io/anomaly-detection-baseline-minutes: "30"
metoro.io/anomaly-detection-evaluation-minutes: "10"
spec:
# ...
```
Annotations can be placed in either `metadata.annotations` or `spec.template.metadata.annotations`. The former takes precedence if both are specified.
## Anomaly Detection Coverage Matrix
Anomaly detection in Metoro is driven by a set of detectors that monitor for anomalies.
When a detector is triggered, it causes Metoro to investigate to determine if it represents a real issue.
We are always adding new detectors to improve coverage to reduce the chance of false positives.
| Issue Type | Anomaly Detection Coverage |
| ------------------------------------------------------------ | -------------------------- |
| **HTTP Server: 5XX error rate spike** | Yes |
| **HTTP Server: Request Rate Drop** | No |
| **HTTP Server: Request Rate Surge** | No |
| **HTTP Server: P50 Latency spike** | Yes |
| **HTTP Server: P90 Latency spike** | Yes |
| **HTTP Server: P95 Latency spike** | No |
| **HTTP Server: P99 Latency spike** | No |
| **External HTTP Dependencies: 5XX error rate spike** | Yes |
| **External HTTP Dependencies: Request Rate Drop** | No |
| **External HTTP Dependencies: Request Rate Surge** | No |
| **External HTTP Dependencies: P50 Latency spike** | Yes |
| **External HTTP Dependencies: P90 Latency spike** | Yes |
| **External HTTP Dependencies: P95 Latency spike** | No |
| **External HTTP Dependencies: P99 Latency spike** | No |
| **Database: Error rate spike** | Alpha |
| **Database: P95 Latency spike** | Alpha |
| **General Server (All Protocols): Error rate spike** | Alpha |
| **General Server (All Protocols): P50 Latency spike** | Alpha |
| **General Server (All Protocols): P90 Latency spike** | Alpha |
| **External Dependencies (All Protocols): Error rate spike** | Alpha |
| **External Dependencies (All Protocols): P50 Latency spike** | Alpha |
| **External Dependencies (All Protocols): P90 Latency spike** | Alpha |
| **Pod Failure: CrashLoopBackOff** | Yes |
| **Pod Failure: ImagePullBackOff** | Yes |
| **Pod Failure: ErrImagePull** | Yes |
| **Pod Failure: OOMKilled** | Yes |
| **Pod Failure: Init:Error** | Yes |
| **Pod Restart spike** | No |
| **Probe failure spike** | No |
| **Pod Scheduling: Pod Stuck in Pending** | No |
| **Unschedulable pod spike** | No |
| **Node-pressure eviction spike** | No |
| **Service Resource Usage: CPU Throttling** | Development |
| **Service Resource Usage: Network Send Rate** | Development |
| **Service Resource Usage: Network Receive Rate** | Development |
| **Service Resource Usage: Disk Write Rate** | Development |
| **Service Resource Usage: Disk Read Rate** | Development |
| **Service Resource Usage: Disk Usage** | Development |
| **Service Resource Allocation: CPU request too high** | Yes - Advisor |
| **Service Resource Allocation: CPU request too low** | Yes - Advisor |
| **Service Resource Allocation: CPU limit too low** | Yes - Advisor |
| **Service Resource Allocation: Memory request too high** | Yes - Advisor |
| **Service Resource Allocation: Memory request too low** | Yes - Advisor |
| **Service Resource Allocation: Memory limit too low** | Yes - Advisor |
| **Kubernetes Events: Cluster wide count of Warning Events** | Alpha |
| **Kubernetes Events: FailedScheduling** | No |
| **Kubernetes Events: BackOff** | No |
| **Kubernetes Events: FailedMount** | No |
| **Persistent Volume Claim (PVC) creation failure** | No |
| **Persistent Volume Claim (PVC) deletion failure** | No |
| **Persistent Volume Claim (PVC) Usage** | No |
| **PVC / volume unhealthy** | No |
| **Node Ready false / unknown** | No |
| **Node Resource Usage: CPU Throttling** | No |
| **Node MemoryPressure** | No |
| **Node DiskPressure** | No |
| **Node Resource Usage: Network Send Rate** | Alpha |
| **Node Resource Usage: Network Receive Rate** | Alpha |
| **API server not ready** | No |
| **Cluster Disk usage spike** | No |
| **Cluster Network error spike** | No |
| **Cluster CPU usage spike** | Development |
| **Cluster Memory usage spike** | Development |
| **Cluster Network TCP Retransmits** | Development |
`Yes` means the issue type is monitored by anomaly detection today.
`Beta` means the detector is available in limited rollout or behind a feature flag while tuning continues.
`Alpha` means the detector is in active development and early validation before broader rollout.
`Development` means the detector is in active development but not yet validated for signal quality.
`No` means the issue type is not currently monitored by anomaly detection but is in the backlog for future development.
`Advisor` means the signal is surfaced in Advisor rather than kicking off an anomaly investigation.
## Best practices
### Start with Production
Focus anomaly detection on production environments first, where issues have the most impact.
### Review investigation quality
Periodically review the investigations to ensure they're finding real issues:
* Are the anomalies significant?
* Is the root cause analysis accurate?
* Provide feedback to improve detection
### Combine with alerts
Use both anomaly detection and alerts:
* **Alerts** for critical thresholds you always want to know about
* **Anomaly detection** for catching unexpected issues
### Tune notification routing
Route notifications appropriately:
* Critical services → dedicated incident channels
* Non-critical services → general monitoring channels
## Related documentation
Automatic verification of deployments
Investigate firing alerts with AI
Configure investigation runbooks for alerts
Configure threshold-based alerts
## How It Works
1. **Detection** - Metoro continuously monitors your systems for anomalous behavior
2. **Investigation** - When an anomaly is detected, Metoro automatically runs an investigation
3. **Analysis** - Metoro determines whether the anomaly represents a real issue
4. **Notification** - If an issue is confirmed, Metoro posts to Slack with its findings
## Types of anomalies detected
Metoro anomaly detection currently covers:
* **5XX error rate spikes**
* **Pod failure spikes** for:
* `CrashLoopBackOff`
* `ImagePullBackOff`
* `ErrImagePull`
* `OOMKilled`
* `Init:Error`
## Enabling anomaly detection
### Step 1: Navigate to Settings
Go to **Settings** → **Features** → **Anomaly Detection**
[Take me there](https://us-east.metoro.io/settings?tab=features\&subtab=autonomous-investigation)
### Step 2: Enable Anomaly Detection
Toggle **Enable Anomaly Detection** to activate the feature.
### Step 3: Configure Detection Scope
Select which services and environments should have anomaly detection enabled:
* **Services** - Choose specific services or select all
* **Environments** - Choose specific environments (e.g., `prod`, `staging`)
We recommend starting with production environments to focus on the most impactful issues.
## Configuring notifications
Autonomous issue detection uses the same flexible notification configuration as other AI SRE workflows.
### Setting Up Notification Rules
1. Navigate to **Settings** → **Features** → **Autonomous Investigation**
2. Click **Add Notification Configuration**
3. Configure:
* **Services** - Which services should trigger notifications
* **Environments** - Which environments should trigger notifications
* **Destination** - Where to send notifications (Slack channel, webhook, etc.)
### Example Configurations
Route anomalies for critical services to an incidents channel:
* **Services**: `payment-service`, `auth-service`, `checkout-service`
* **Environments**: `prod`
* **Destination**: `#incidents`
Route all production anomalies to a monitoring channel:
* **Services**: All
* **Environments**: `prod`
* **Destination**: `#production-alerts`
Route anomalies to the owning team's channel:
**Config 1:**
* Services: `api-gateway`, `api-service`
* Environments: `prod`
* Destination: `#backend-team`
**Config 2:**
* Services: `web-frontend`, `mobile-bff`
* Environments: `prod`
* Destination: `#frontend-team`
## How this differs from alerts
| Feature | Alerts | Anomaly Detection |
| ----------------- | --------------------- | --------------------------- |
| **Configuration** | You define thresholds | Automatic baseline learning |
| **Trigger** | Fixed thresholds | Statistical anomalies |
| **Investigation** | Manual or runbook | Automatic |
| **Best for** | Known failure modes | Unknown unknowns |
Anomaly Detection and Alerts are complementary. Use alerts for known failure modes with specific thresholds, and anomaly detection to catch unexpected issues.
## Per-workload configuration
You can customize anomaly detection behavior for individual workloads using Kubernetes annotations. This allows you to fine-tune detection windows or disable detection entirely for specific services.
### Available Annotations
| Annotation | Type | Default | Range | Description |
| ------------------------------------------------ | ------ | --------- | ------------------ | ----------------------------------------------- |
| `metoro.io/anomaly-detection-disabled` | string | `"false"` | `"true"`/`"false"` | Disable anomaly detection for this workload |
| `metoro.io/anomaly-detection-baseline-minutes` | int | `30` | `5-30` | Baseline window for calculating normal behavior |
| `metoro.io/anomaly-detection-evaluation-minutes` | int | `5` | `1-10` | Evaluation window compared against baseline |
The evaluation window must be at most half the baseline window (e.g., if baseline is 10 minutes, evaluation can be at most 5 minutes). This ensures statistical validity of anomaly detection.
### Example: Disable Detection for a Service
For services with expected high error rates or batch jobs:
```yaml theme={null}
apiVersion: apps/v1
kind: Deployment
metadata:
name: batch-processor
annotations:
metoro.io/anomaly-detection-disabled: "true"
spec:
# ...
```
### Example: Shorter Detection Window
For services where you want faster detection at the cost of potentially more false positives:
```yaml theme={null}
apiVersion: apps/v1
kind: Deployment
metadata:
name: api-gateway
annotations:
metoro.io/anomaly-detection-baseline-minutes: "10"
metoro.io/anomaly-detection-evaluation-minutes: "2"
spec:
# ...
```
### Example: Longer Baseline for Stable Services
For stable services where you want to reduce noise:
```yaml theme={null}
apiVersion: apps/v1
kind: Deployment
metadata:
name: core-service
annotations:
metoro.io/anomaly-detection-baseline-minutes: "30"
metoro.io/anomaly-detection-evaluation-minutes: "10"
spec:
# ...
```
Annotations can be placed in either `metadata.annotations` or `spec.template.metadata.annotations`. The former takes precedence if both are specified.
## Anomaly Detection Coverage Matrix
Anomaly detection in Metoro is driven by a set of detectors that monitor for anomalies.
When a detector is triggered, it causes Metoro to investigate to determine if it represents a real issue.
We are always adding new detectors to improve coverage to reduce the chance of false positives.
| Issue Type | Anomaly Detection Coverage |
| ------------------------------------------------------------ | -------------------------- |
| **HTTP Server: 5XX error rate spike** | Yes |
| **HTTP Server: Request Rate Drop** | No |
| **HTTP Server: Request Rate Surge** | No |
| **HTTP Server: P50 Latency spike** | Yes |
| **HTTP Server: P90 Latency spike** | Yes |
| **HTTP Server: P95 Latency spike** | No |
| **HTTP Server: P99 Latency spike** | No |
| **External HTTP Dependencies: 5XX error rate spike** | Yes |
| **External HTTP Dependencies: Request Rate Drop** | No |
| **External HTTP Dependencies: Request Rate Surge** | No |
| **External HTTP Dependencies: P50 Latency spike** | Yes |
| **External HTTP Dependencies: P90 Latency spike** | Yes |
| **External HTTP Dependencies: P95 Latency spike** | No |
| **External HTTP Dependencies: P99 Latency spike** | No |
| **Database: Error rate spike** | Alpha |
| **Database: P95 Latency spike** | Alpha |
| **General Server (All Protocols): Error rate spike** | Alpha |
| **General Server (All Protocols): P50 Latency spike** | Alpha |
| **General Server (All Protocols): P90 Latency spike** | Alpha |
| **External Dependencies (All Protocols): Error rate spike** | Alpha |
| **External Dependencies (All Protocols): P50 Latency spike** | Alpha |
| **External Dependencies (All Protocols): P90 Latency spike** | Alpha |
| **Pod Failure: CrashLoopBackOff** | Yes |
| **Pod Failure: ImagePullBackOff** | Yes |
| **Pod Failure: ErrImagePull** | Yes |
| **Pod Failure: OOMKilled** | Yes |
| **Pod Failure: Init:Error** | Yes |
| **Pod Restart spike** | No |
| **Probe failure spike** | No |
| **Pod Scheduling: Pod Stuck in Pending** | No |
| **Unschedulable pod spike** | No |
| **Node-pressure eviction spike** | No |
| **Service Resource Usage: CPU Throttling** | Development |
| **Service Resource Usage: Network Send Rate** | Development |
| **Service Resource Usage: Network Receive Rate** | Development |
| **Service Resource Usage: Disk Write Rate** | Development |
| **Service Resource Usage: Disk Read Rate** | Development |
| **Service Resource Usage: Disk Usage** | Development |
| **Service Resource Allocation: CPU request too high** | Yes - Advisor |
| **Service Resource Allocation: CPU request too low** | Yes - Advisor |
| **Service Resource Allocation: CPU limit too low** | Yes - Advisor |
| **Service Resource Allocation: Memory request too high** | Yes - Advisor |
| **Service Resource Allocation: Memory request too low** | Yes - Advisor |
| **Service Resource Allocation: Memory limit too low** | Yes - Advisor |
| **Kubernetes Events: Cluster wide count of Warning Events** | Alpha |
| **Kubernetes Events: FailedScheduling** | No |
| **Kubernetes Events: BackOff** | No |
| **Kubernetes Events: FailedMount** | No |
| **Persistent Volume Claim (PVC) creation failure** | No |
| **Persistent Volume Claim (PVC) deletion failure** | No |
| **Persistent Volume Claim (PVC) Usage** | No |
| **PVC / volume unhealthy** | No |
| **Node Ready false / unknown** | No |
| **Node Resource Usage: CPU Throttling** | No |
| **Node MemoryPressure** | No |
| **Node DiskPressure** | No |
| **Node Resource Usage: Network Send Rate** | Alpha |
| **Node Resource Usage: Network Receive Rate** | Alpha |
| **API server not ready** | No |
| **Cluster Disk usage spike** | No |
| **Cluster Network error spike** | No |
| **Cluster CPU usage spike** | Development |
| **Cluster Memory usage spike** | Development |
| **Cluster Network TCP Retransmits** | Development |
`Yes` means the issue type is monitored by anomaly detection today.
`Beta` means the detector is available in limited rollout or behind a feature flag while tuning continues.
`Alpha` means the detector is in active development and early validation before broader rollout.
`Development` means the detector is in active development but not yet validated for signal quality.
`No` means the issue type is not currently monitored by anomaly detection but is in the backlog for future development.
`Advisor` means the signal is surfaced in Advisor rather than kicking off an anomaly investigation.
## Best practices
### Start with Production
Focus anomaly detection on production environments first, where issues have the most impact.
### Review investigation quality
Periodically review the investigations to ensure they're finding real issues:
* Are the anomalies significant?
* Is the root cause analysis accurate?
* Provide feedback to improve detection
### Combine with alerts
Use both anomaly detection and alerts:
* **Alerts** for critical thresholds you always want to know about
* **Anomaly detection** for catching unexpected issues
### Tune notification routing
Route notifications appropriately:
* Critical services → dedicated incident channels
* Non-critical services → general monitoring channels
## Related documentation
Automatic verification of deployments
Investigate firing alerts with AI
Configure investigation runbooks for alerts
Configure threshold-based alerts